Due:
10/21/03 at 2:00pm
This second assignment will build upon the first assignment and move us into 3D computer graphics. The first assignment mapped earthquake epicenters which are locations on the Earth's surface. However, earthquakes occur below the surface, so its more interesting to visualize the location of earthquake hypocenters as these rather nicely map onto tectonic plate boundaries. We will also make use of multiple windows in this assignment to create a more useful visualization environment.
This assignment will contain all the features of the first assignment plus some new ones.
- In the first assignment the landscape file contained a single polygon. For places like Japan, made up of multiple islands, this is not a good idea. In this assignment the landscape file can contain a landscape made up of multiple polygons, with each polygon separated by a blank line. The original data file for the first assignment should still work in this second assignment.
Here is an example of the new landscape file
- In the first assignment the latitude and longitude values were whole numbers. In this assignment they can be floating point values.
- This assignment will have a third data file consisting of city names. A sample file is given below. A small filled light square green polygon should mark the location of each city, and the name of the city should float next to the city on the display. For this assignment you are going to read in 3 datafiles that are specified on the command line. The new city name file will come last on the command line. You will need to create a second text output function to deal with the fact that the locations of the text will change as the landscape is moved, turned, and zoomed. The current magnitudes shown and the current date can still use the output function from assignment 1 since they are in fixed locations on the screen.
- In the first assignment the depth information in the earthquake file was ignored and the earthquakes were placed at depth 0. In this assignment you will use the depth information to place the earthquake beneath the surface. We will exaggerate the depth to make the earthquake hypocenters more visible. The X and S keys can be used by the user to increase or decrease this exaggeration respectively.
- You will use the mouse to rotate the visualization. Holding down the left mouse button and moving the mouse around the window should cause the landscape/earthquakes/city names to rotate about the center of the display - holding down the left button and moving the mouse up in the window should rotate the landscape from a 'top down' view to a 'side on South looking North' view, holding down the left button and moving the mouse left and right will similarly rotate the ladscape left and right. Rotations should all be relative to the current rotation.
You
will probably want to add something like this into your main:
glutMouseFunc(mouse);
glutMotionFunc(motion);
and
then write the following functions making use of things like
GLUT_LEFT_BUTTON, GLUT_UP, and GLUT_DOWN:
void mouse (int button, int state, int x, int y)
void motion (int x, int y)
- In the first assignment the earthquakes were marked by a 2D cross. Here each earthquake will be represented by a 3D cross so the earthquakes will still be visible while the rotate the image. The colours should be the same as in the first assignment.
- In the first assignment you used a 2D Orthographic view. Here we will use a perspective camera, something like: gluPerspective(60, 1, 1, 1000); along with something like gluLookAt(0, 0, 18, 0, 0, 0, 0, 1, 0); if you center the landscape at 0,0,0.
- In this assignment we will also turn on the depth buffer. All of the windows should use glutInitDisplayMode(GLUT_DOUBLE | GLUT_RGB | GLUT_DEPTH); and glClear should become glClear(GL_COLOR_BUFFER_BIT | GL_DEPTH_BUFFER_BIT); to clear both the colour buffer and the depth buffer.
- In the first assignment we made some simplifying assumptions about the longitude and latitude values we could handle. On this assignment we will be more general. In this assignment we will allow both east and west, north and south so we can look at anywhere on the planet. The only assumptions we will make is that the western value will be lower than the eastern (you can treat values in the west as being negative) we will not intentionally cross the international dateline in the middle of a model, or get too close to the poles. So, for example, California or Chile can now make nice example files.
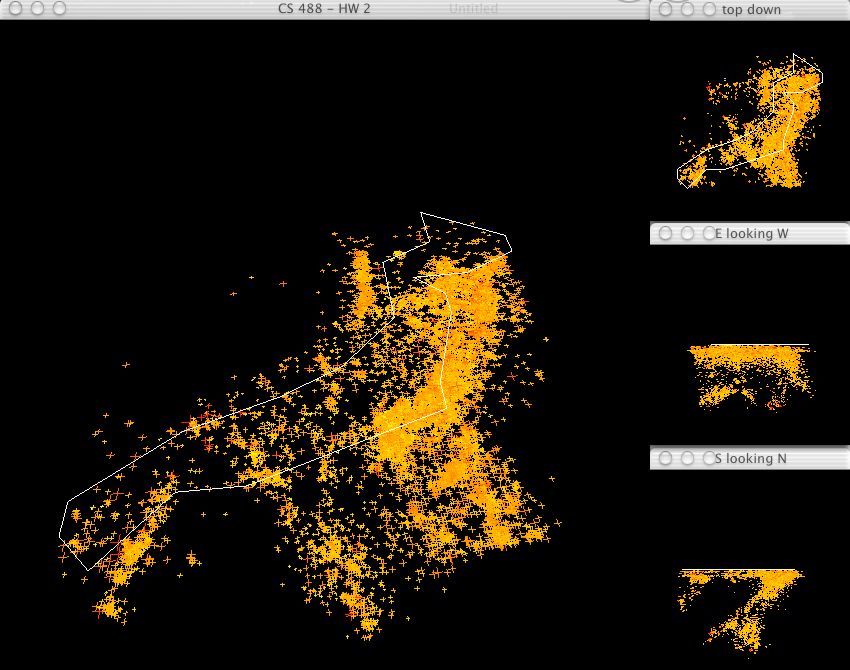
- The first assignment had a single window. This one will have 4. You will still have one large window to interact with that should be roughly 650 by 650 pixels, but you will also have 3 other smaller windows roughly 200 by 200 initially positioned in a column to the right of the main window. The reason the values are 'rough' is that you should initiall set the windows to an appropriate size to get the windows to line up on the CS department linux machines as in the screen dump below. While you can rotate and zoom in on the large window, the three smaller windows will have a fixed viewpoint. All of the windows should use a perspective camera and the gluLookAt function to place the camera. One of the smaller windows is a top down view with north at the top (like the way the large window looks initially), one will be sitting at zero elevation east of Japan looking west with up at the top, and the other will be south of Japan looking north with up at the top. Whichever earthquakes are visible in the main window (from doing playback and/or only seeing quakes above a certain magnitude) should be visible in the three smaller windows as well. The current date should only appear in the large window and not in the 3 smaller ones. To do this you will need to create more than one window with glutCreateWindow, and probably make use of glutInitWindowPosition as well as glutInitWindowSize. You will also need to keep track of the ID of each window created so that when you perform your draw function you can draw each of the four windows in turn using glutSetWindow. The other 3 smaller windows should only need a draw function and not any of the other functions that the large window has (timer, display, idle, keyboard, mouse, motion) since you will only interact with the large window.
The format of the city name file is given next. The first line contains the text "Latitude,Longitude,Name" and then the following lines contain a latitude, longitude, city name triple.The city name may may be made of multiple words.
Latitude,Longitude,Name
35.6, 139.66, Tokyo
34.6, 135.5, Osaka
42, 140.5, Sapporo
31.5, 130.7, Kagoshima
Your program should be well commented and be a good example of literate programming.
Your program will be submitted electronically. This will be discussed further in the discussion section. You can compile your program using the OpenGL libraries or any of the implementations of the Mesa libraries, and whatever platform you chose, but be sure that it compiles and runs as submitted on the linux machines in the CS lab because that is where we will be compiling and running your program.
Since you already have assignment 1 as a starting point, I would suggest first switching over to the perspective camera and making sure you can see things, then get the large window to work before moving onto the three smaller windows.
I would also highly recommend that you understand the code you are writing - you never know when you might need to reproduce it (hint hint).
In this assignment you can use glTranslate, glRotate and glScale.
And as another hint, in order to test the more general latitude/longitude capabilities of assignment 2 we will use the Japan data file and also a set of files for Chile: lat/lon 15 to 55 S (or -55 to -15 N) and 55 to 90W ( or -90 to -55 E), quakes magnitude 3 or above from 1970 to the present, and the cities Arica, La Serena, Santiago, Valdivia, Punta Arenas so you may want to go to the web site http://wwwneic.cr.usgs.gov/neis/epic/epic_rect.html and generate your own earthquake dataset for testing. There are also several nice sites on the web where you can find the longitude and latitude details of the country and city.
Note that initially 2 of the windows on the right side of the screen were mis-named. The S looking N and E looking W windows were reversed. Above is the correct version.