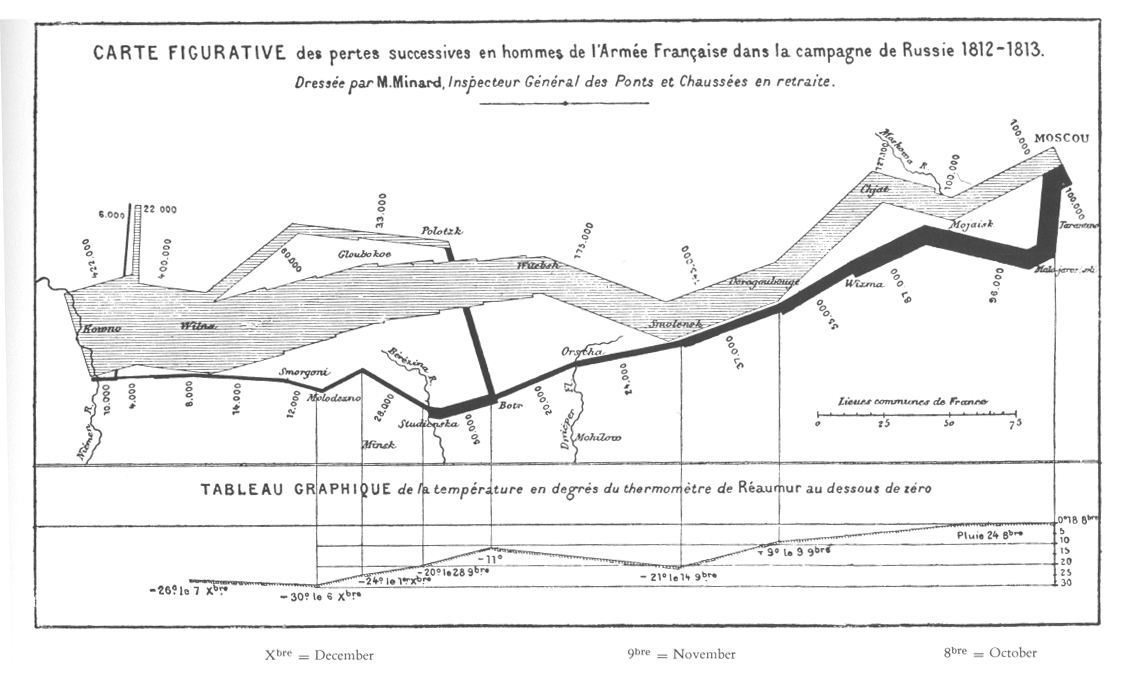
from p41 of TheVisual Display of Quantitative Information
Making a program work for you is pretty easy. Making it work for another user is much harder You need to think about the actual users of your software early in the design stage, and keep their needs in mind all the time.
Engineers are not trained in design and psychology and these are increasingly important in writing good software. People in general have a hard time sitting quietly while people criticize your hard work, but this is very important to creating a useful product.
This course is not about using widgets to create Windows/Icon based interfaces. It is about the procedures to go through to create good designs and then evaluate them.
First we will look at good and bad design in general, independent of computer programs. We will look at how to effectively present information. We will look at tradional user interfaces such as keyboards and mice. We will look at how to perform evaluation of these traditional interfaces and look at specific case studies. We will finally look at interfaces to support groupwork and more current human-computer interfaces such as speach, immersive environments.
Start by looking at Interfaces for
Two concptual models
the designer's conceptual model
the user's conceptual model.
The system image is the visible part of a device (including the physical structure, the documentation, instructions, etc). The designer only talks to the user through the system image. If the system image doesn't make the design model clear then the user will create a differnet model through their interaction.
Mental models - conceptual model of the way something works, often constructed from fragmentary evidence
Thermostat - will a room or oven heat (or cool) faster if the thermostat is turned all the way to the maximum setting?
2 'folk' theories of thermostats
timer theory - thermostat
controls the relative proportion of time that the device stays on
valve theory - thermostat
controls how much heat (cold) comes out of the device
both are wrong
thermostat is an on/off
switch - fully on or fully off - no inbetween
design gives no hint to the actual model
user's form their own theories
Why is the basic automobile easy to figure out?
Mapping - relationship between controls and their affects. Want
the mapping to be 'natural' - taking advantage of physical analogies and
cultural standards.
steering wheel
stove burners
light switches
Examples from my new house
no writeups on the appliances
trial and error
light switch for fan/lights
in family room
controls for the stove
dryer
Constraints
interlocks - prevent accidental use of a device
force operations to take
place in proper sequence
pin on fire extinguisher
or hand grenade
lockins - keeps operation active preventing
someone from permanently stopping it
word processor
lockouts - prevents an event from occuring
in case of fire, cant go
below the first floor on stairs
7 stages of action
7 Stages as Design Aid
How easily can a person
Determine the function of the device
Tell what actions are possible
Determine mapping from intention to physical
movement
Perform the action
Tell if system is in desired state
Determine mapping from system state to interpretation
Tell what state system is in
Gulf of execution
how well does the system allow someone to do their
intended actions directly
do the affordances provided by the system match
the actions intended by the person
bad if not clear what actions need to be done to
accomplish the intention
Gulf of evluation
how well does the system provide a visible state
that can be directly perceived and that
is interperable in terms
of the intentions and expectations of the user
how much effort user must exert to interpret the
state of the system and determine how
well the expectations and
intentions have been met
Designing for error
1. Understand the cause of error and design to minimize those causes
2. Make it possible to reverse (undo) actions, or make it harder to
do what cannot be reversed
3. Make it easier to discover errors that do occur and make them easier
to correct
4. Think of an object's user as attempting to do a task, getting there
by imperfect approximations, Don't think of the user as making errors,
think of the actions as approximations of what is desired
Visibility - User can tell the state of the device and the alternatives
for action
Good conceptual model - User given consistent in presentation
of operations and results
Good Mappings - easy to determine relationships between actions
and results, controls and
their effects, system state and whats visible
Feedback - User receives full and continuous feedback
Coming Next Time
Information Visualization
e.g. the following figure described as possibly the best statistical graph ever drawn

from p41 of TheVisual Display of Quantitative Information
Illustration drawn by Charles Joseph Minard in 1861 portraying Napoleon's losses during his 1812 march to and from Moscow
The chart show 6 variables
size of the army
location on a 2D surface
direction of the army's movement
temperature