CS526 : Project 1 Homepage
Contents
FEATURES
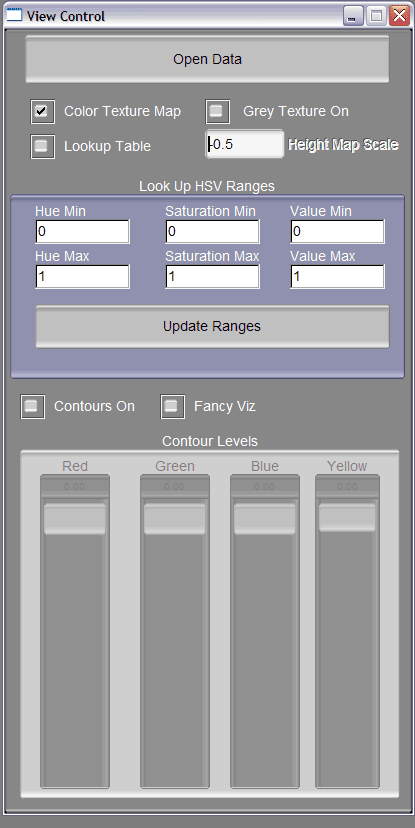
The application has a two main windows. The first is the View Control window. This window seen below lets the user manipulate what kind of data is displayed on the screen. The user must first load up the data in order to manipulate what way the data should be displayed, from textured height maps to rescaled height maps to 3D contours in stereo.
Figure 1. The View Control GUI
When the user clicks on the "Open Data" button on the top of the View Control window, a window that is used to specify the data files to load will be popped up (see below).
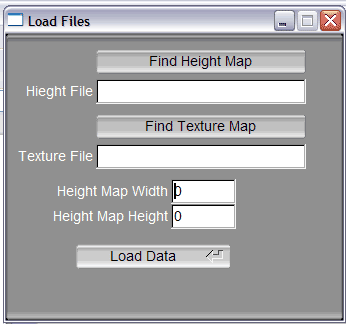
Figure 2. Load Files GUI
The user just has to click on the "Find Height Map" and "Find Texture Map" buttons to open up a file browser where they can specify the RAW image data files to load up (see below). The user also has to specify the width and height of the data set. It is assumed that the texture map file is in the form of interleaved RGB data, and the height map is a grayscale image.
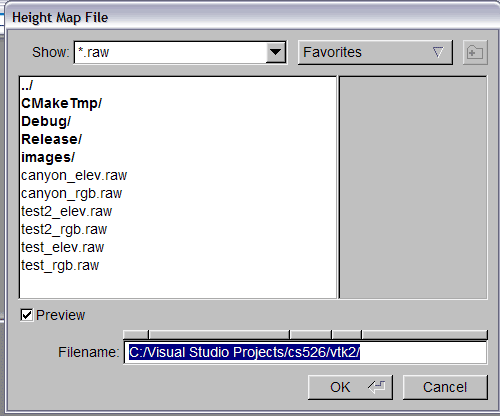
Figure 3. The File Browser
The file browsers that pop up will automatically filter for directories and files with the ".raw" extension. Once a file is selected, the user can press OK and the Load Files GUI will update itself with the new file name.
After loading up the data. The user can select different view settings on the View Control window. Once a change has been made (e.g. the user turns on Contours), the View Control window will update its state and interface, and the VTK window will update its rendering. Please take note that some sequence of changes requires time to reconstruct the VTK pipeline needed to render the correct data. If the user wants to rescale the height map, all that has to be done is to change the value on the "Height Map Scale" input box and then press the Enter key.
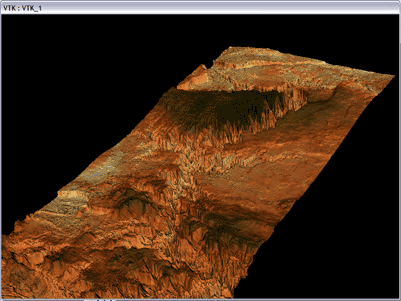
Figure 4. Textured Terrain
Above we see the default rendering of this application. The textured terrain view is simply a height map generated from the grayscale data with the user defined texture applied to the height map. If the user ever wishes to see this view, all that has to be done is making sure the "Color Texture Map" check box on the View Control GUI is checked. The user can also look at the grayscale version of the textured terrain by checking the "Grey Texture On" check box. Below is an image of the terrain with a grayscale texture map.
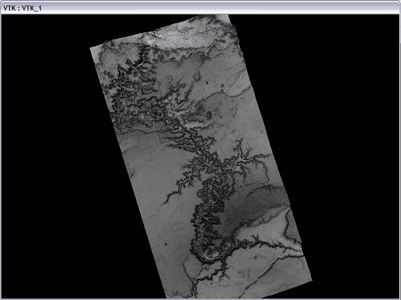
Figure 5. Grayscale Textured Terrain
The user can also look at the data using a colormap by checking the "Lookup Table" checkbox. The color map is defined by the HSV Range (Hue-Saturation-Value) settings on the View Control window. Below is an image of the data from Figure 5 translated into a colormap. The colormaps use a table of 32 possible colors to map elevation data to a color. The image below is using a set of values from 0.0 to 1.0 for each HSV component.
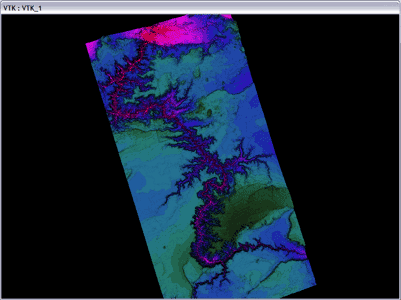
Figure 6. Colormapped Terrain
The user can also add contours to their visualization. To do this, a user would simply need to make sure the "Contours On" checkbox is checked. By default the checkbox for contours is turned off. Once the user turns on contour visualization, the value sliders at the bottom of the View Control window become activated and allow you to modify what value the contour will represent (by default all contours are set to 0.0 and can vary from 0.0 to 255).
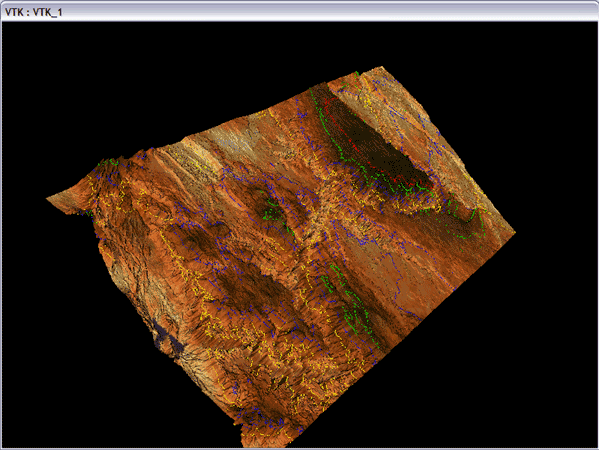
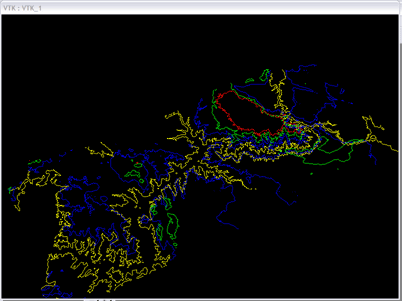
Figure 7. 3D Contour & Textured Terrain Visualization Figure 8. 3D Contour Visualization
Above are two examples of how contours can be seen. On the left we se the contours applied on the texture terrain. Sometimes this can be useful, and to do this the user only has to make sure that the "Contours On" and "Color Texture Map" checkboxes are both checked. If the user only wishes to see the 3D contours by themselves, then just make sure that the "Color Texture Map", "Grey Texture On" and "Lookup Table" checkboxes are unchecked.
Suppose that the user wishes to change the data set to view, but wishes to keep the same contour levels being used. The application will keep track of those contour values and remap the contours onto the new data set. Seen below is an example of the remapped contours when changing data sets. The contours in Figure 9 represent the same scalar elevation data as the contours in Figures 7 & 8.
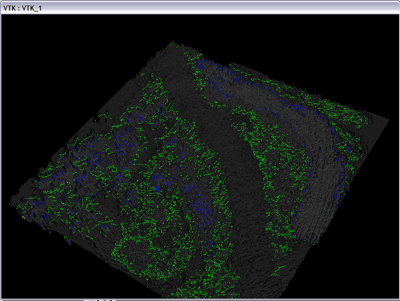
Figure 9. Remapped Contours On New Data Sets
As if all of this was not enough, one more visualization method was added to the application. When the user checks the "Fancy Viz" checkbox, whatever view that is being rendered will be rendered in Red-Blue stereo. If you have Red-Blue stereo glasses, you can try to look at the image below with the glasses on. Do you see it in stereo? This rendering mode can be fairly taxing on some graphics cards.
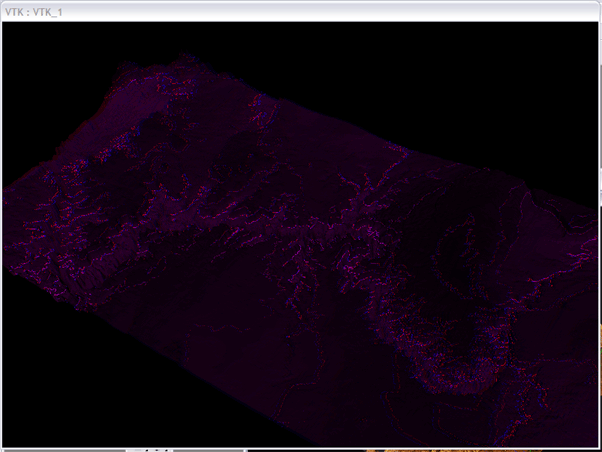
Figure 10. Red-Blue Stereo Rendering of 3D Contours on Colormapped Terrain
Downloads
If you would like to download the application, or the source code, please click on the following links:
Project 1 Binaries - Download for Windows
Project 1 Source Code - Download for Windows
Here are the home directories of the libraries used for creating the source code, and needed for building the source code.
Build Instructions
The following instructions are packaged with the source code.
_________________________________________________________________________________________________________
In order to build this project you will need Microsoft Visual Studio 6.0 or .NET.
The project is already setup to be compiled but the following libraries need to be installed and setup
in the Visual Studio environment:
- VTK 4.2.5 : Place all the include files from VTK into a folder called "vtk" and place that
folder in the Visual C++ include directory. Then place all the static library files into the
Visual C++ lib directory. This will make your life easier by not having to setup the paths
in the Visual Studio environment
- Quanta 0.2: Once again you can place all the include and library files in a similar manner to that done with
the VTK files. You can use Quanta 0.3, but I can't say that the project will compile or not have any bugs
(i.e. I am not supporting Quanta 0.3 on this program).
- FLTK 1.1.4 : This is needed for the GUI. If you desire to do the same thing as above then go ahead.
If you would rather setup the paths correctly please go ahead and do so for the Quanta and FLTK paths. For the
VTK files, just follow the directions above.
_________________________________________________________________________________________________________
_________________________________________________________________________________________________________