Final - Crazy Train
This project focused on data collection and visualizaiton of sensors form smart phones while riding the CTA blue line. This project was appealing to me because I own an andriod phone. I was intrested in creating a sensor logger app and visualing the data.
Tool: Processing, Eclipse.
Data Processing:
Processing, Java
Source Code:
www.evl.uic.edu/ekahle2/524/final/kahler.final.zip
www.evl.uic.edu/ekahle2/524/final/kahler.jpg
Running the code:
Unzip the file, open processing, run.
Data Collection:
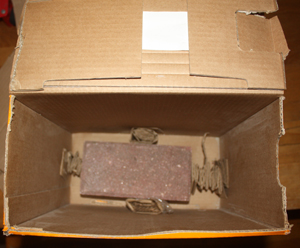
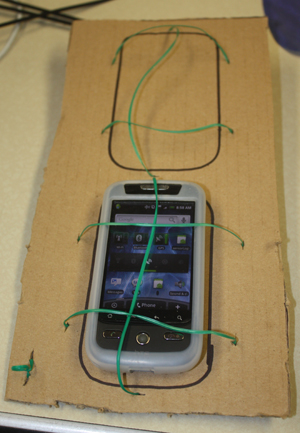
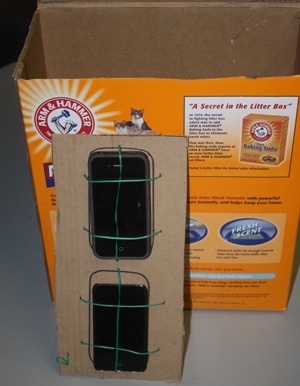
Because the CTA train is not a safe place for open electroincis I felt it would be wise to discuise our devices. I choose a cat litter box because I felt it had no value and could easly support a weight (a brick) to both weigh down the box to avoid movment and better transfer the forces to the phone. The brick was secured at the bottom of the box, and the phones were secured to a layer of cardboard. The card board was inserted into a snug fit inside the box.
Android app:
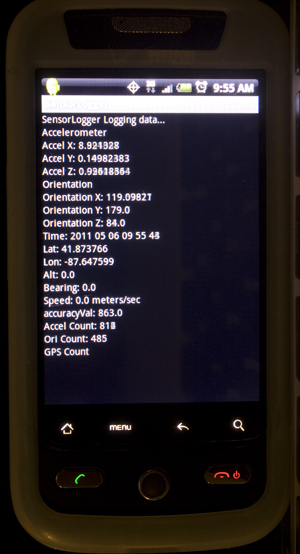
The android app was created in eclipse using the android sdk. The sensors were accessed based on a example privided by IBM.
The Vis:
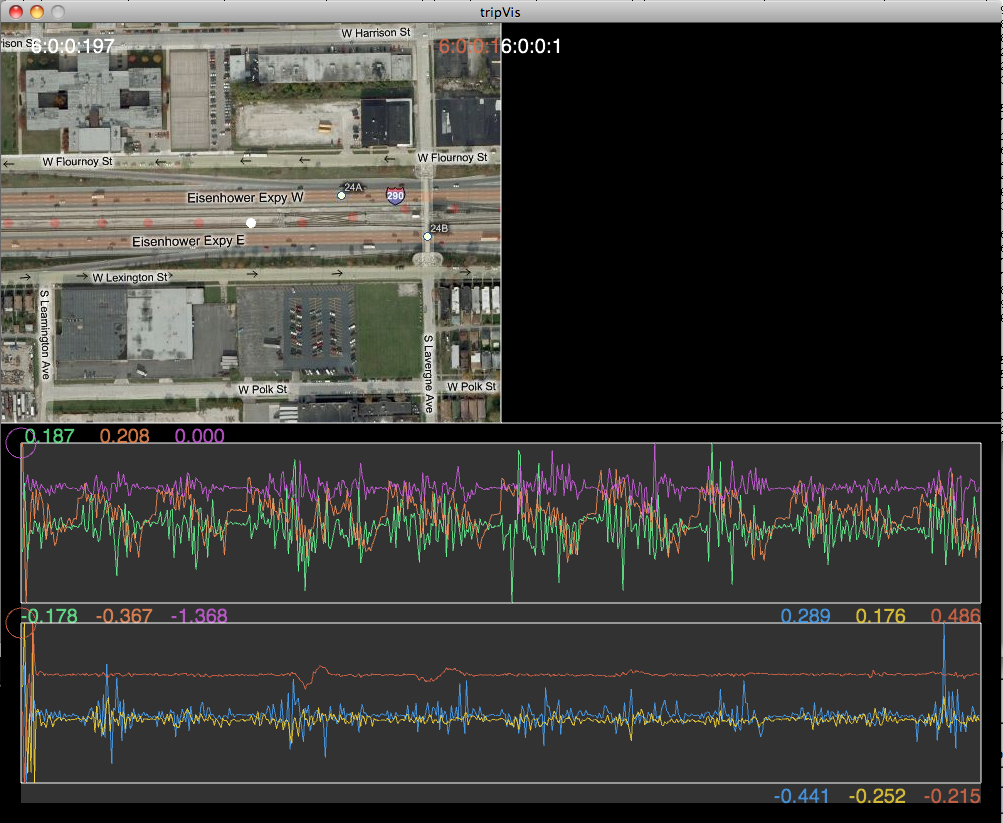
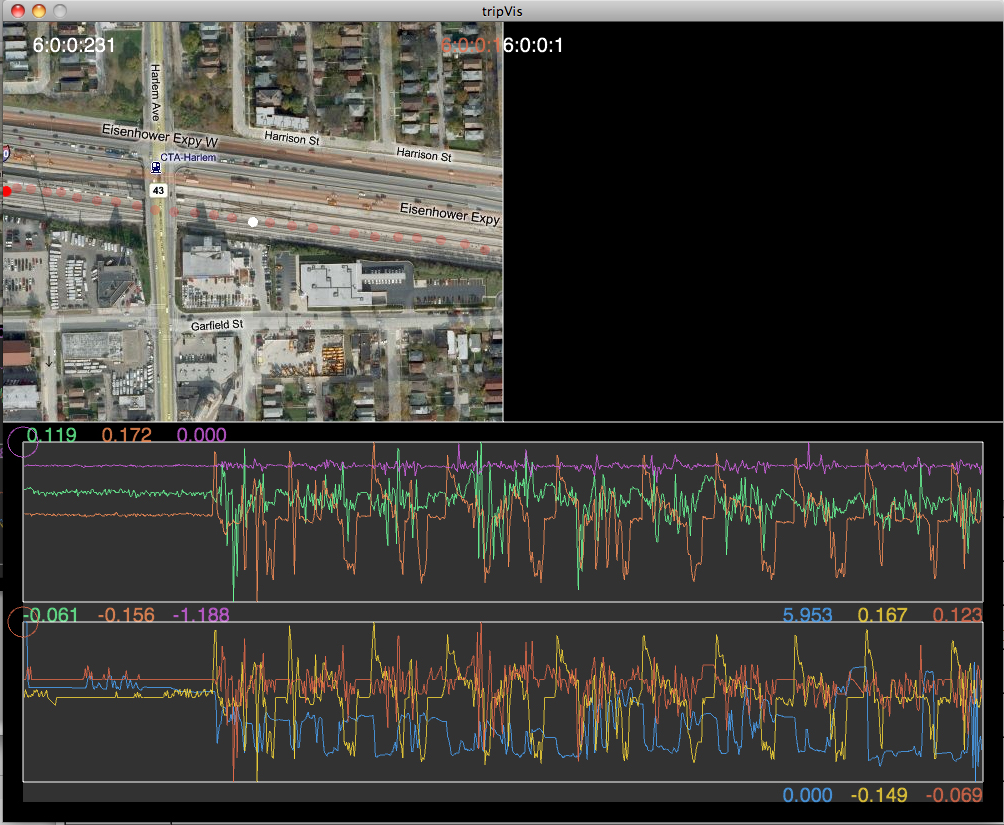
The visualization has three main components: geographic, orientation, and sensor view which correspond to the collected data.
Geographic View:
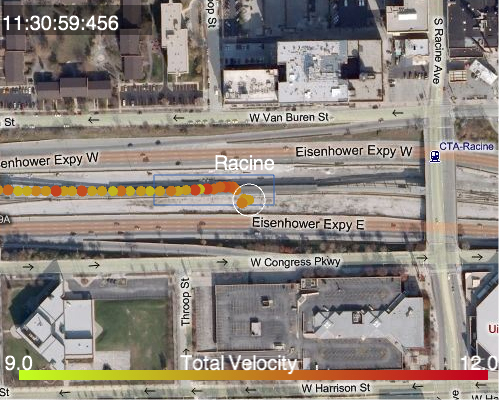
This view contains:
Time stamp.
White circlee representing gps accuracy.
All gps entries colored by Total Velocity.
Pan and zoom.
Train staions marked with blue rectangle.
Mouse over to pause animation.
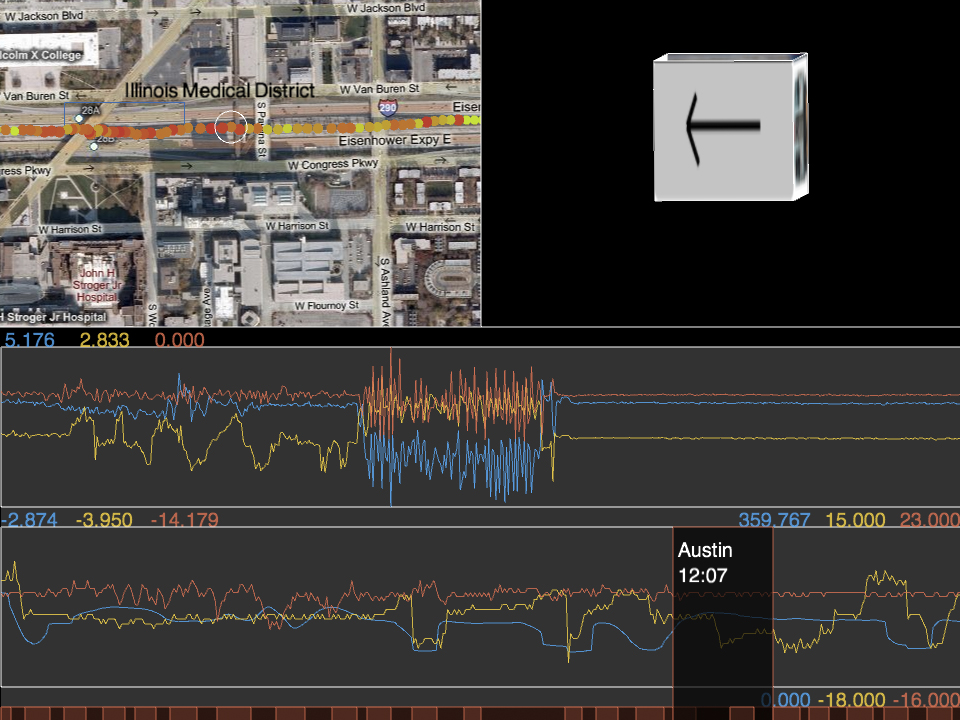
Orientation View:
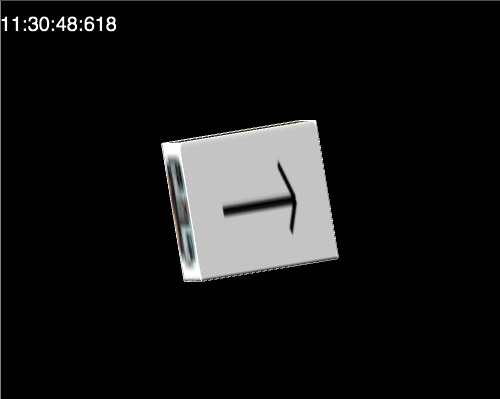
This view was intended to be a 3D representation of a CTA train. The sides of the cube are textured as a cta train with an fowared facing arrow in the top.
Sensor View:
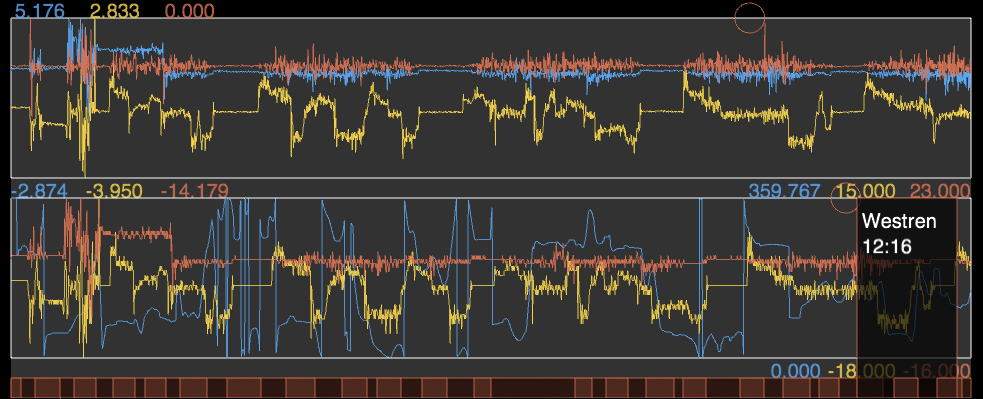
This view shows the representation of the velocity and orientation sensor.
Left click pans the graph
mouse wheel zooms in
mouse over bottom bar shows temproal information
min / max values for all axis shown in corresponding color.
'1','2','3' controlls view of 'x','y','z' axis
'q' - loads rar andriod data
'w' - loads processed android data
'e' - loads processed iphone data
Findings:
Android sensors are noisy
Trains have increasing total velocity around stations and through curves.
Compairing the data:
Android Processed:
Iphone Processed: