Dave's Gallery - Animations
Please excuse the mediocre image quality of these animations - they
were grabbed off of videotape. They're all older animations,
and the original digital images no longer exist.
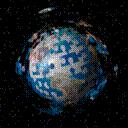 Puzzle Earth animation (286k)
A segment from the NASA Earth Observing System p.r. video
"Earth: A New Perspective".
This sequence was intended to 'illustrate' how, before the global view
provided by EOS, scientists would "study the Earth piece by piece".
The video was truly a project from hell - I had to generate over 20
minutes of animation from about a dozen different global datasets
(several animated); the final rendering required roughly 2 CPU-months
on a small herd of VGX Irises. The whole video took at least a year
to produce and went through uncountably many revisions
(I worked on just the Earth animations, but observed the rest
of the process).
The original plan was for a 5-10 minute video; the final result was
22 minutes; after that, a condensed 10 minute version was also created.
Opinions of the video ranged from great praise to complete disgust
(the test audience of middle- & high-school students found it
incredibly boring).
 Hawaii Flyby (400k)
A flyby of the ocean floor around the Hawaiian islands. This
was produced as a test/demo for the JASON IV project. We were
proposing to create an animation of the Galapagos Islands, but
didn't have any data for them at first. The interesting texturing
on the ocean floor was caused by some unknown bug in the surface normal
calculations; people always seem to like it though, thinking that it's
supposed to be light caustics.
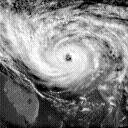 Hurricane Hugo Flyby (613k)
A flyby of Hurricane Hugo as it crashes into Florida. The animation
was created using infrared and visible images from the GOES weather
satellite; the infrared data is used to determine the cloud-top
elevation. We produced a number of such animations at the SVS in
conjunction with the atmospheric scientists in Goddard's Severe Storms Branch,
to illustrate the three-dimensional structure of the storms.
Unfortunately, practically every TV weatherman these days has started using
cheezy 3D flybys of satellite data; they make things look so exciting,
but actually tend to convey less information than an old-fashioned,
straightforward 2D display, so it's somewhat embarrassing to admit
to ever having done such work.
 ISCCP Clouds (657k)
The global cloud cover for October 1983. The data was generated
by the Bill Rossow of NASA/GISS for the International Satellite Cloud
Climatology Project. It was derived from images from a group of
geostationary weather satellites, showing the cloud cover at
a .5 degree resolution at three hour intervals. (The full dataset
covers several years and includes a number of different variables
besides cloud cover.)
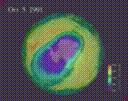 Ozone '91 (450k)
Part of an animation showing the global stratospheric ozone density for 1991,
focusing on the Antarctic ozone hole. This video was produced for Mark
Schoeberl of Goddard's Laboratory for Atmospheres, who provided the
TOMS data used in the animation. This video has been rather popular, and
seems to pop up unexpectedly in all sorts of places. It was originally
shown on Prime Time Live for their story on the ozone hole; it was
later included on SGI's "video news release" promoting the TFP chip,
which was shown (in part) on various local news shows.
Since then, it has also been spotted on a Saturday morning kids' news
show ("Not Just News" or "News for Kids" or something like that),
in the Chicago Museum of Science & Industry's Imaging exhibit,
and at the New York State Fair (in the Niagara Mohawk booth).
Last modified 27 October 1994.
Dave Pape, pape@evl.uic.edu