
Supporting Collaborative Exploratory Visual Data Analysis in Multi-device Environments
November 1st, 2021
Categories: Applications, Devices, Human Factors, MS / PhD Thesis, Software, Visualization, Visual Analytics, Human Computer Interaction (HCI), Data Science
Authors
Alsaiari, A.About
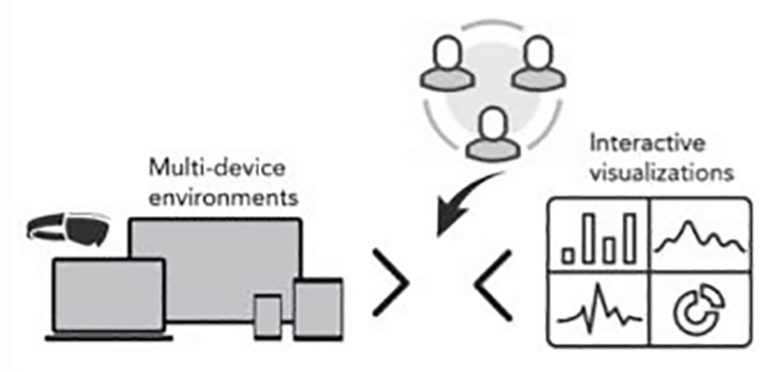
There is a steadily growing interest in leveraging ecosystems of digital devices that go beyond a single desktop for collaborative visual data analysis and exploration. This new thrust of multi-device interfaces supports new models for complex collaboration scenarios, and have great potential to support analysts in their data analysis by utilizing each device’s capabilities. However, there are some challenges inherently associated with visual data analysis in multi-device environments (MDE). This dissertation investigates how the analytical process occurs in multi-user multi-device environments to provide a theoretical understanding of collaborative exploratory visual data analysis and better inform the design of visualization tools. First, I touched on the challenges of designing cross-device visualization tools by introducing the design and implementation of a multi-device system for collaborative visual data analysis that enables cross-device visualization sharing and simultaneous interaction. Then, through an exploratory user study, I evaluated strategies of exploratory visual data analysis in a collaborative multi-user multi-device environment. I synthesized a two-level characterization of the analysis structure from observed analysis behaviors. I observed that subjects navigate the data space in three identified exploration patterns and the analysis was primarily depth-oriented. In addition, the cost of deciding what to explore next “Gulf of Goal Formation” is higher in collaborative settings due to short-term memory and the recency effect. I hypothesized that visualizing the dimensions search space would increase the breadth of the analysis and reduce the decision cost. Using a between-groups study, I evaluated the effect of revealing information about what dimension’s data space coverage(s) were investigated and what were left. The results indicate that visualizing dimensions search space increases the breadth of the analysis and reduces the decision cost by positively affecting the rate of views generation.
Resources
Citation
Alsaiari, A., Supporting Collaborative Exploratory Visual Data Analysis in Multi-device Environments, Submitted in partial fulfillment of the requirements for the degree of Doctor of Philosophy in Computer Science, Graduate College of the University of Illinois Chicago, November 1st, 2021.