 plants 1 through
4
plants 1 through
4
More on the
Project 2
Project 2 will give you a chance to learn Java/Swing on a small assignment before we proceed onto Project 3.
Each person will work individually on this project. Project 2 is NOT a team project.
It is expected that all of the java code used in these programs will be written by you. You can use code from the web as examples and a guide to writing your code, but the code must be your own. We will be using computer software to compare people's programs and it is very good at finding similar programs.
Any code, images, or other elements borrowed from others must be cited in the work.
This project will not have a public critique phase.
Now onto the project itself.
In this project you will create a user interface similar to one which I created last year as part of a research project. This research project involves using virtual reality to create an environment where elementary school kids can collect data to learn about the scientific method. The space that the kids explore is a large field divided into 9 regions. Into these regions the teacher can place plants and then the kids can look at where the plants are growing, which plants grow near other plants, etc. So instead of going out to a field to collect rocks or bugs, the kids visit this more controlled space to learn appropriate techniques before dealing with the messy data of the real world.
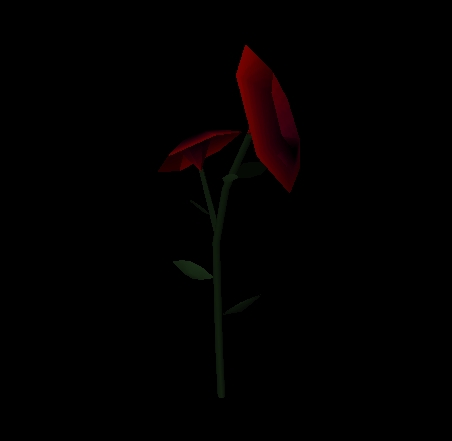
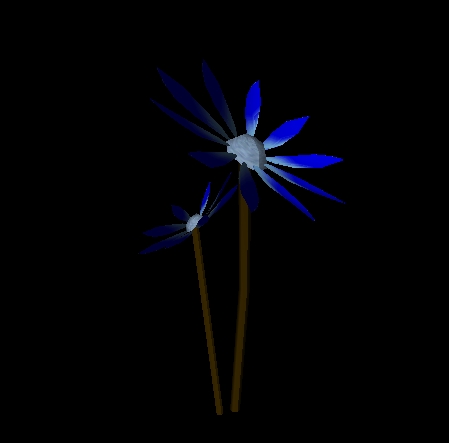
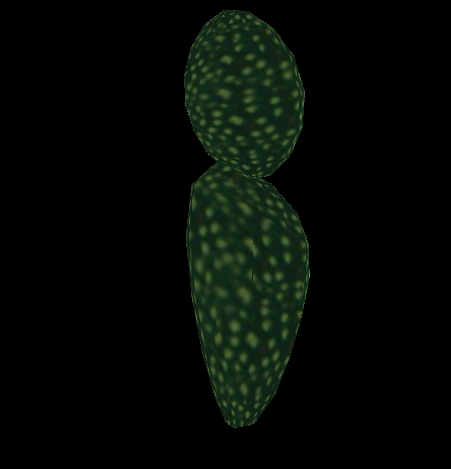
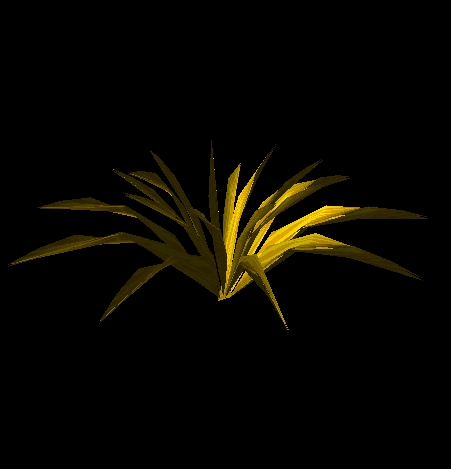
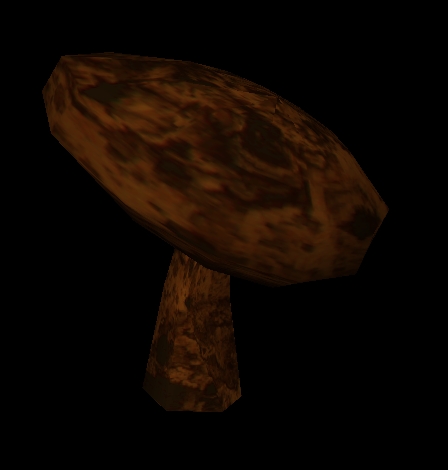
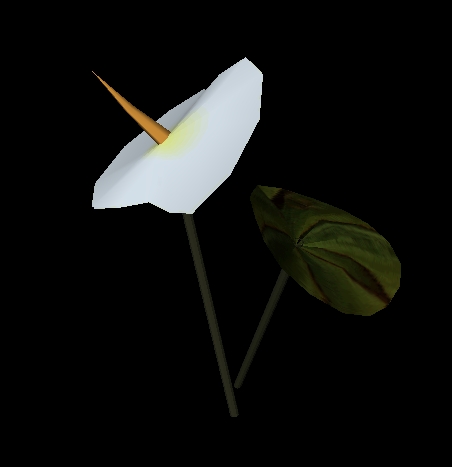
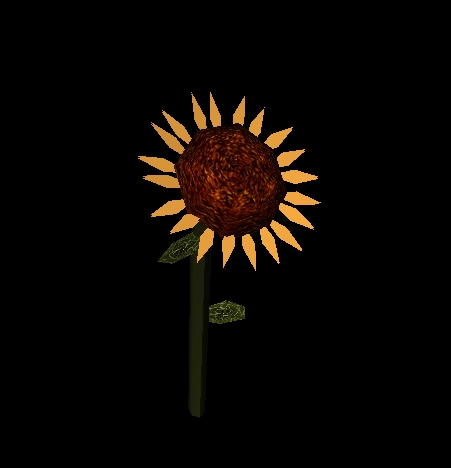
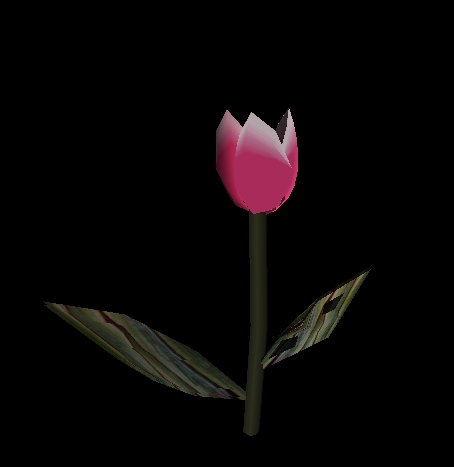
Here are some (large) picrtures of each of the 8 plants. There are only these 8 types of plants, and there can be up to 750 plants in the space.
plants 1 through
4
 plants 5 through
8
plants 5 through
8
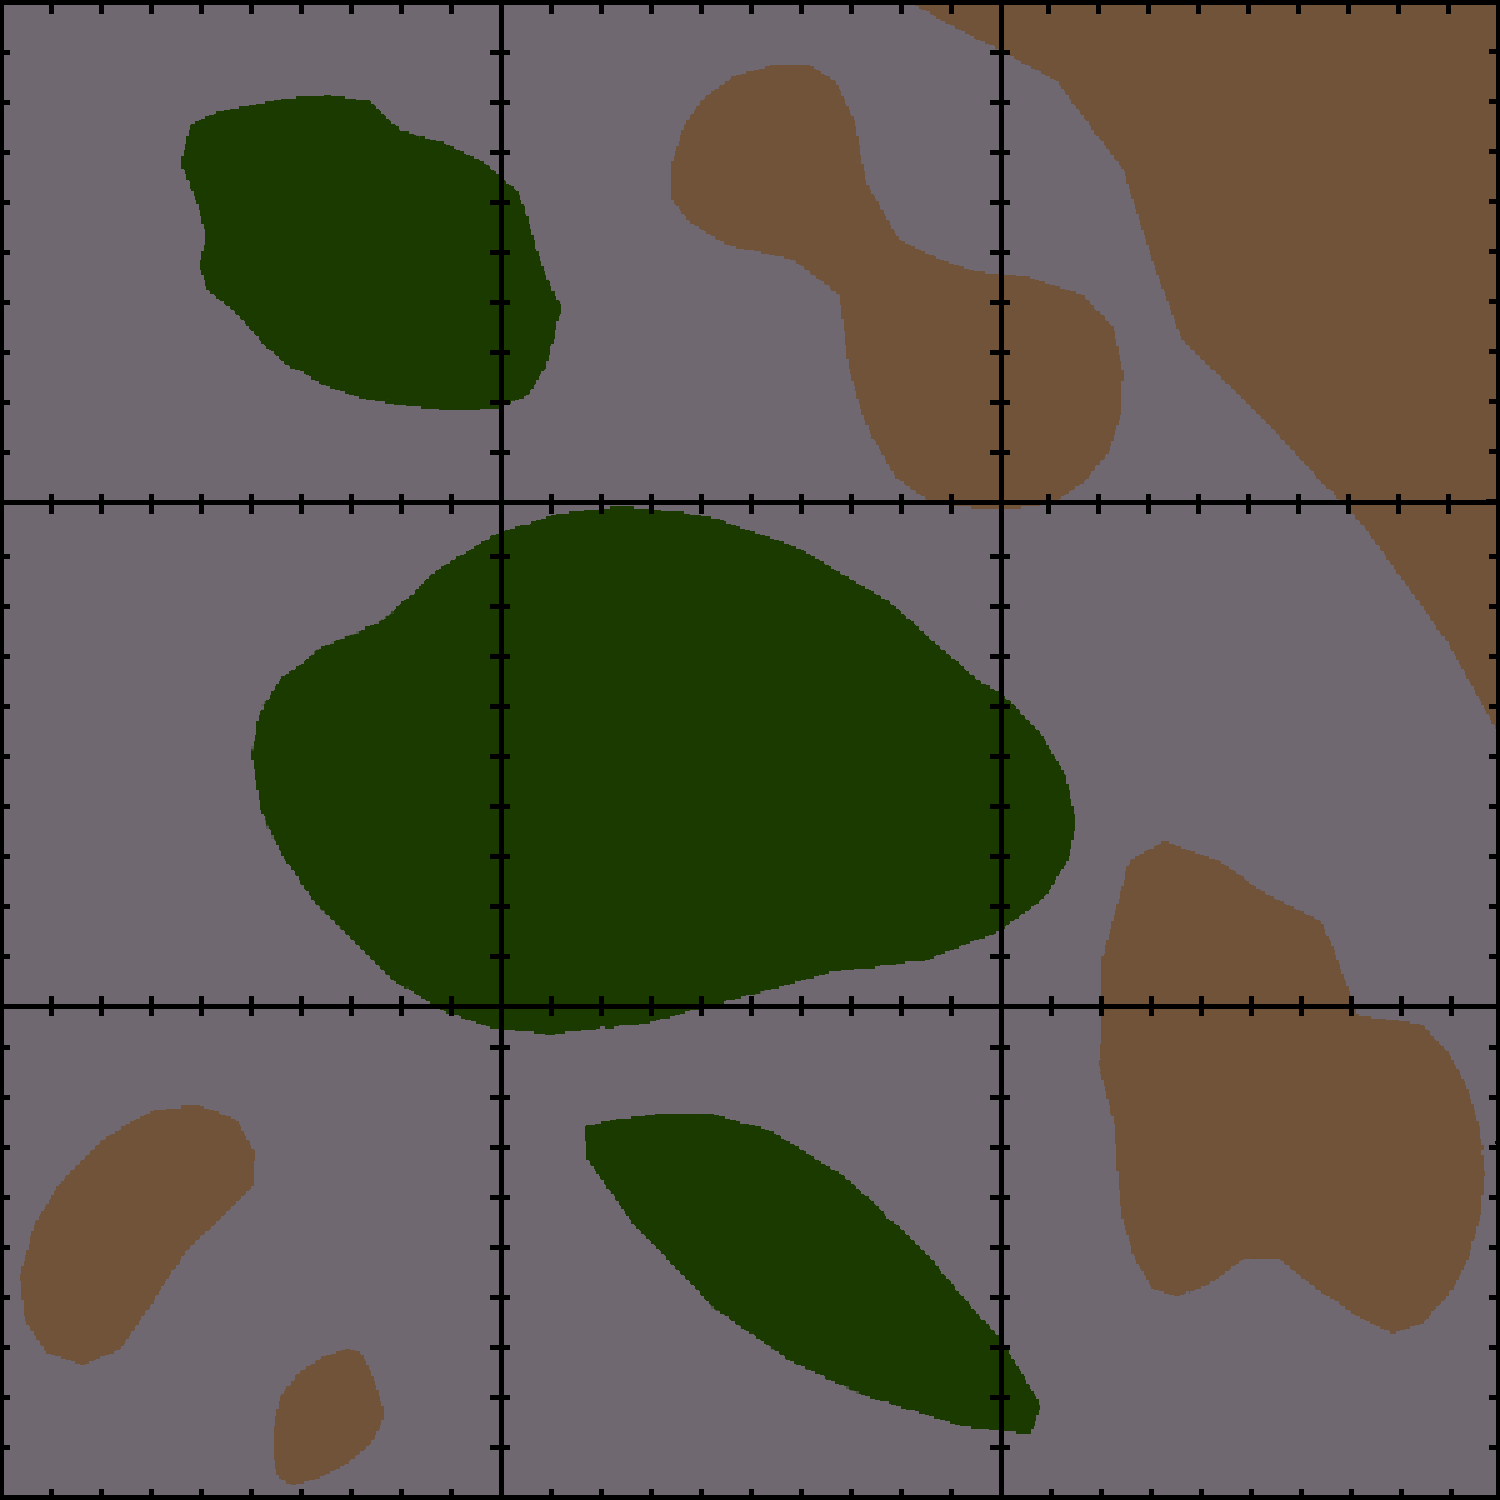
Here is a map of the space. The grey areas are rock, the brown areas are sand, and the green areas are grass. North is to the top of the image and West is to the left.
The user (ie a teacher) should be able to use your interface to place the plants at appropriate points in the space. Therefor the user needs to be able to do the following things conveniently:
The format of the plant data file is dictated by how it will eventually be used - which is to lead models into a piece of virtual reality software so the data file format as shown below. Each plant in the data file is described by 4 lines then a blank line and the next plant is described. Each line contains a keyword in all caps and then one or more values.
NAME
<sector> plant<plant-number>
INVENTOR_FILE plant<plant-type>.pfb
TRANSLATE <x-location> <y-location>
ROTATE_Y <rotation>
<sector> is which of the 9 sectors this plant is in. The sectors are NW, N, NE, W, C, E, SW, S, SE
<plant-number> is an integrer which starts at 0 and increases by one for each plant, giving each plant a unique identifier
<plant-type> determines which plant this is - it is an integer between 1 and 8 inclusive
the locations give the integral position of this plant in the space - the actual space is a square with 0,0 in the center and each of the 9 sectors being 1000 feet wide and 1000 feet long. The western edge has X=-1500 and the eastern edge has X=1500. The northern edge has Y=1500, and the southern edge has Y=-1500.
<rotation> is a random integral rotation (from 0 to 360) so that the plants are not all facing the same direction.
Here is a small sample data file containing two plants:
NAME NW plant0
INVENTOR_FILE plant_6.pfb
TRANSLATE -1427 1417
ROTATE_Y -126
NAME E plant1
INVENTOR_FILE plant_4.pfb
TRANSLATE 590 -130
ROTATE_Y 38
Your program should be able to comfortably run on a 800x 600 screen or a 1024 x 768 or a 1280 x 1024. That is, it should not be limited to a specific screen size. Note that scale is a major issue in this assignment. Each of the plants takes up about 2 square feet of space in the virtual environment, and the user should be able to easily place the plants within a few feet of each other.
The java swing libraries make this program relatively straightforward to write. Take advantage of all the features they provide. The key idea is that when you are done you should have an interface that is simple enough for an elementary school teacher to use.
The images on this page can also be considered a good starting point for visuals in the program. Feel free to download them and use them. You will probably want/need to rescale them. You can also use these images as inspiration if you wish to create graphics of your own - you do not need to use any of the graphics from this page.
For more information on this research you can see http://www.evl.uic.edu/correlations/