we2b
video
Topic due Friday 4/2/2021 at
8:59pm Chicago time
Web page and video due Friday 4/9/2021 at 8:59 pm Chicago time
| 2012 London Olympics - Medals Treemap 2014 DC Crime Map 35 Years of American Death 4 Letter Words 50 Years of Change 500 Cities Project: Local Data for Better Health 7 billion A Day in the Life of
Americans Based on a True
Story Cancer Today deaths of children
under 5 years due to diseases Economy Map Facebook Privacy
over Time Galaxy of Covers Hawai'i Campaign
Spending Data Immigrants and
Migration in Poland Japanese-American
Internment in WWII Kindred Britain language
distribution map |
Macrometeorites Mapping Marijuana Sales Mapping Migration in the United States Mapping Motor Vehicle Collisions in New York City Mapping the Nation's Well-Being MDG Viz Measure of a Nation Media Use in the Middle East Meeting the Demand for Skilled Workers Miseducation Money Chart Most Common Occupation by Age Most Common Use of Time Most Valuable Players Music Timeline Nanocubes Oakland
Crimespotting Pain at the Pump rail rider Scale of the
Universe Tag Galaxy UFC Fighters &
Refs Analytics Vinyl W3schools.com's
Historical Browser Statistics YouTube Trends Map |
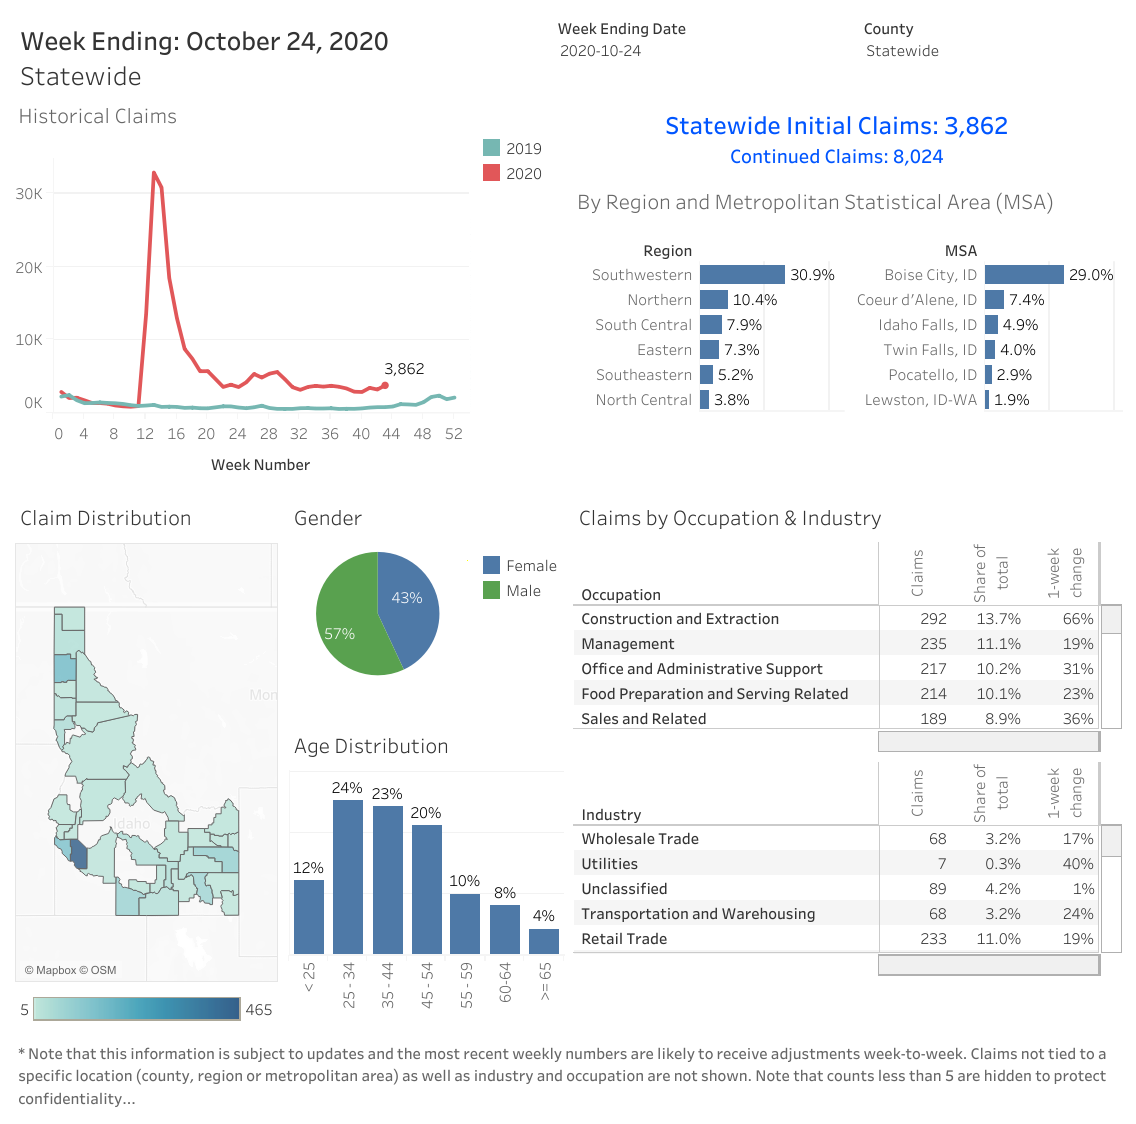
| Agrawal, Piyush |
Idaho
Department of Labor |
link |
web | |
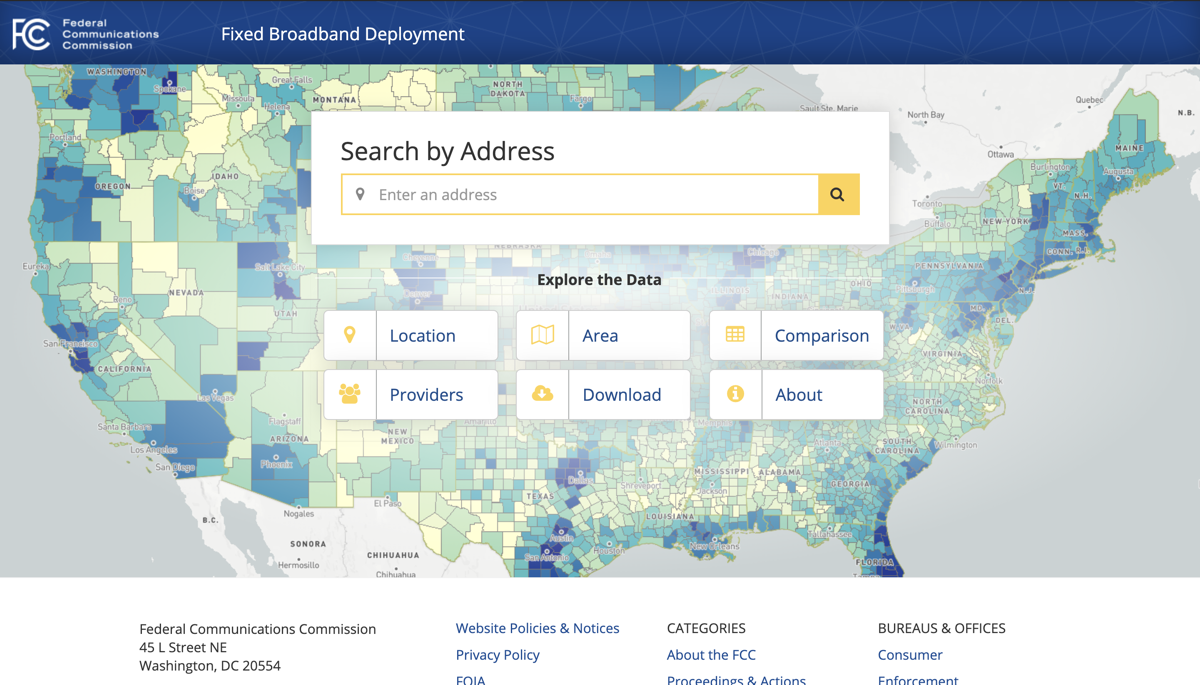
| Baez, Brian |
FCC
Fixed Broadband Deployment |
link | web | |
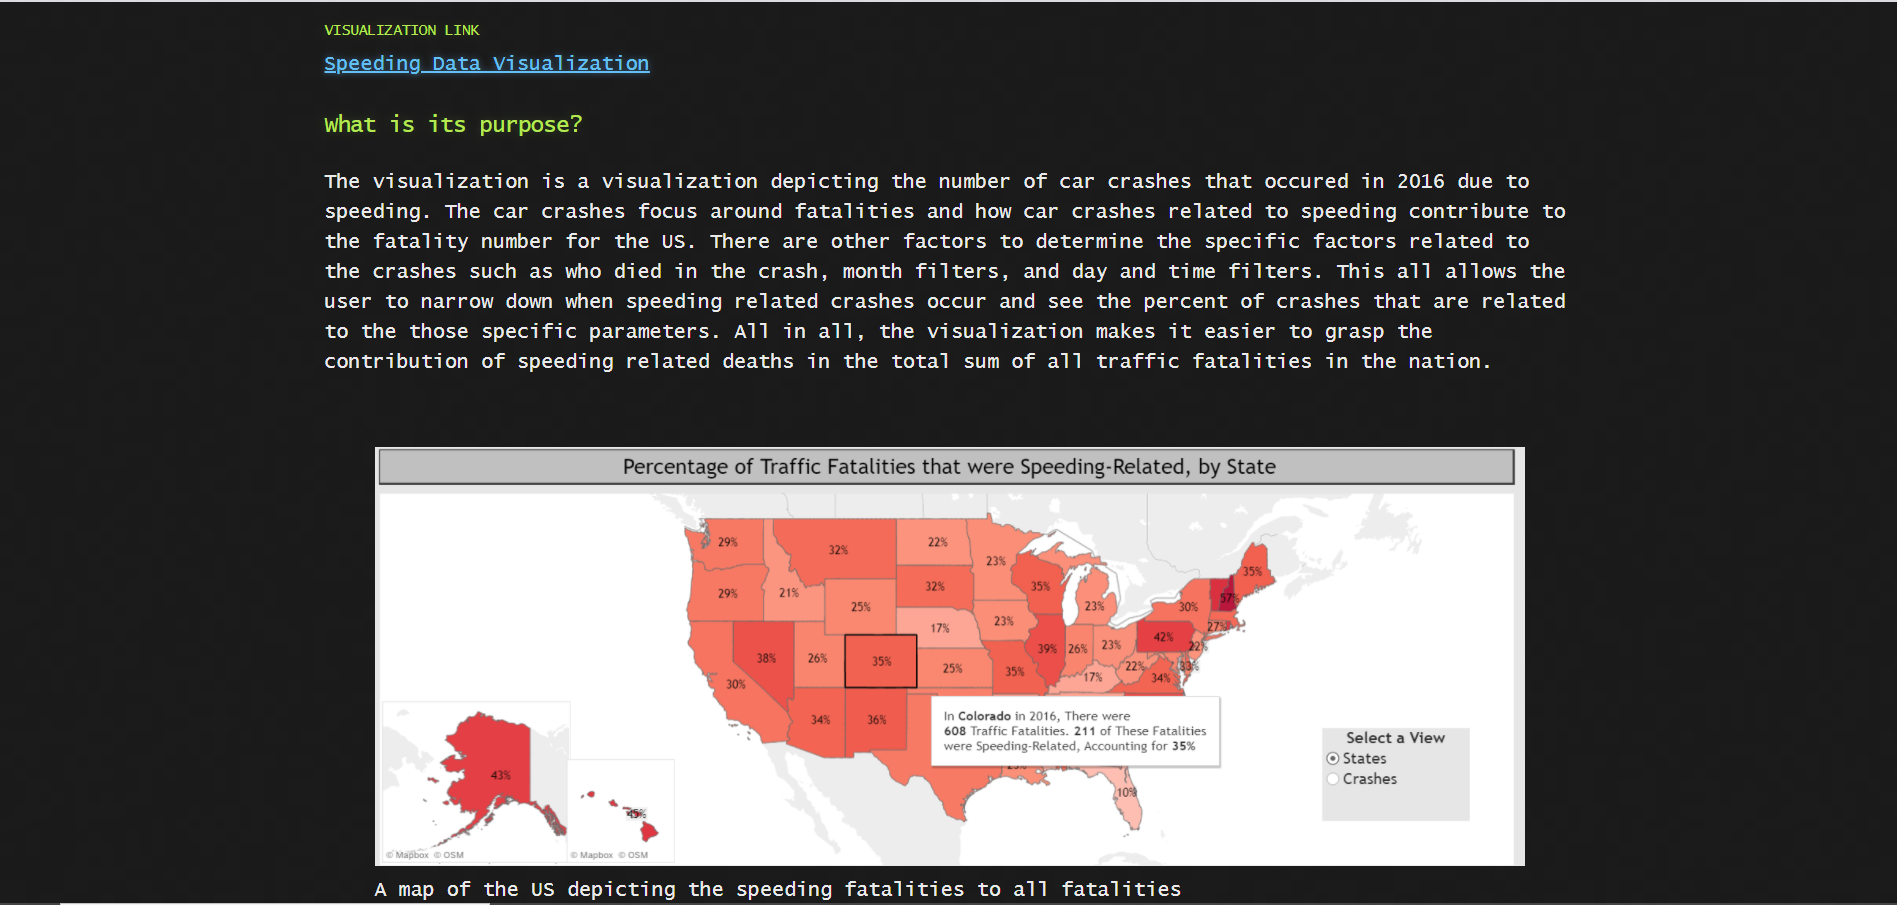
| Bhatt, Vivek |
NHTSA
Traffic Fatalities in Crashes Involving Speed |
link | web | |
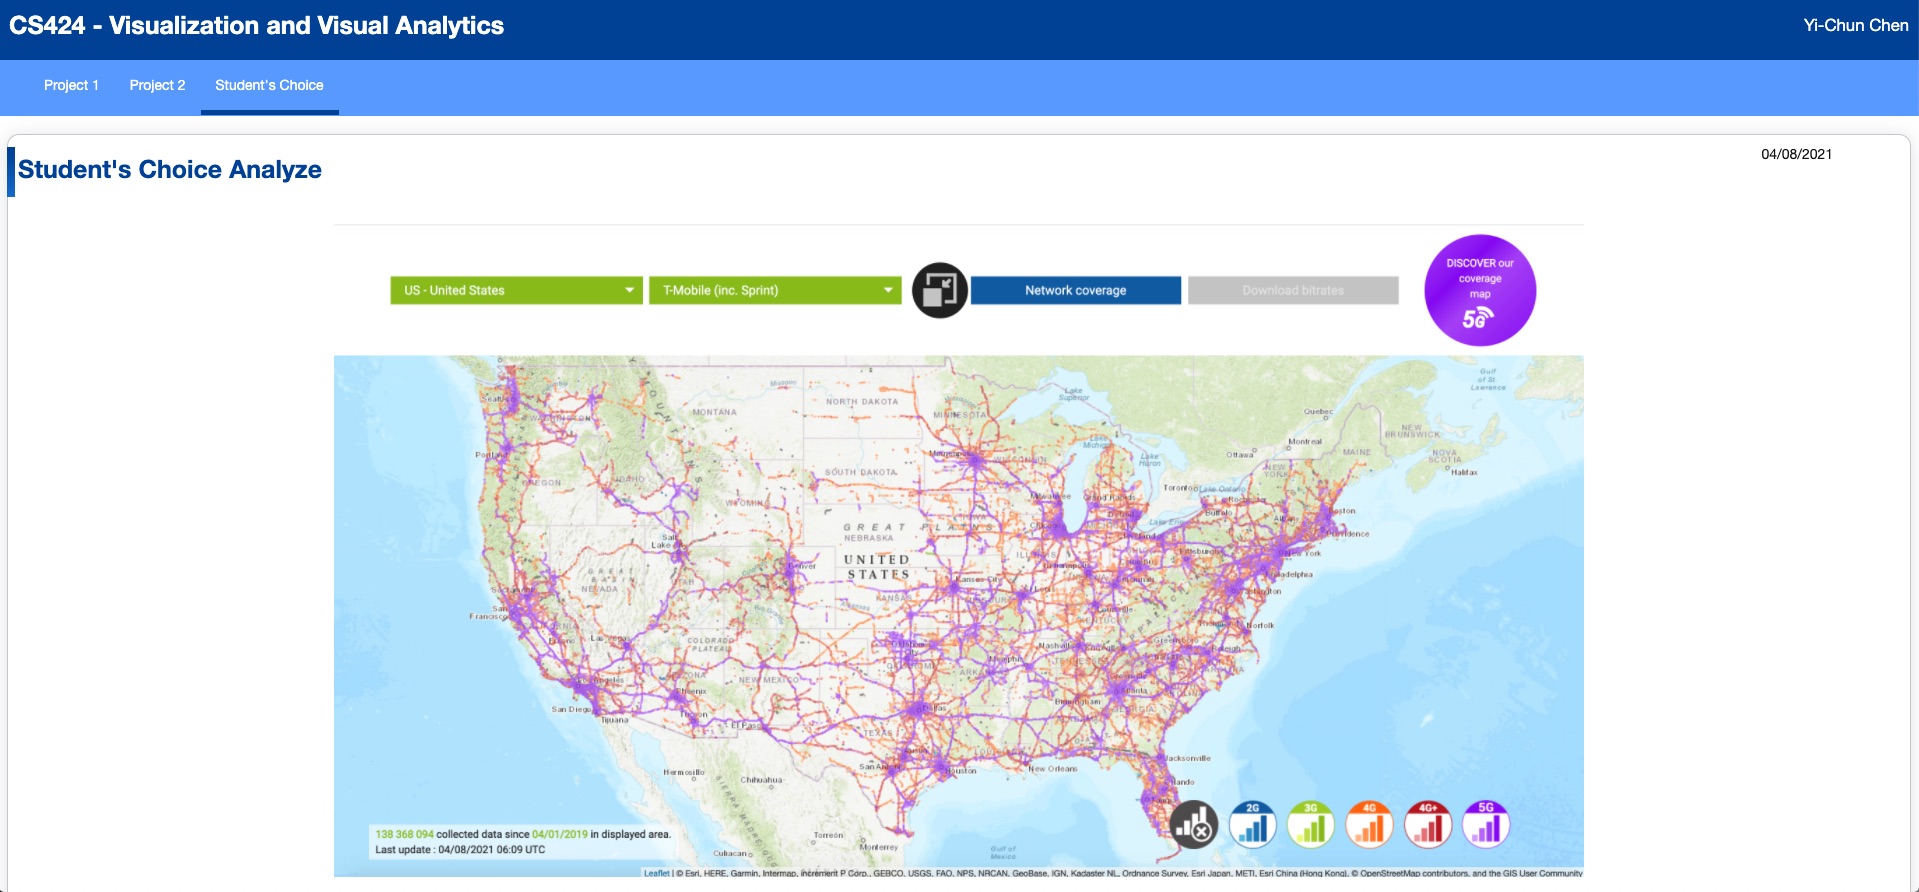
| Chen, Yi-Chun |
nperf
3G/4G/5G coverage map |
link | web | |
| Davidson, Will |
NBA
Advanced Stats |
link | ||
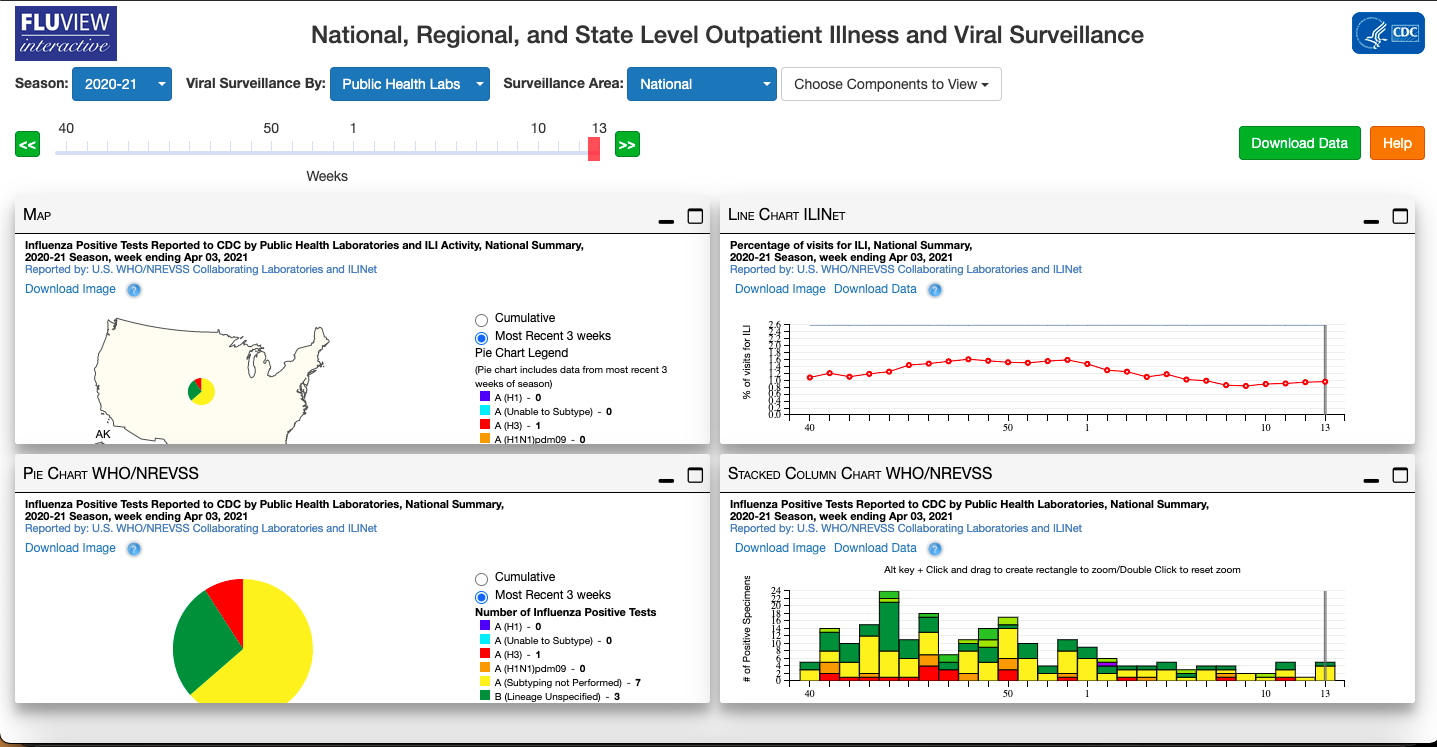
| Ghuneim, Matthew |
FLUVIEW
Interactive |
link | web | |
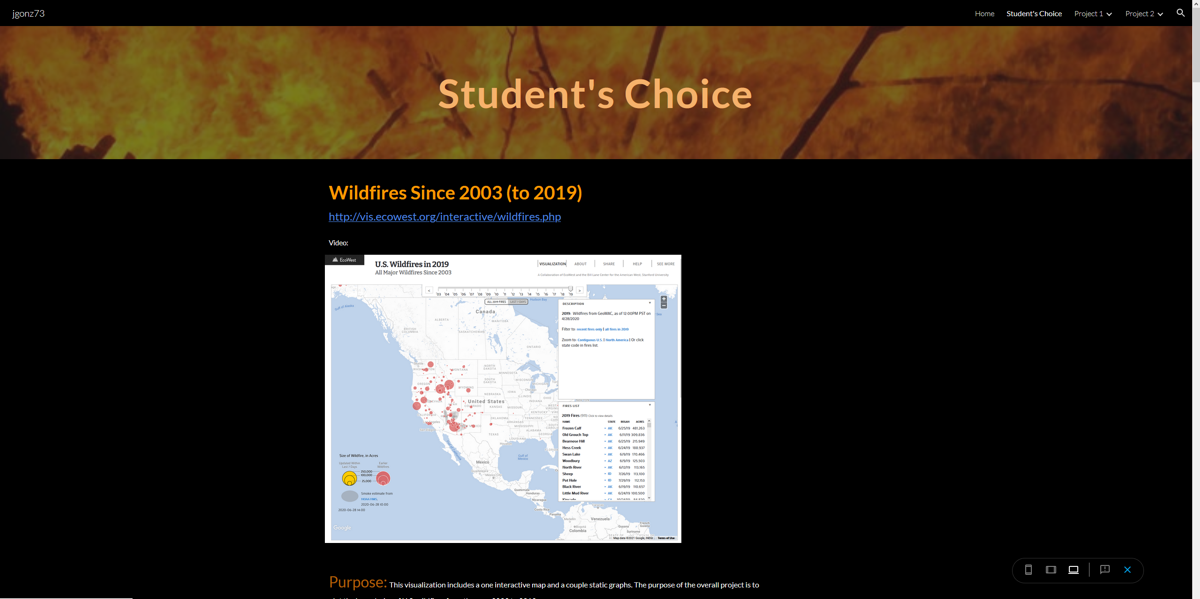
| Gonzales, Joshua Luis |
US
Wildfires in 2019 |
link | web | |
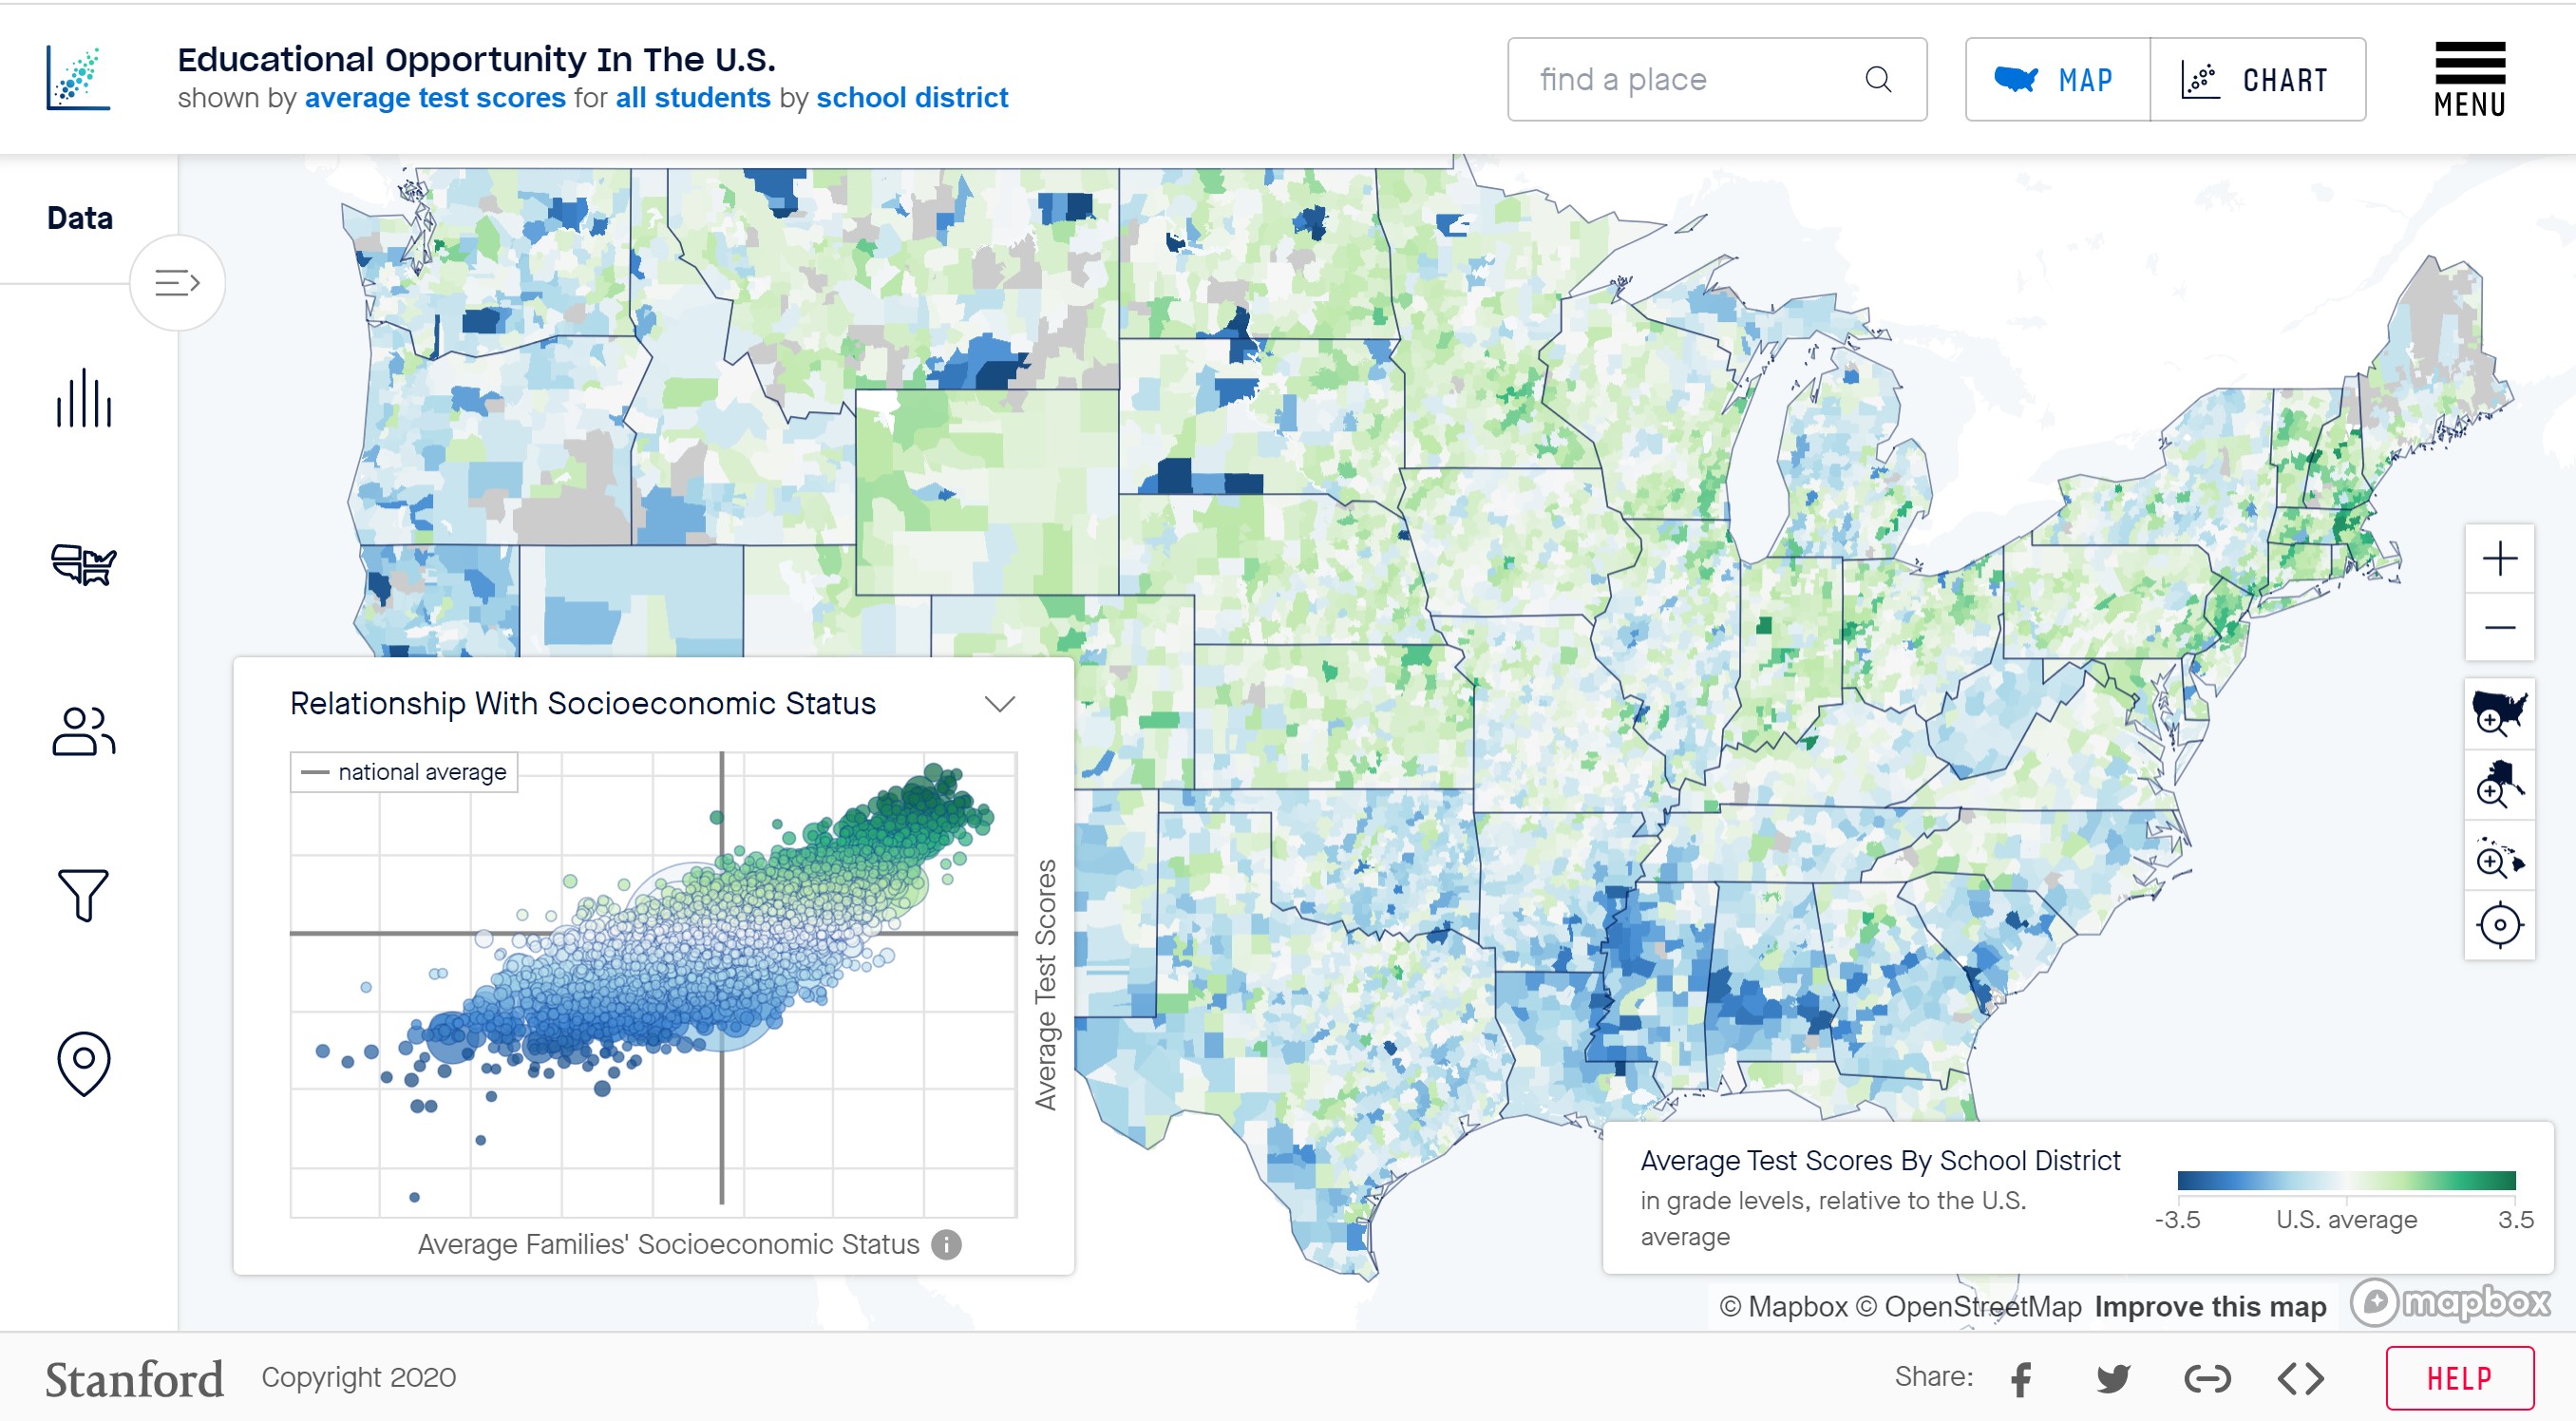
| Ibtasar, Rabia |
Educational
Opportunity in the US |
link | web | |
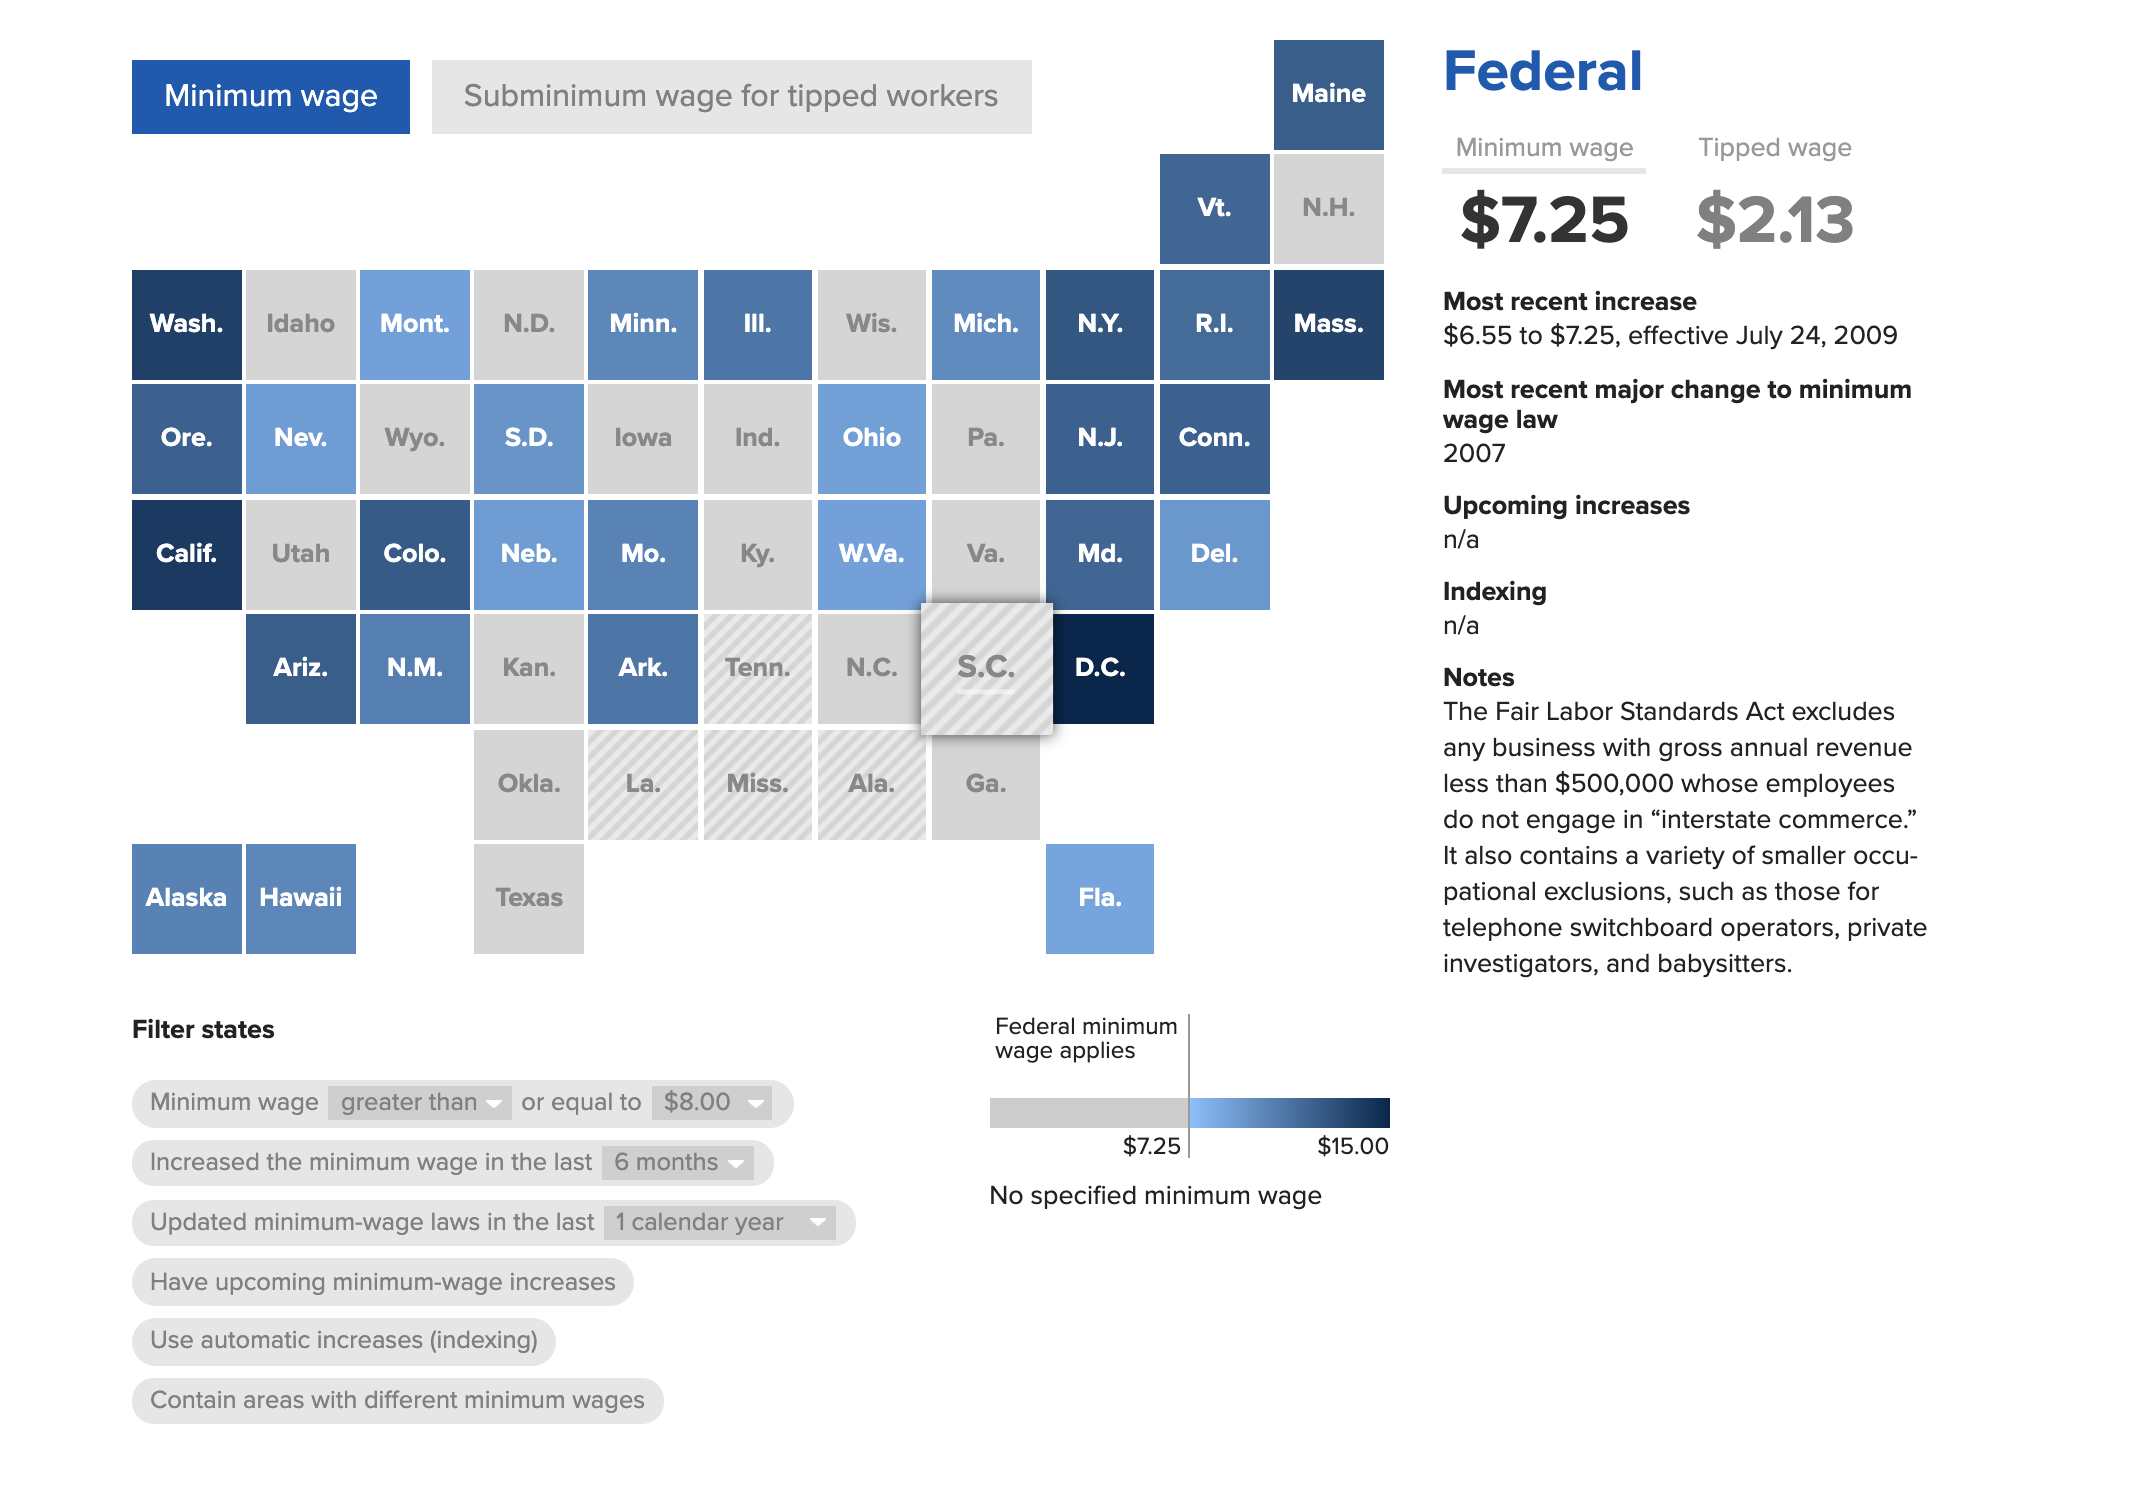
| Johnson, Amal |
Minimum
Wage Tracker |
link | web | |
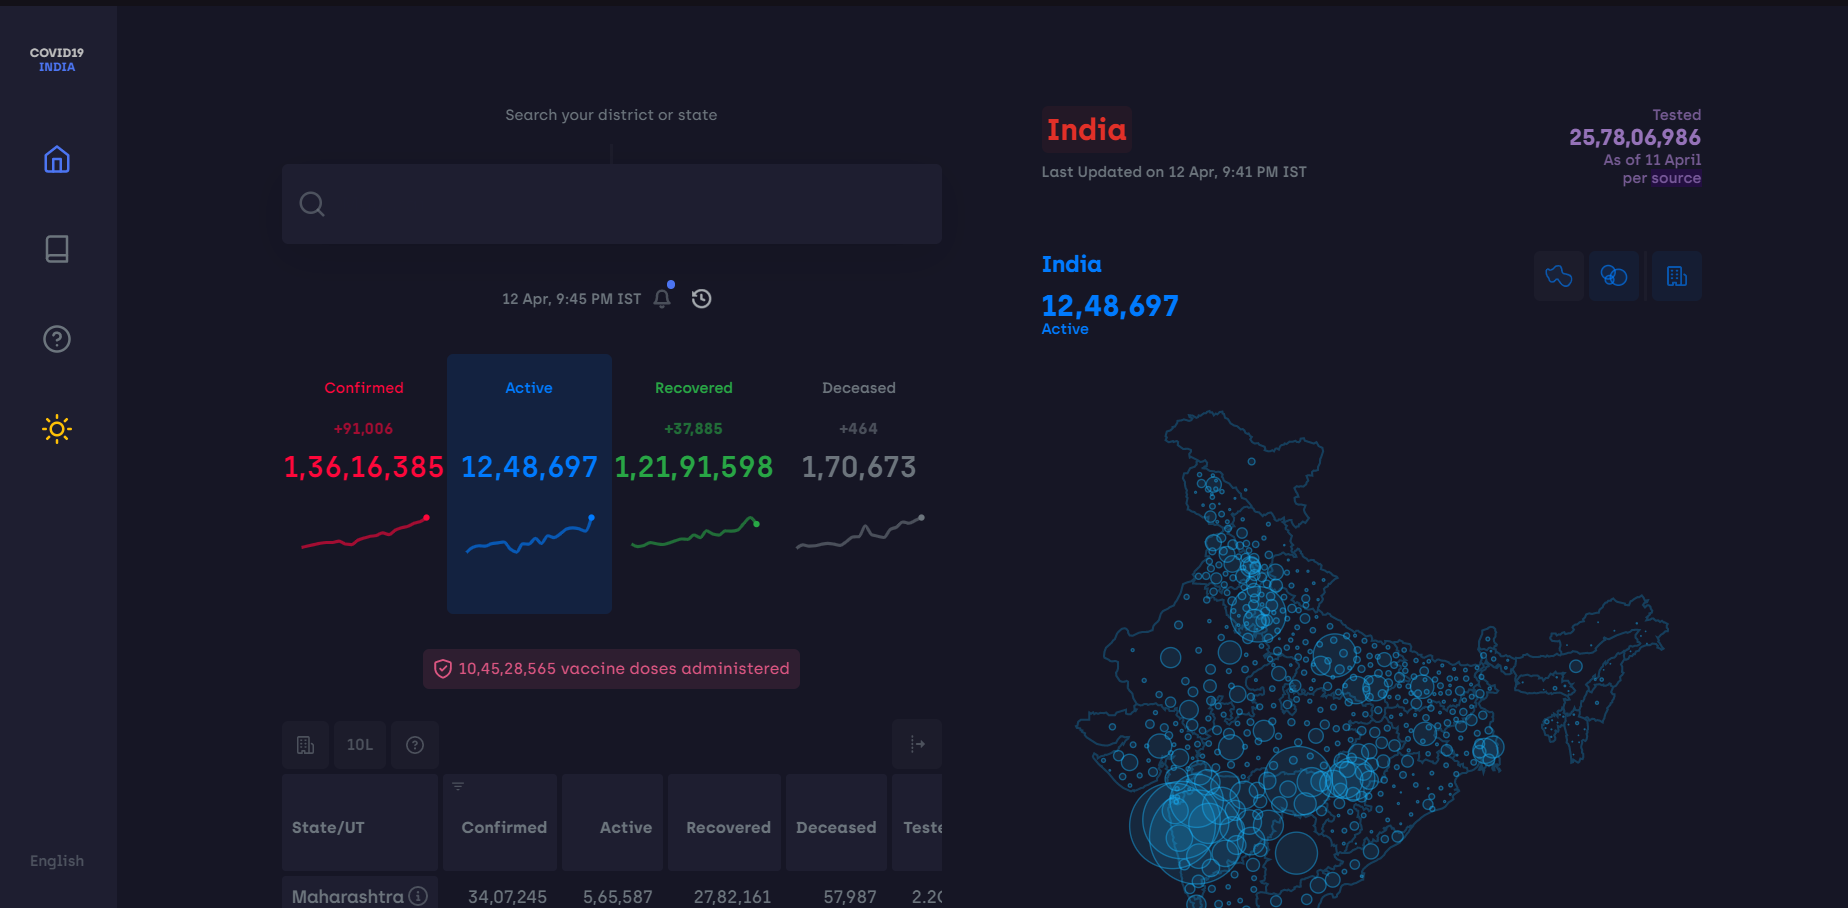
| Kohli, Paras |
Covid19India |
link | web | |
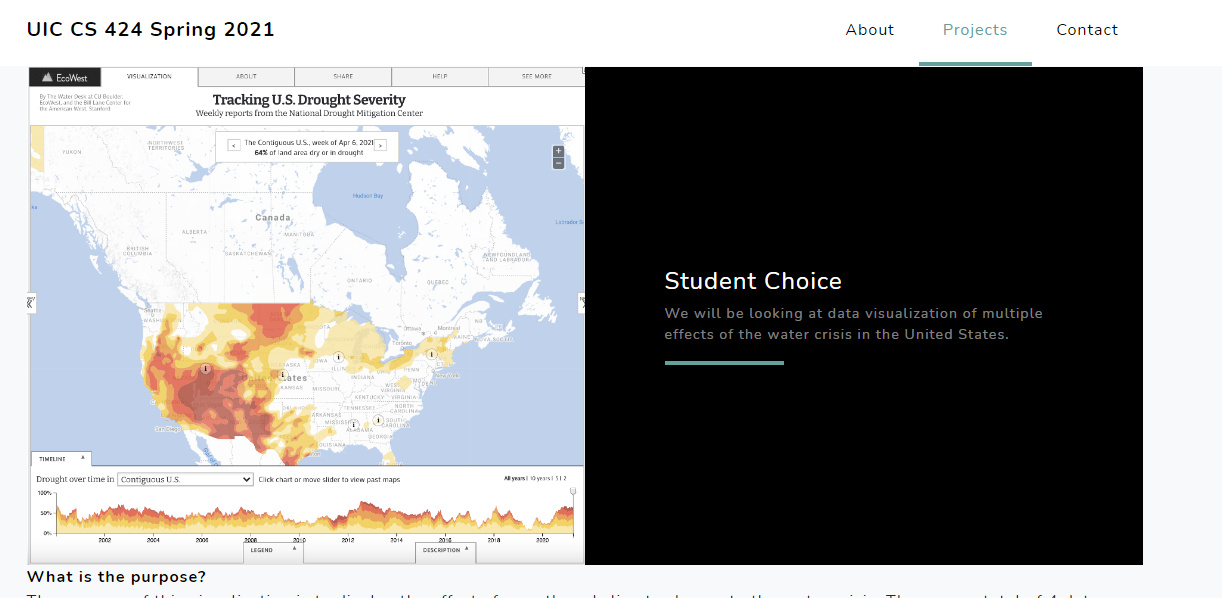
| Khandwala, Herrit |
Tracking US Drought
Severity |
link | web | |
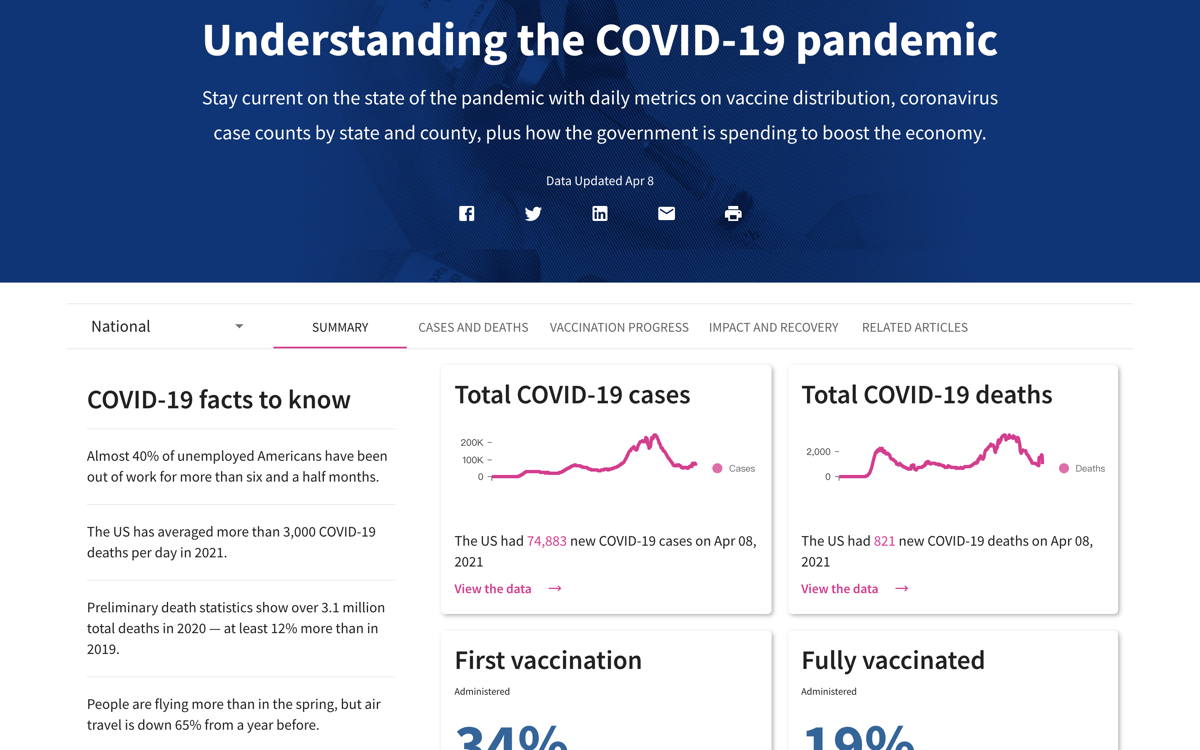
| Lee, Ting-Shao |
USAFACTS |
link | web | |
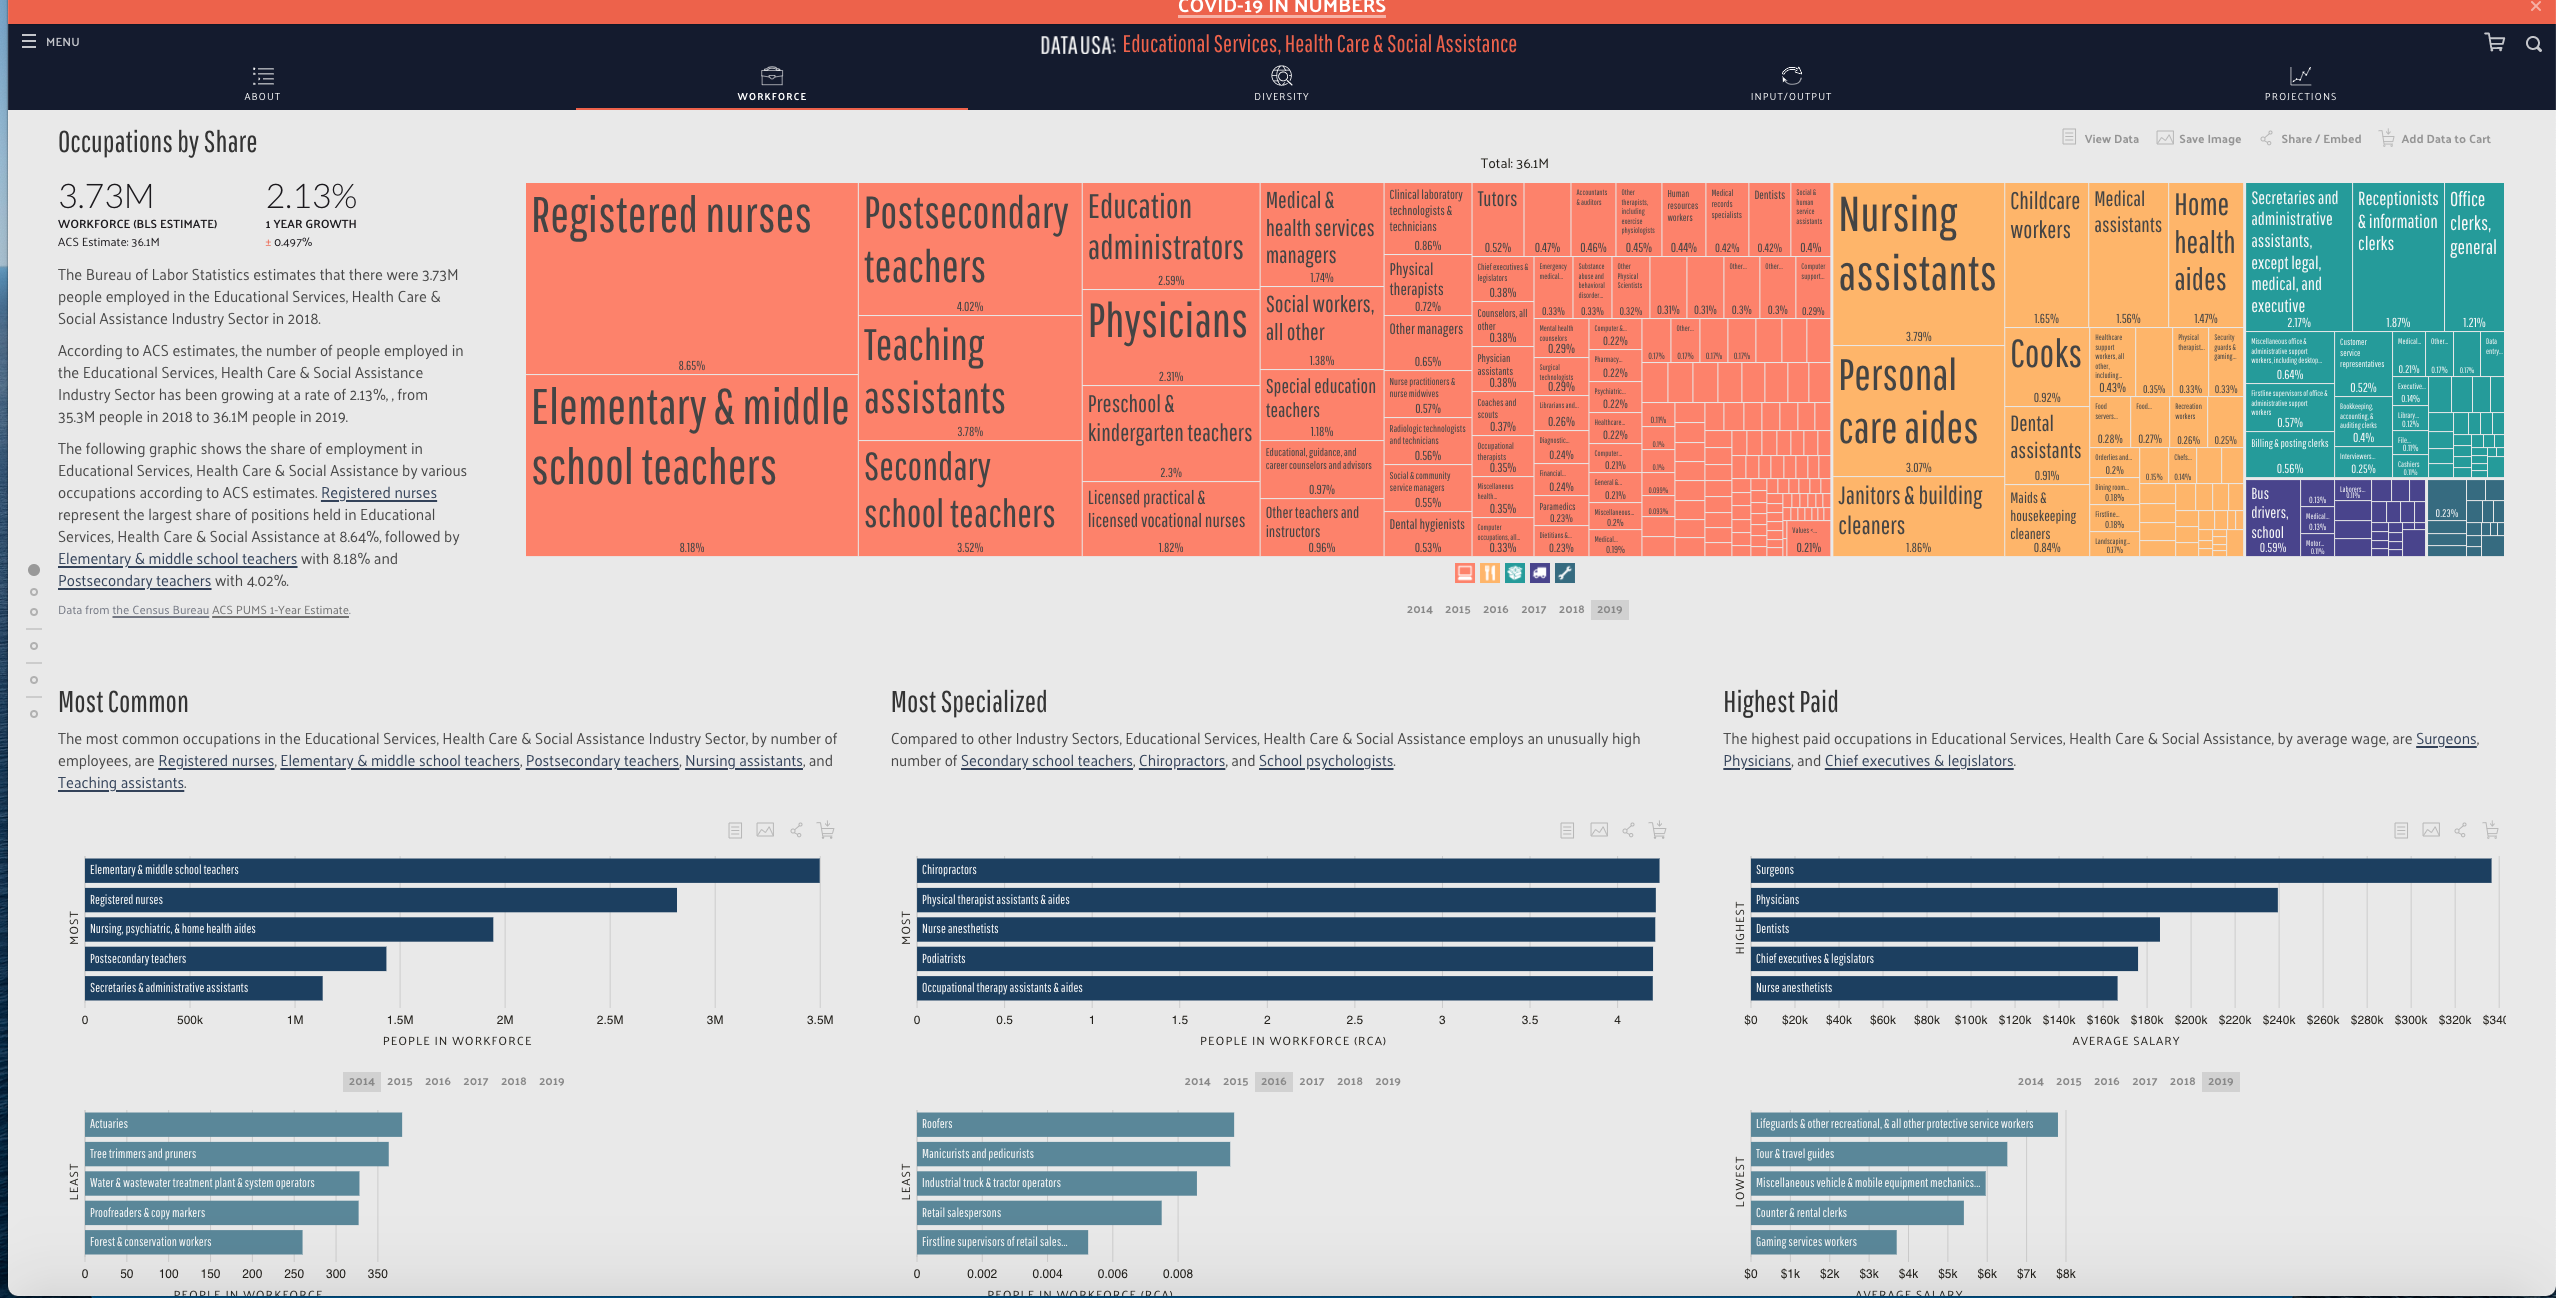
| Mach, Khang |
Educational
Services, Health Care & Social Assistance |
link
|
web we2b |
|
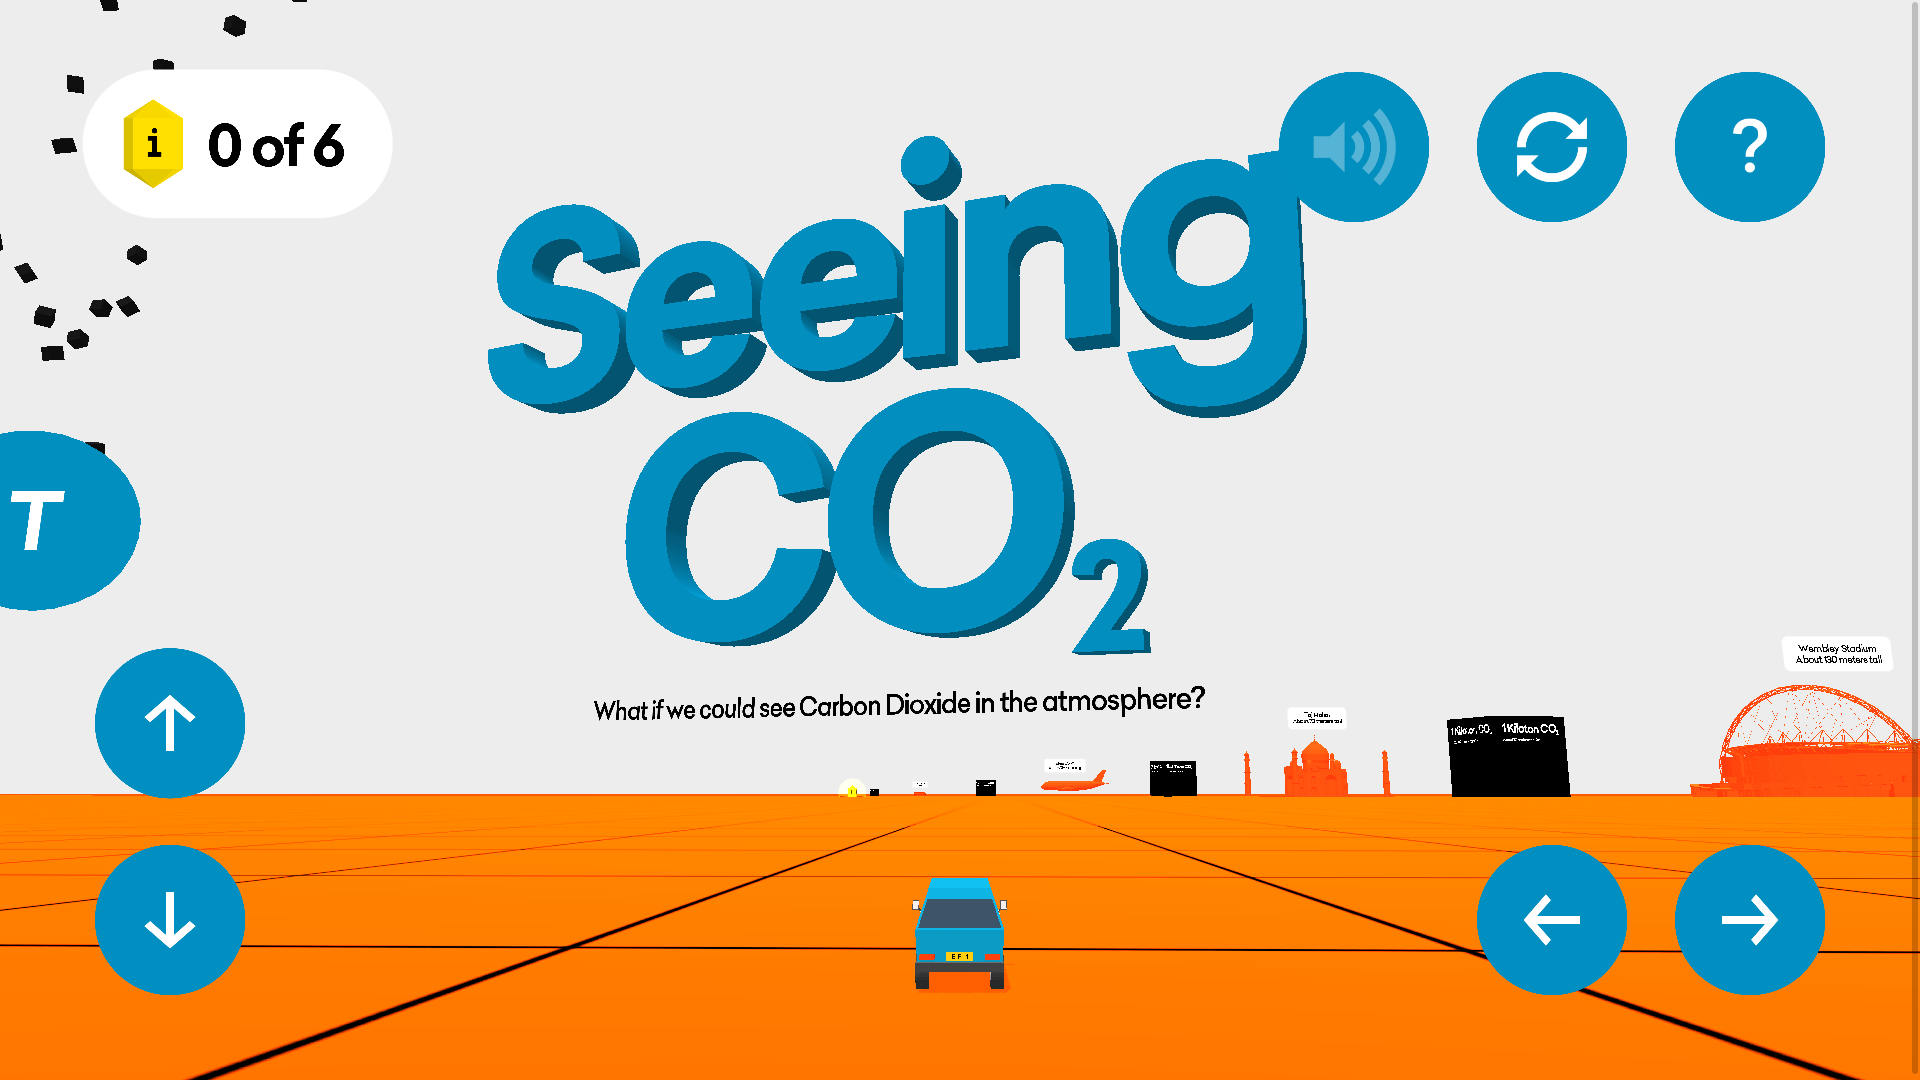
| Mara, Valo |
Seeing CO2 |
link | web | |
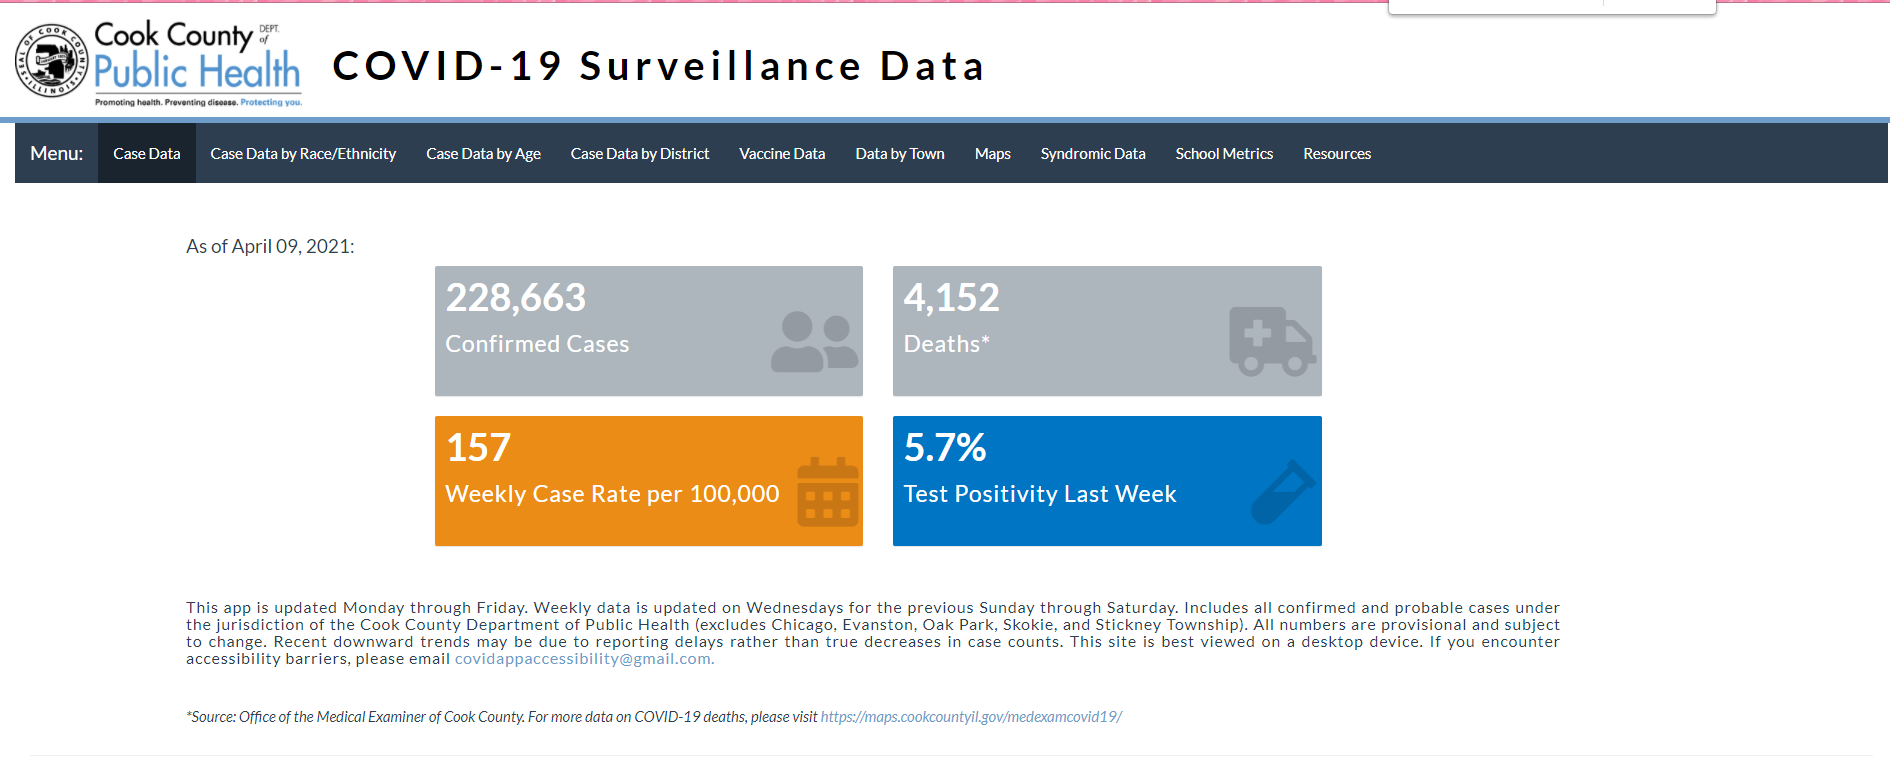
| Mendoza-Avila, Hilda |
Cook
County Public Health COVID-19 Surveillance Data |
link | web | |
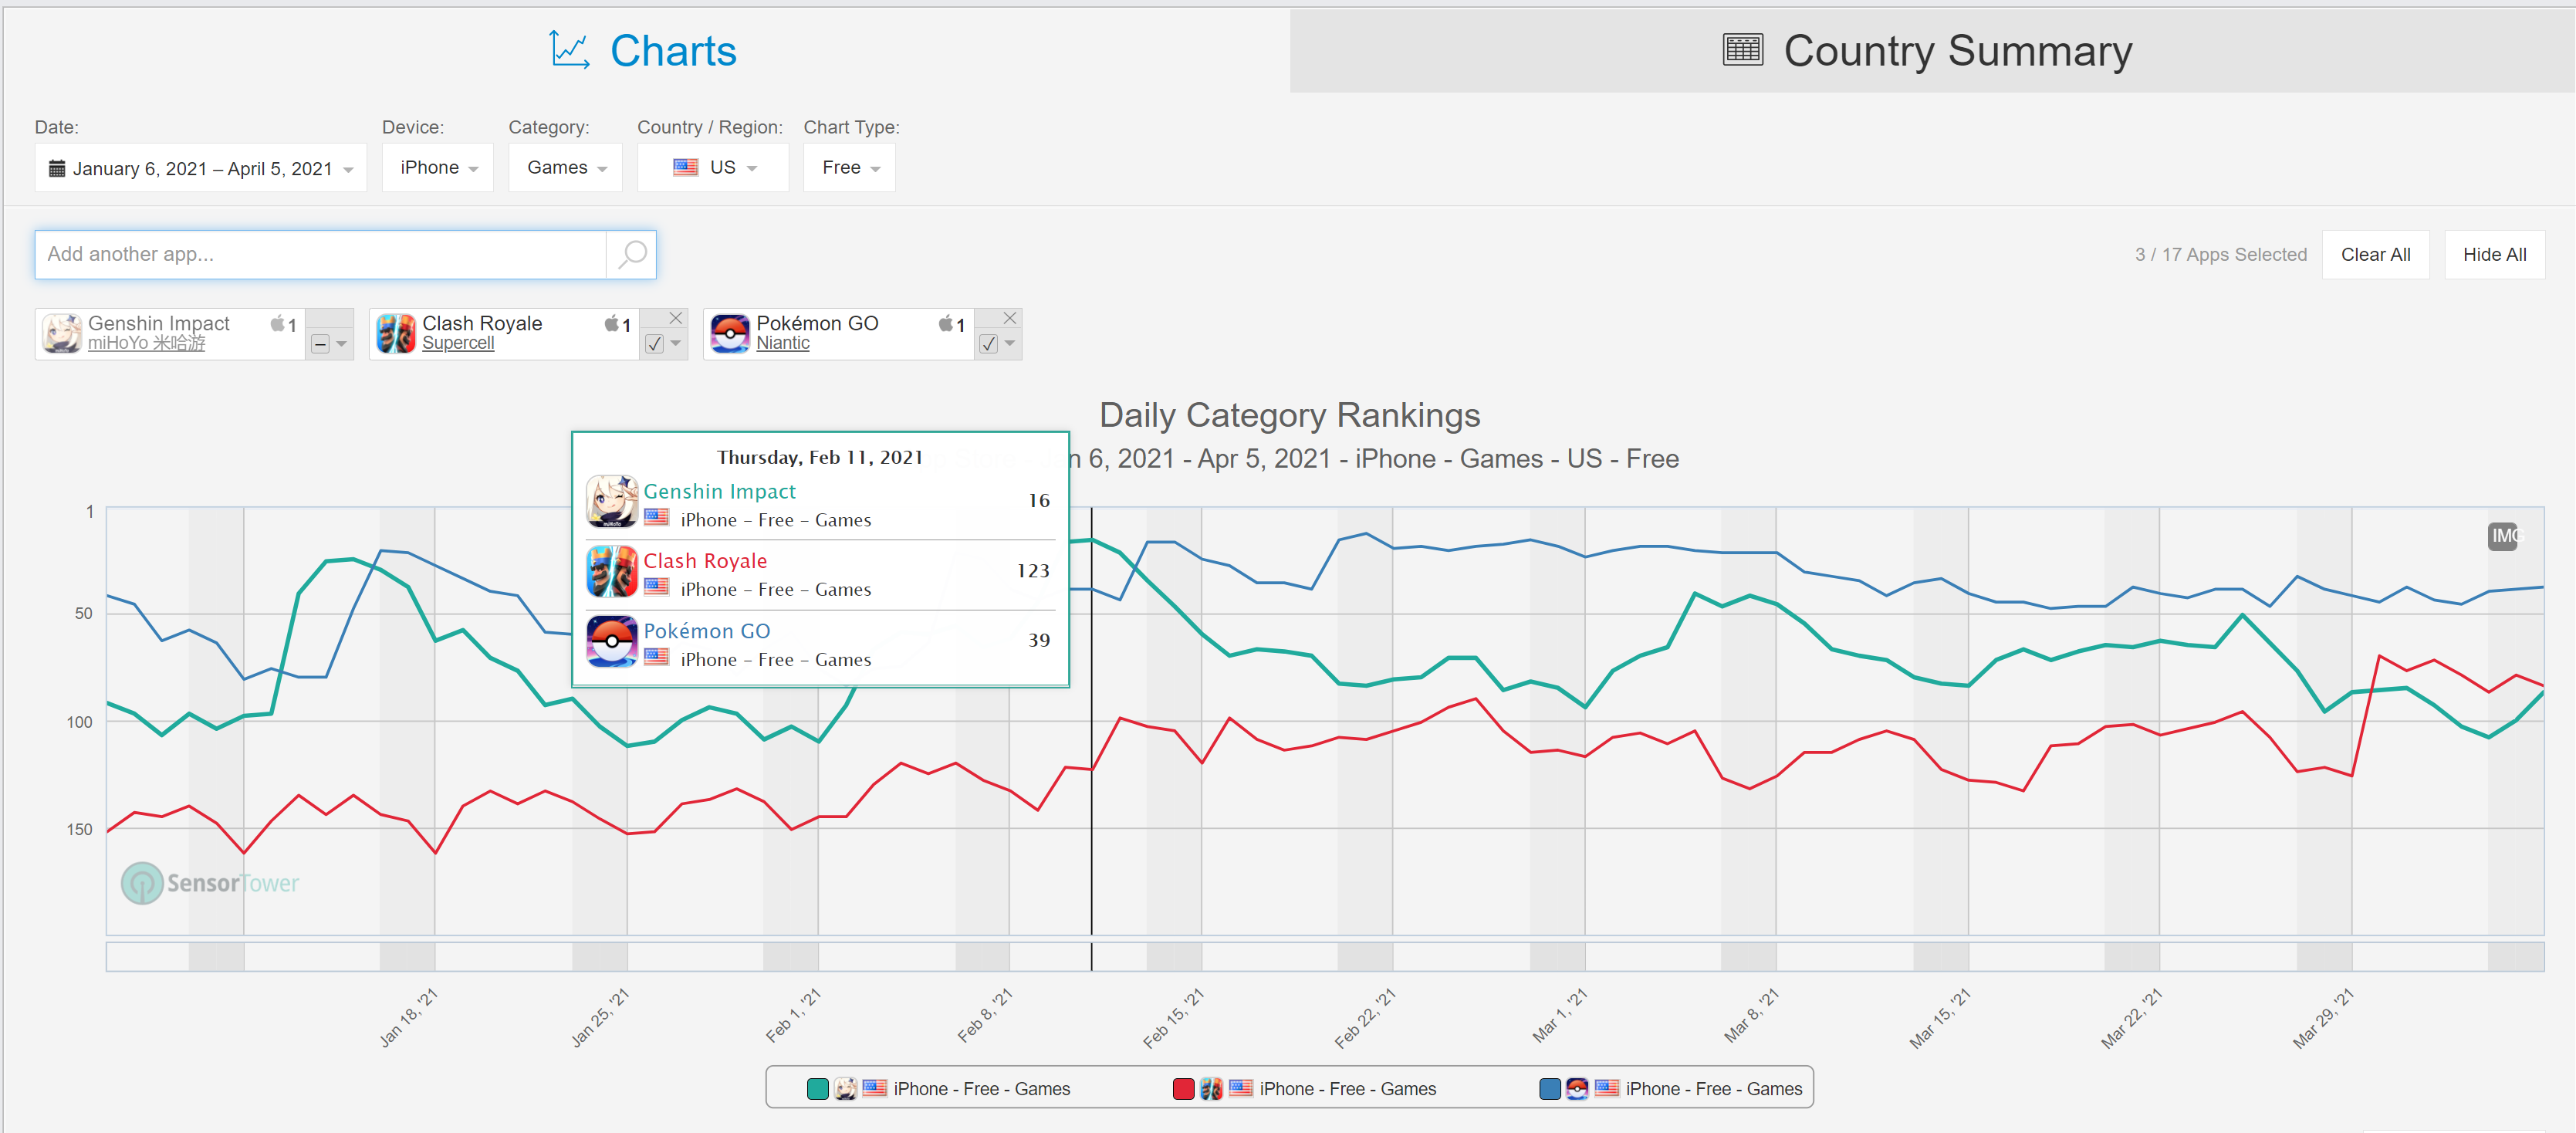
| Mo, Jiajun |
Sensor
Tower |
link | web | |
| Modi, Hiral Mahesh |
unicef
Immunization coverage estimates |
link | web | |
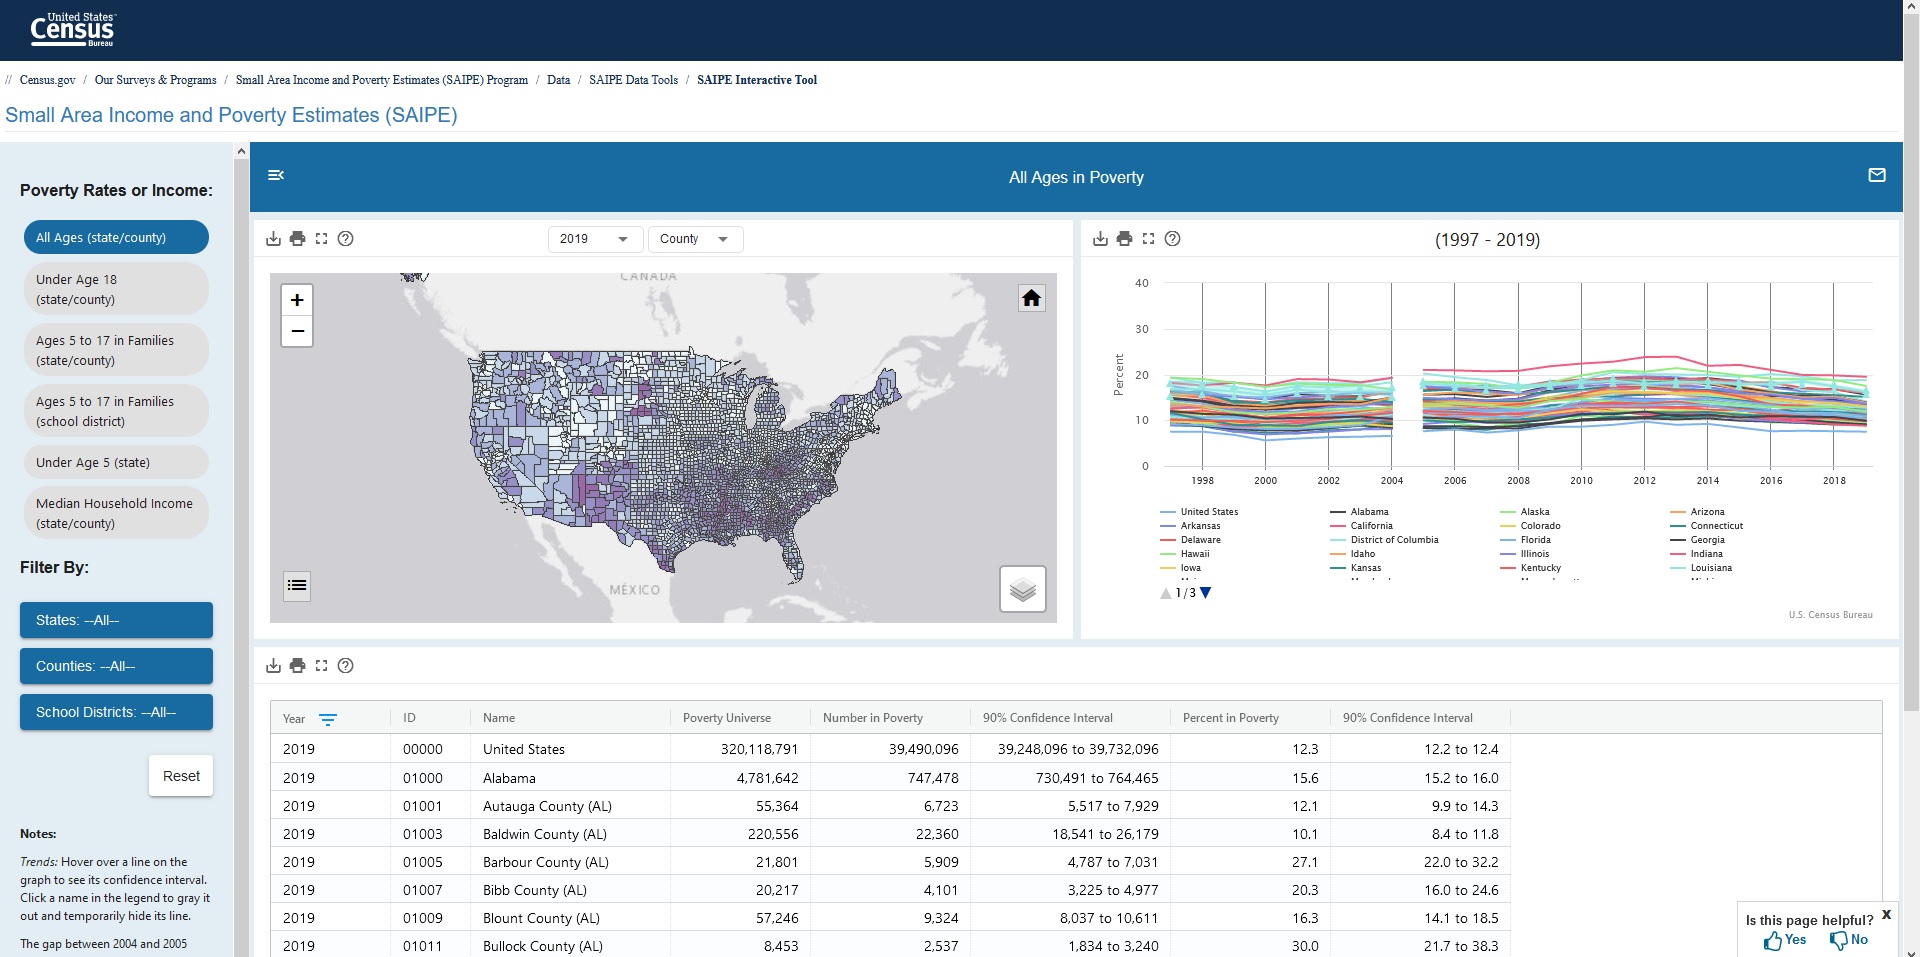
| Perez-Serna, Jesus |
US
Census Small Area Income and Poverty Estimates |
link | web | |
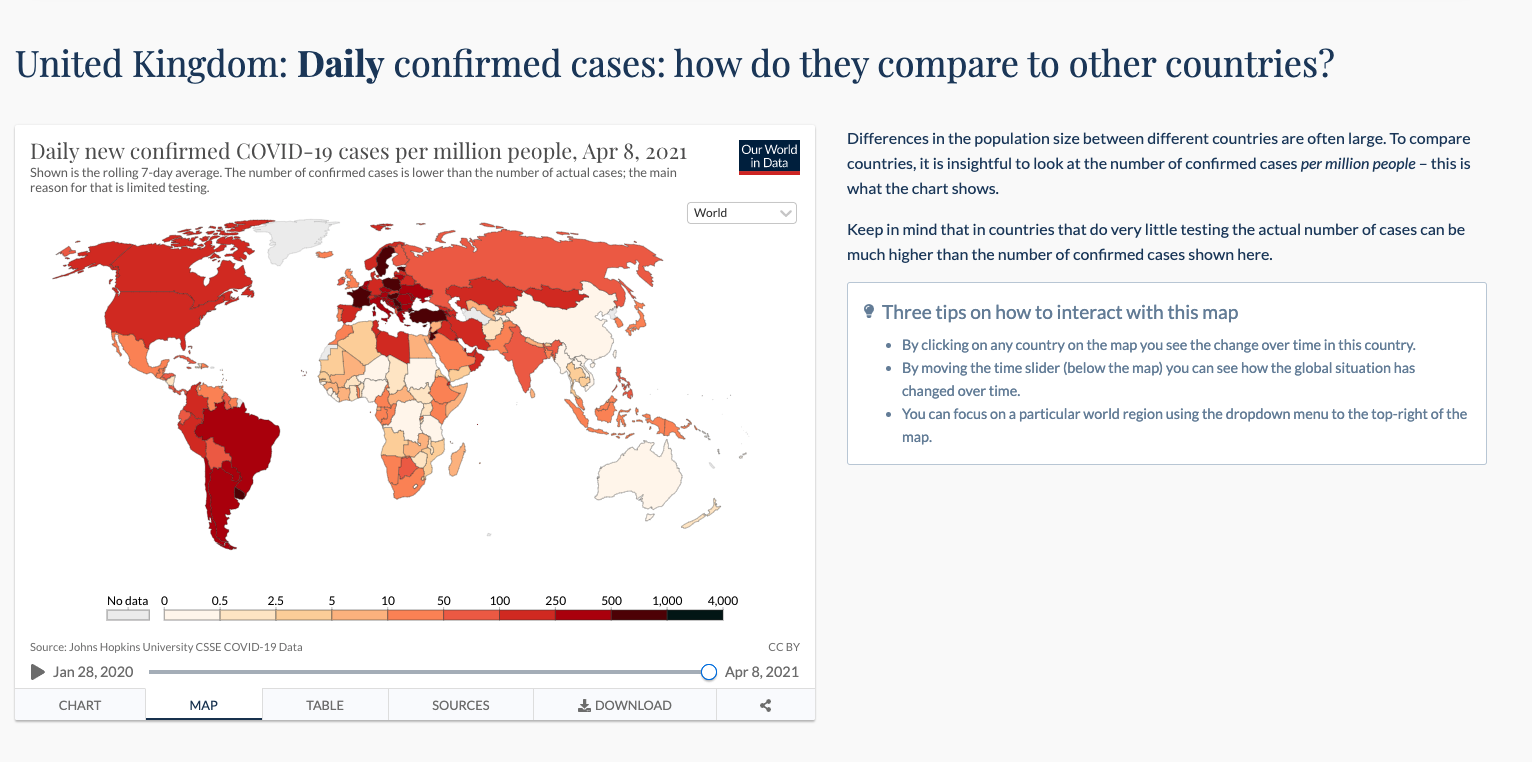
| Raza, Syed |
United
Kingdom: Coronavirus Pandemic Country Profile |
link | web | |
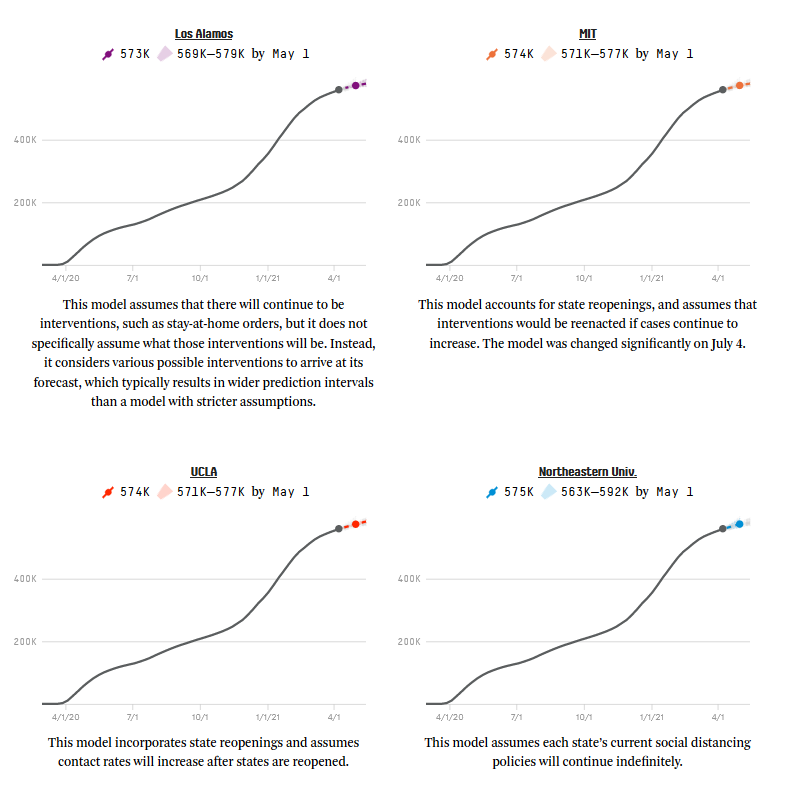
| Repta, Jonathon |
Where
The Latest COVID-19 Models Think We're Headed � And Why
They Disagree |
link | web | |
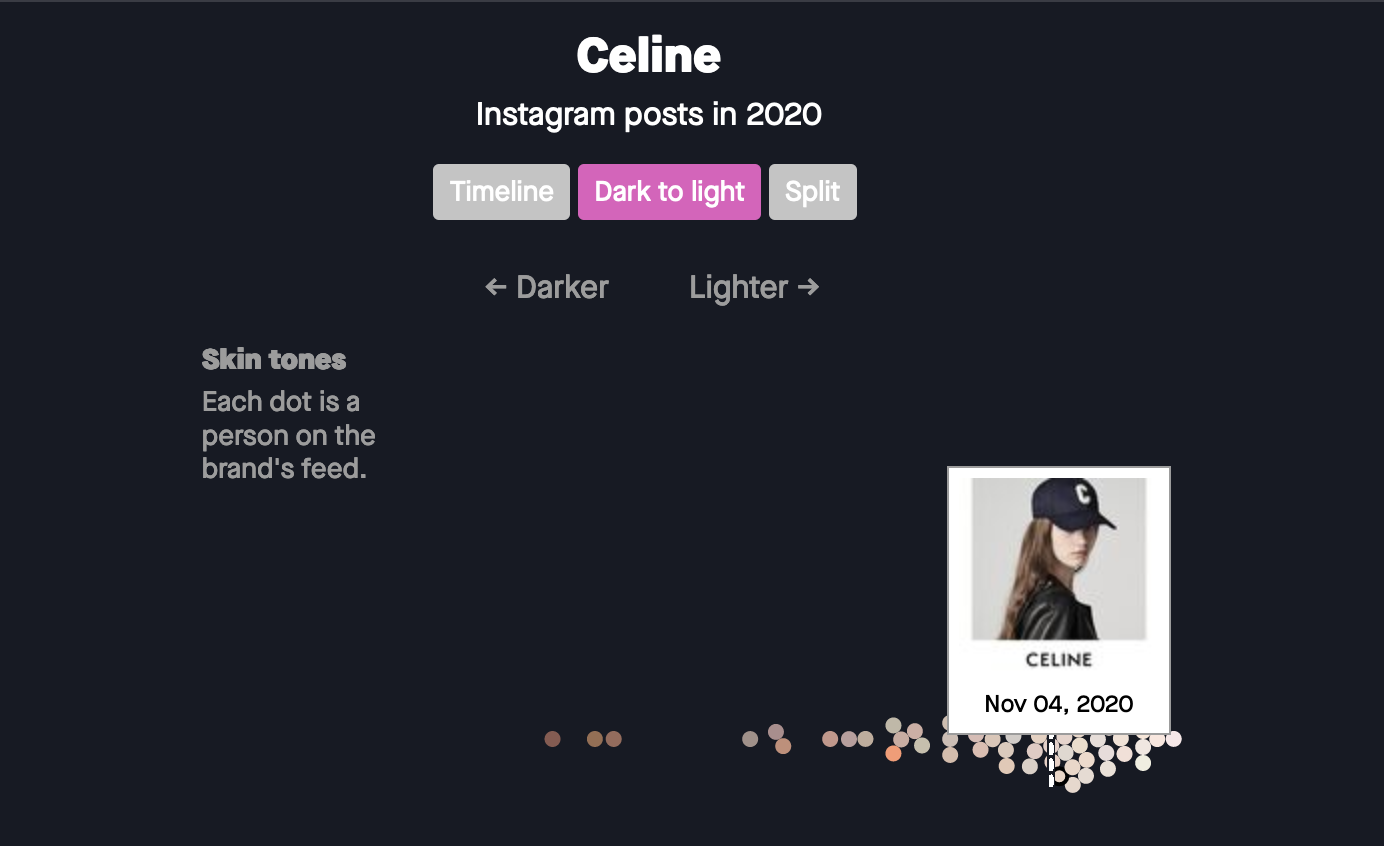
| Reyes, Yazmin |
fashion's
BLM reckoning was mostly bluster |
link
|
web |
|
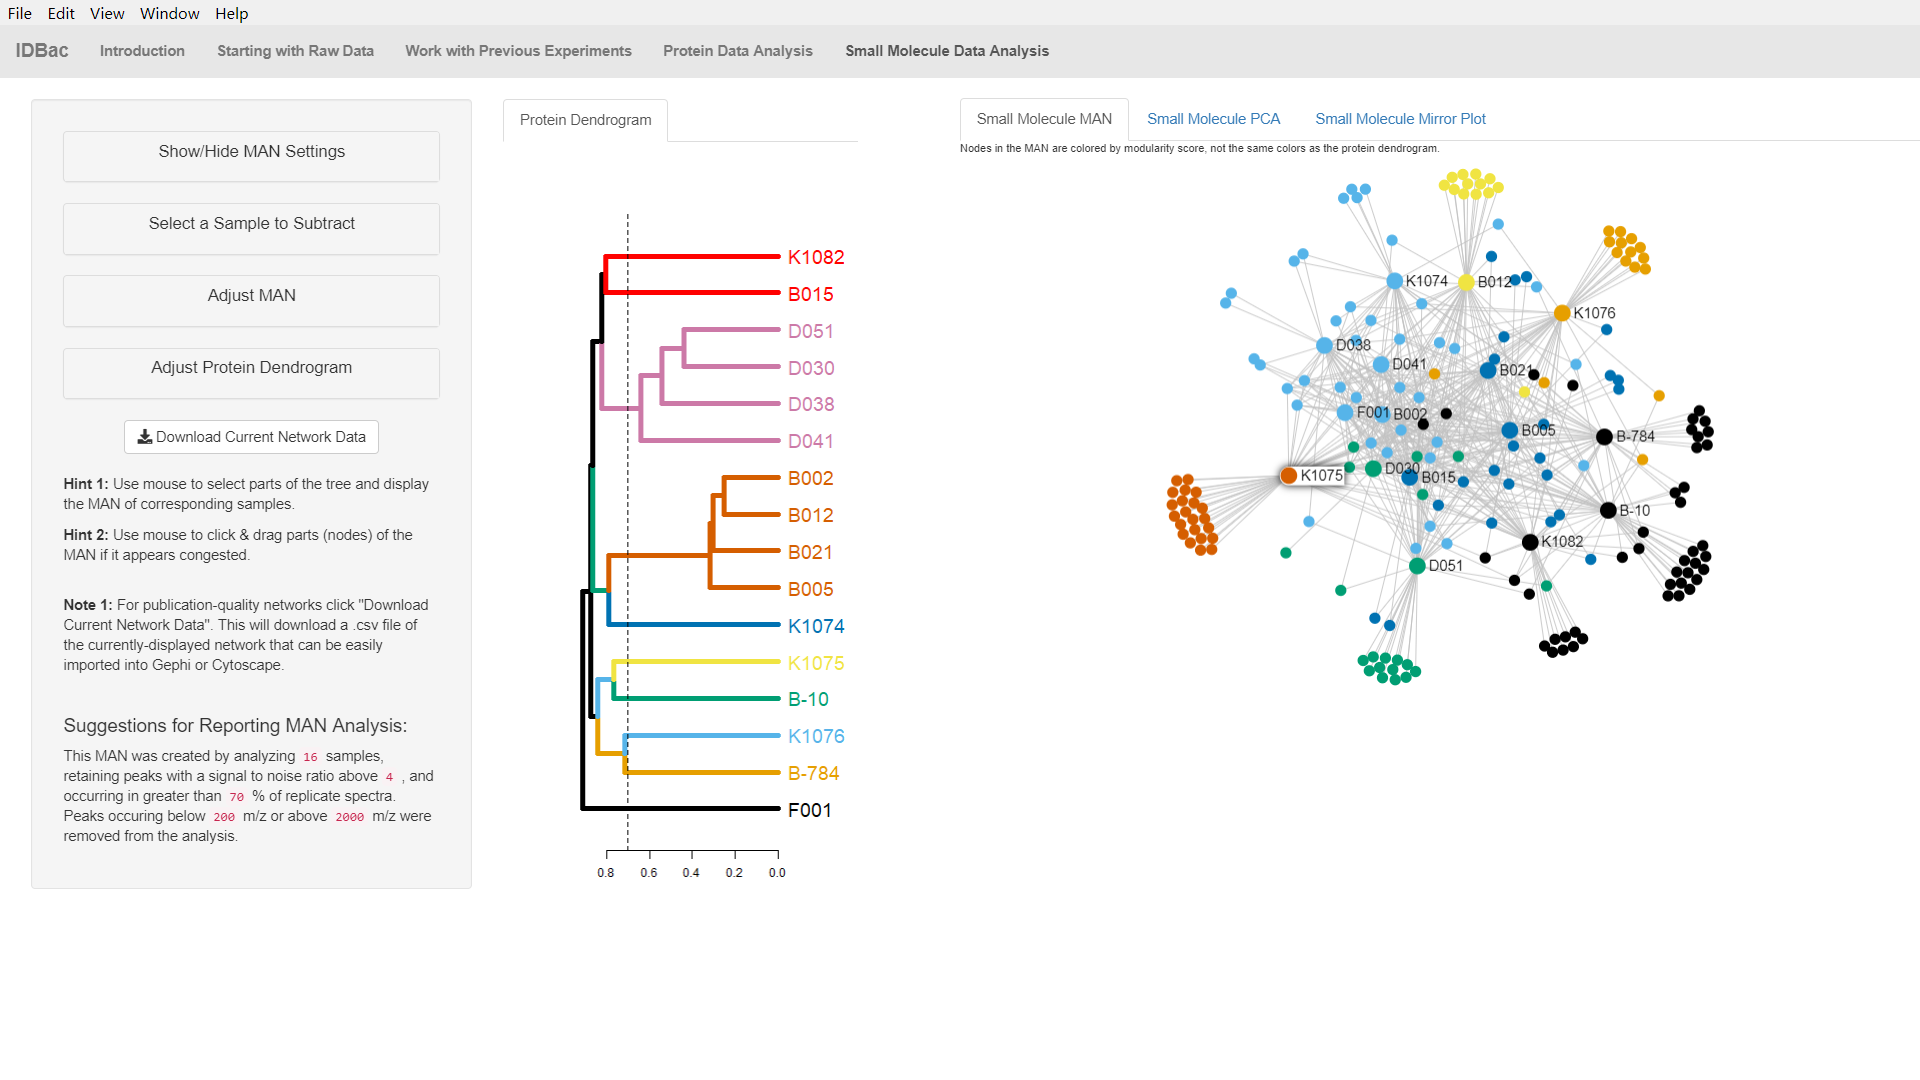
| Shumway, David |
IDBac:
Visualization of MALDI-TOF Mass Spectrometry data |
link | web | |
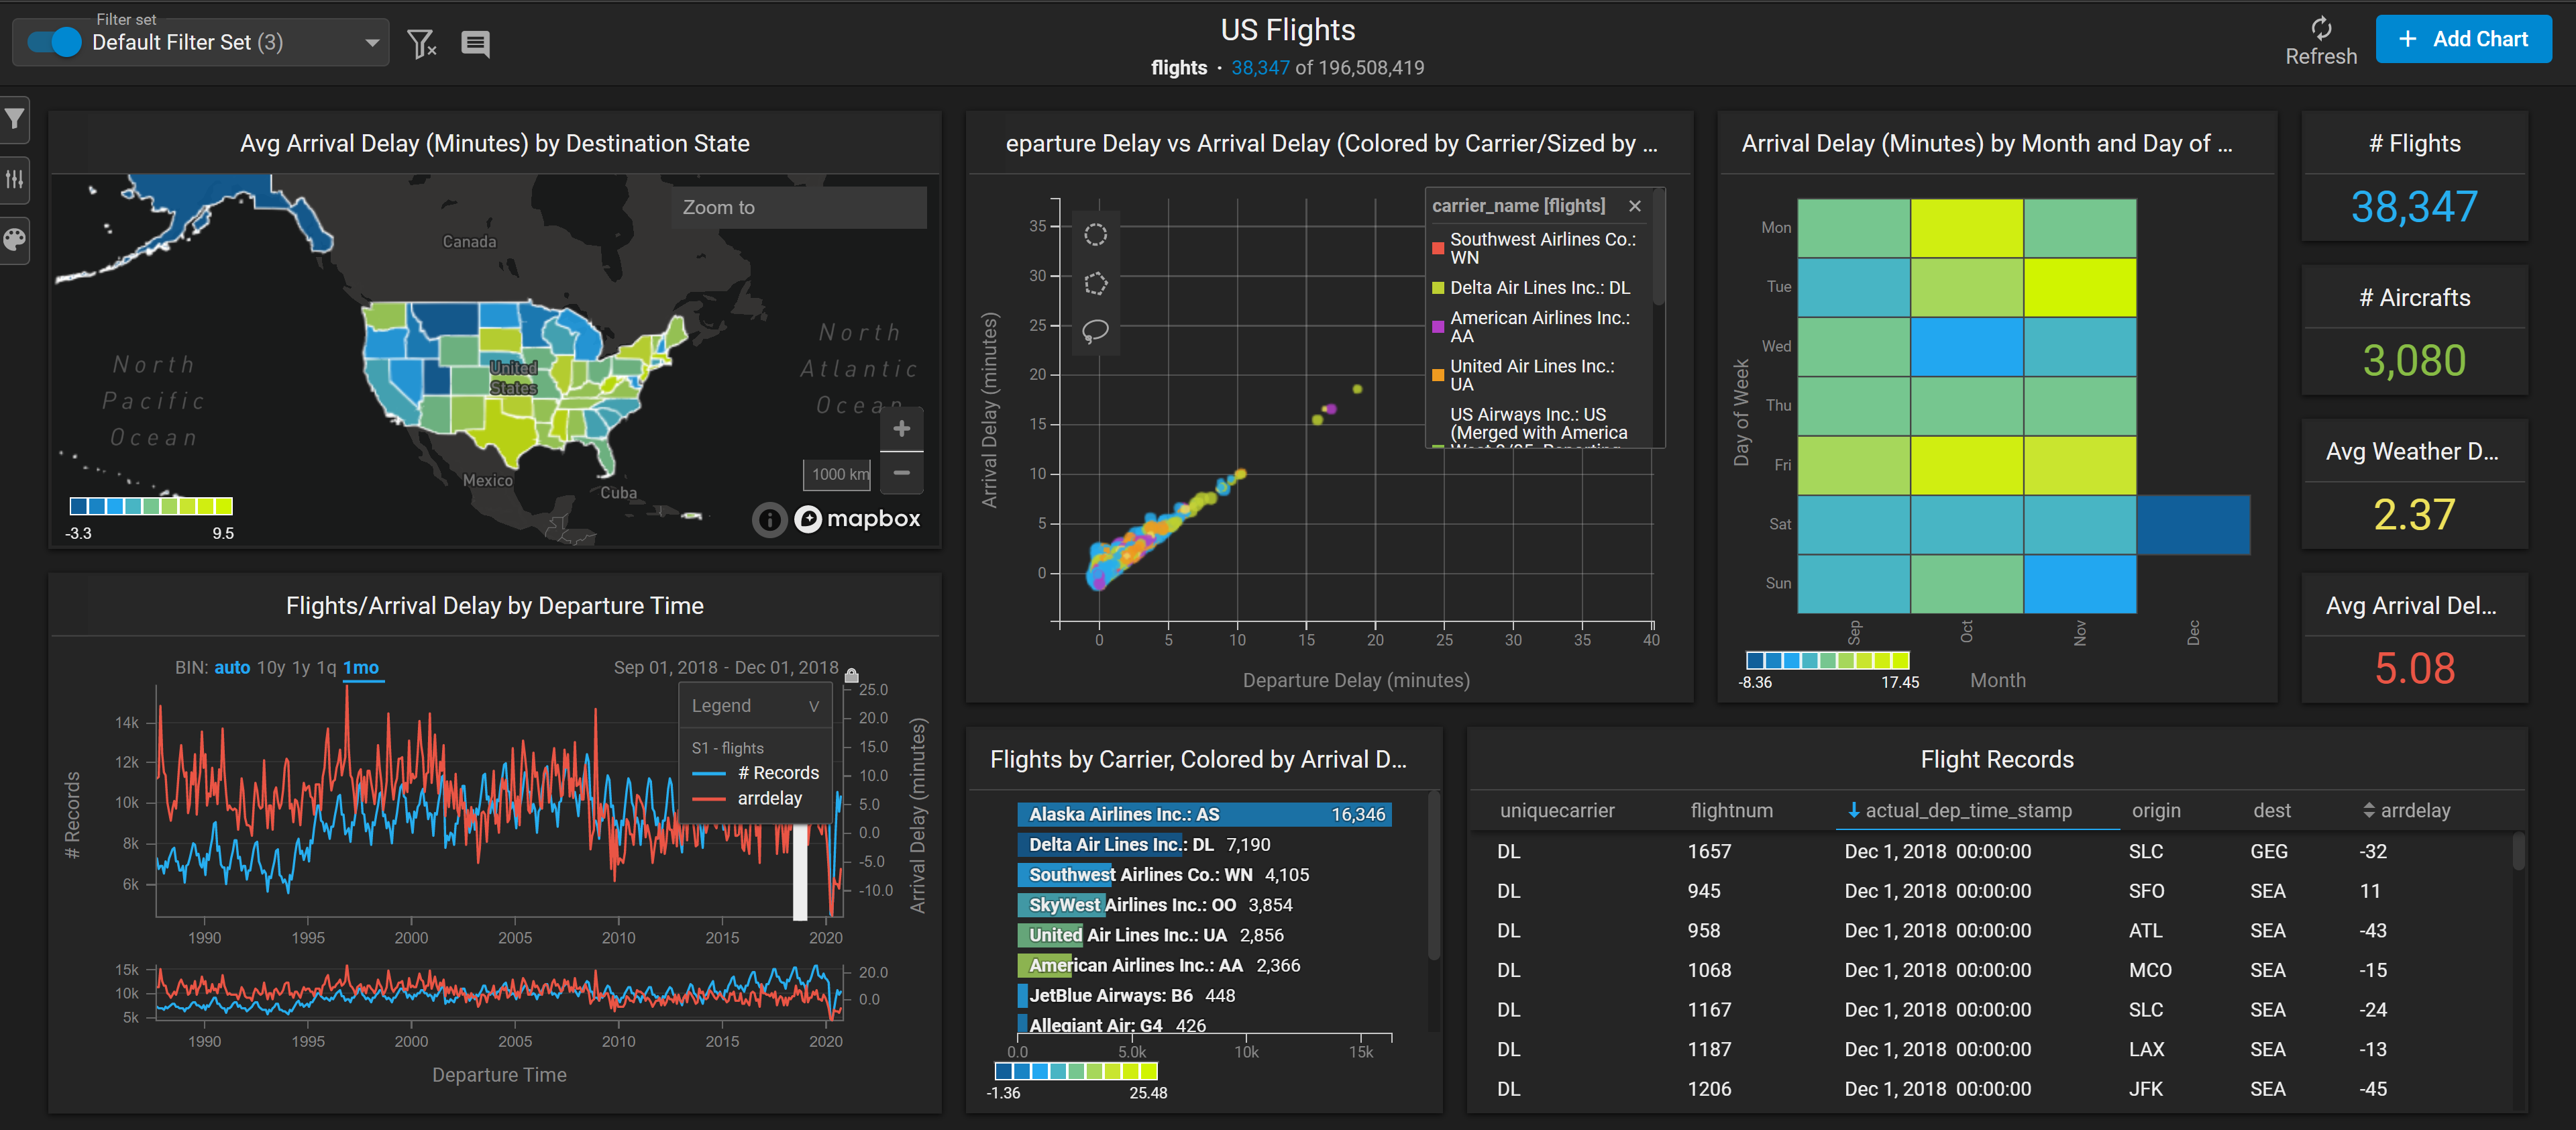
| Suraminitkul,
Eakasorn |
omni-SCI |
link | web video |
|
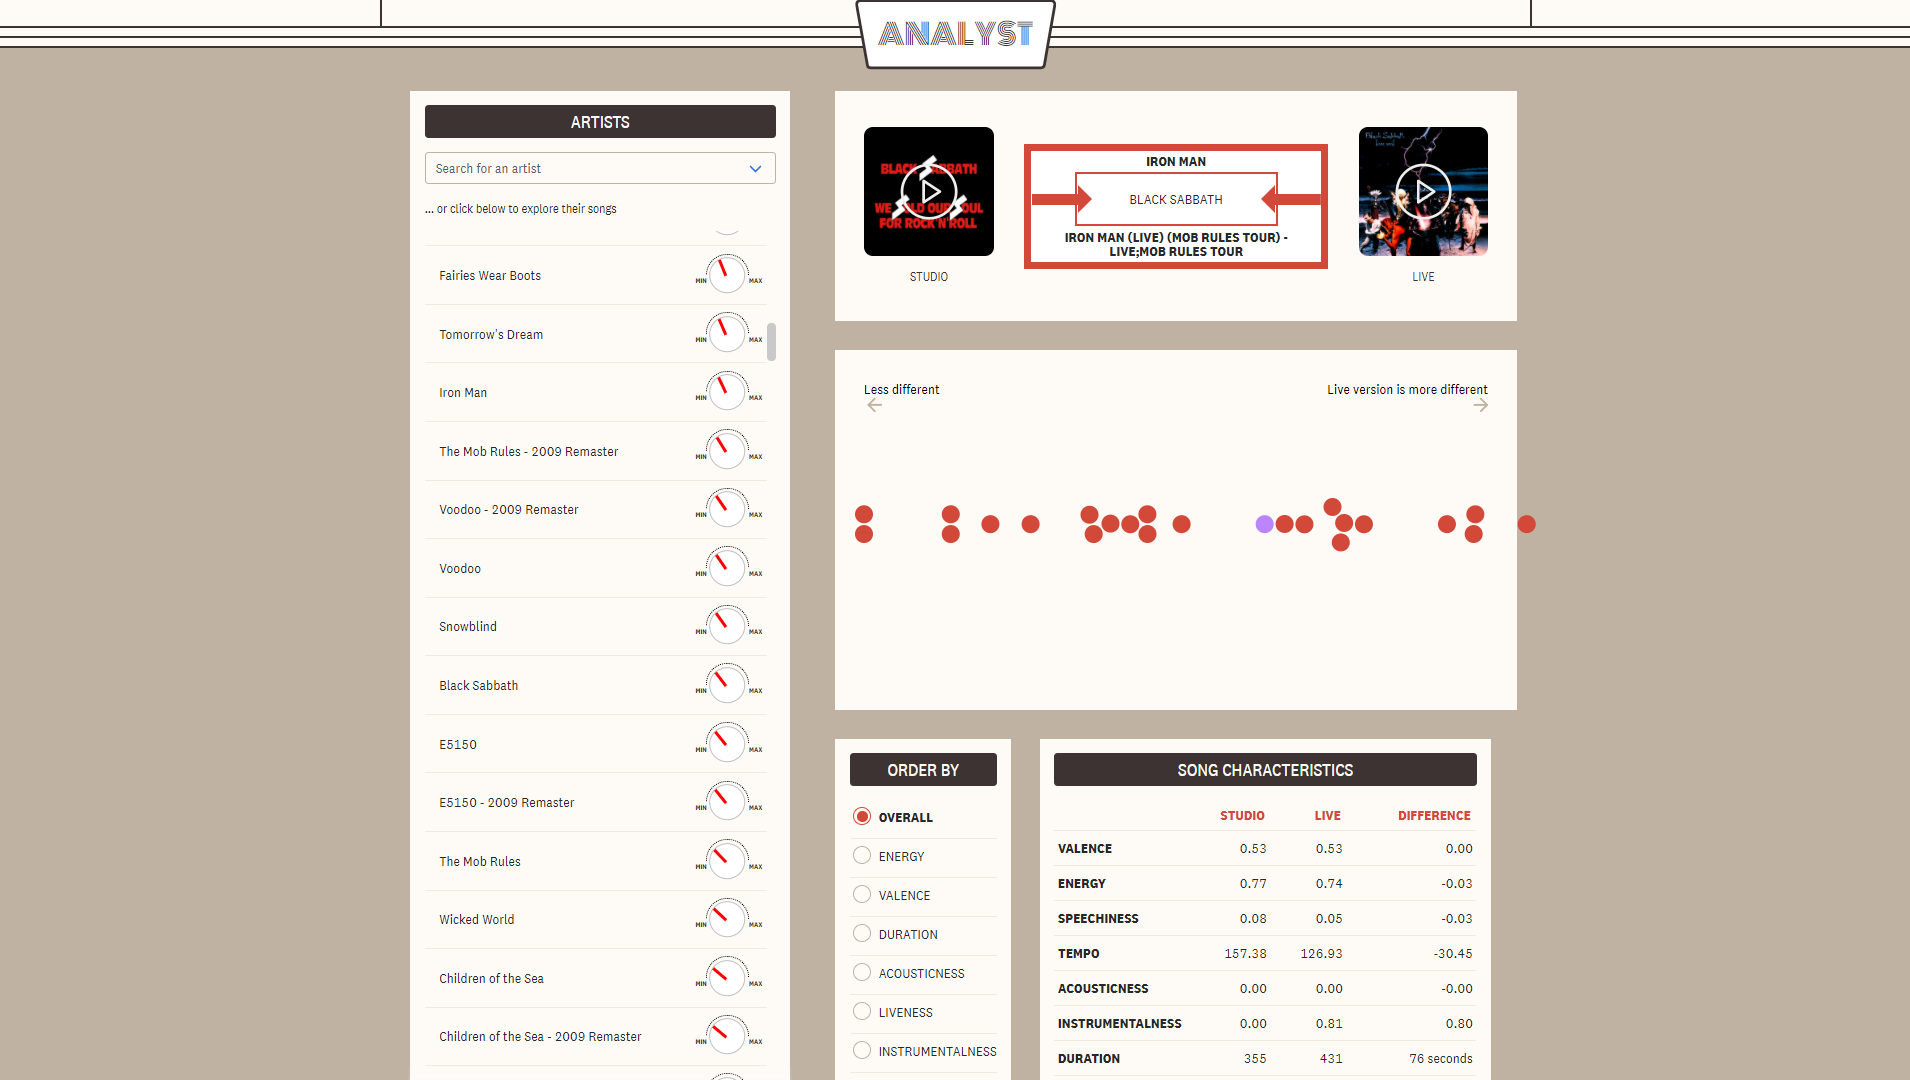
| Tapia, Andres |
Live
Music Analyst |
link | web | |
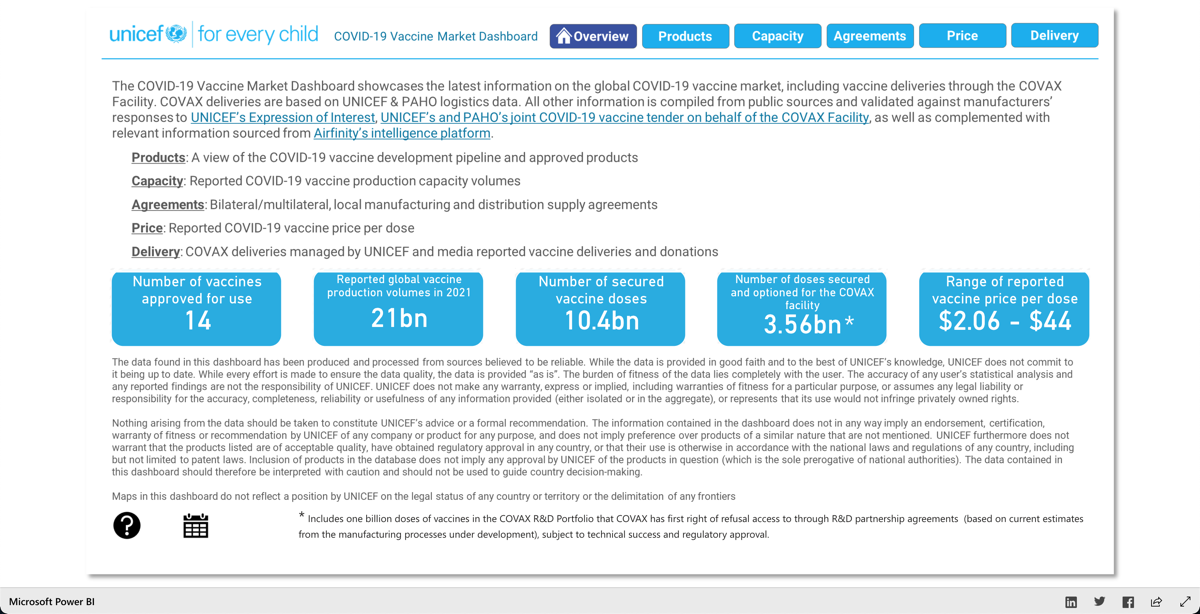
| Ziminski, Matt |
COVID
Vaccine Market Dashboard |
link | web | |