Project 1
gave you some experience with a very realistic human scale scene
experienced from the 'inside out' using existing models. This
project will give you some experience with creating a virtual
world from data and looking at it from the 'outside in'.
While its been a common
assumption that other stars in the universe have their own
planetary systems, it was only in the mid 1990s that the
first planet was found around a common star other than our
own. Now there are roughly 3500 confirmed planets around
2700 stars, with quite a few of those in what we believe to
be the habitable zones of their stars. This Project will
focus on visualizing those planetary systems.
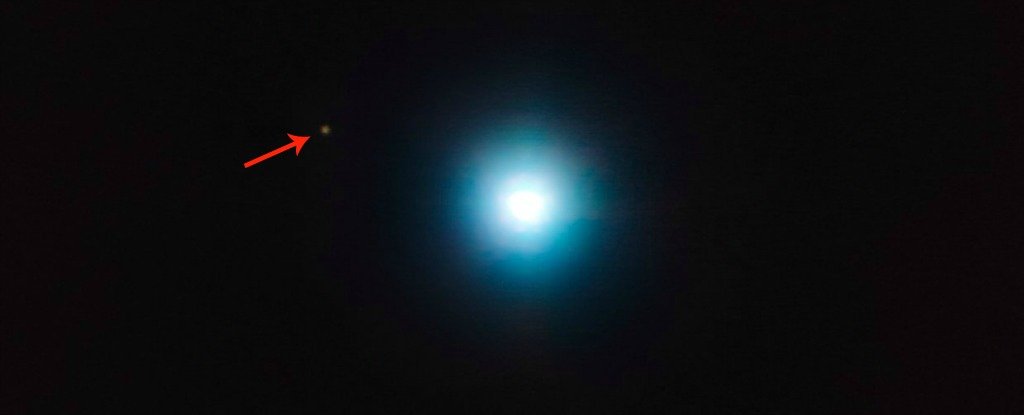
Note that while there
are a lot of conceptual artistic renderings of these
exoplanets, the best photos we have so far look like this,
where this planet (the small fuzzy dot with the arrow
pointing to it) is five times the mass of Jupiter, which
makes it a very big planet and almost a very small star.
<https://en.wikipedia.org/wiki/CVSO_30>
Scale is always a huge issue when
dealing with astronomical bodies since its usually impossible
to show everything in scale and be able to see anything at
all. As Douglas Adams famously said "Space is big. Really big.
You just won't believe how vastly, hugely, mind-bogglingly big
it is. I mean, you may think it's a long way down the road to
the chemist, but that's just peanuts to space." Typically you
can either show distances between objects in scale, or the
size of various objects in scale, but not both at the same
time.
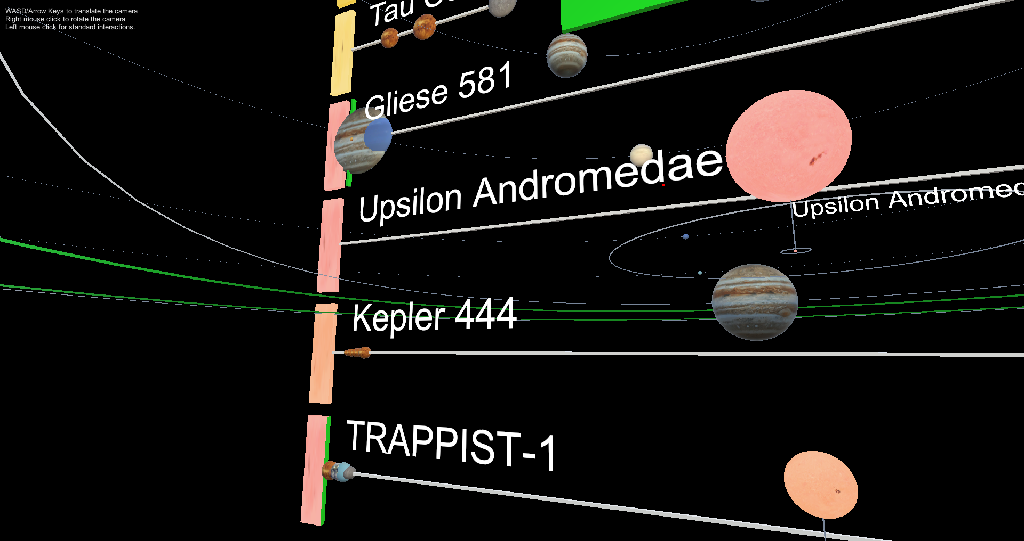
We also have binary, trinary, etc. star
systems, and we have discovered a much wider variety
of planetary systems orbiting them than we expected. The different types of stars also have very
different habitable zones. All of which makes it challenging
to create effective visualizations.
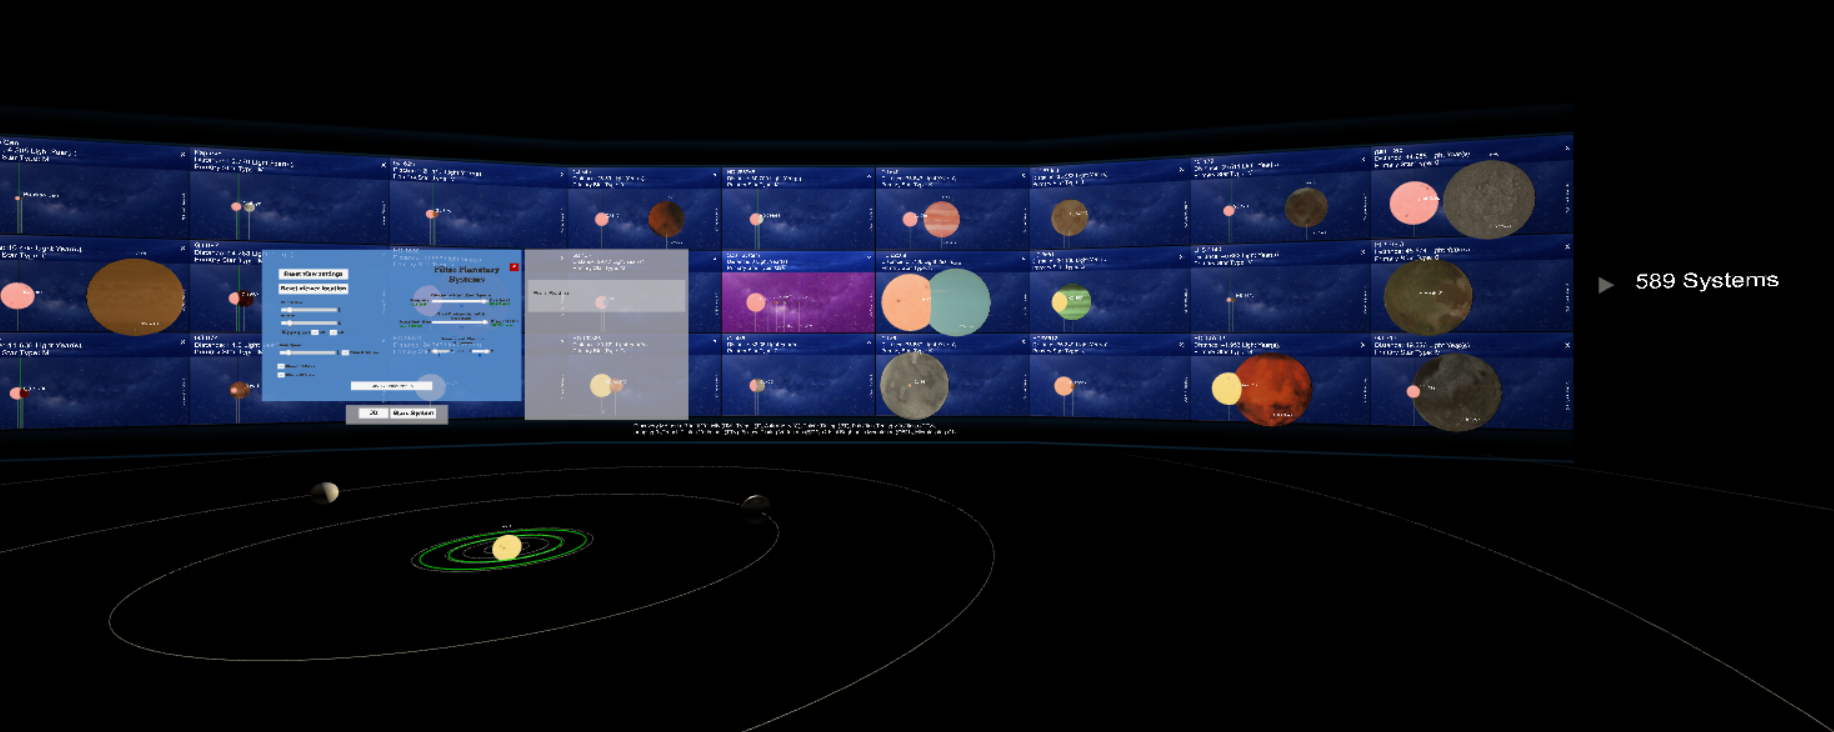
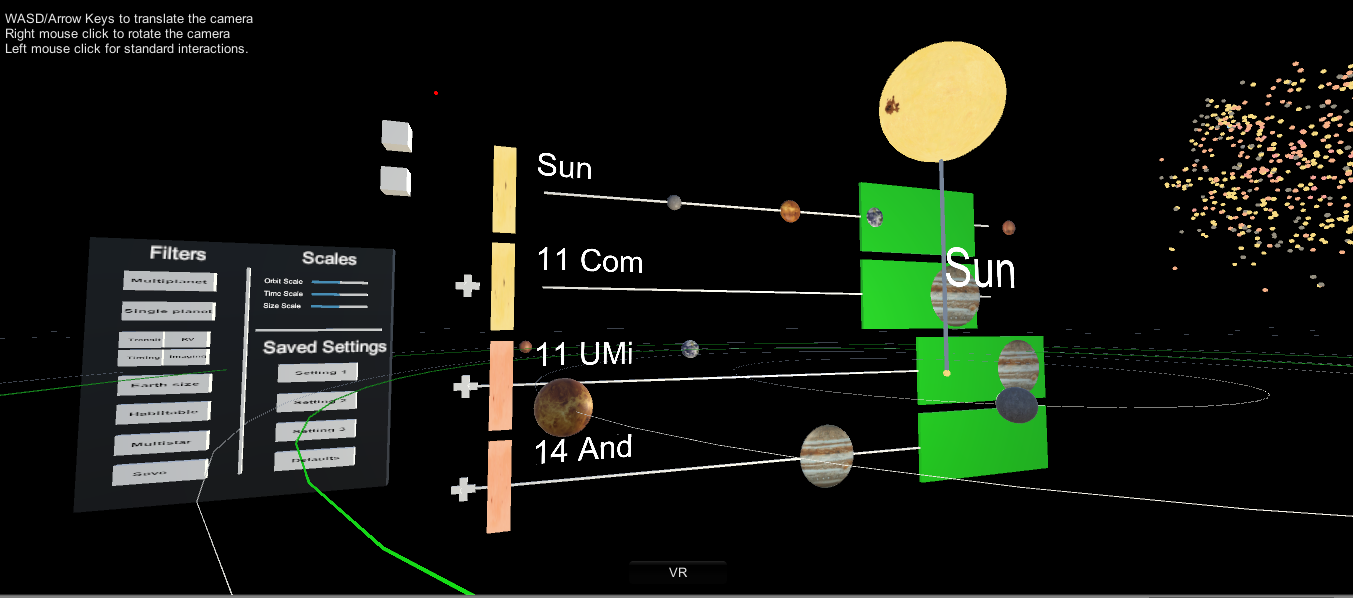
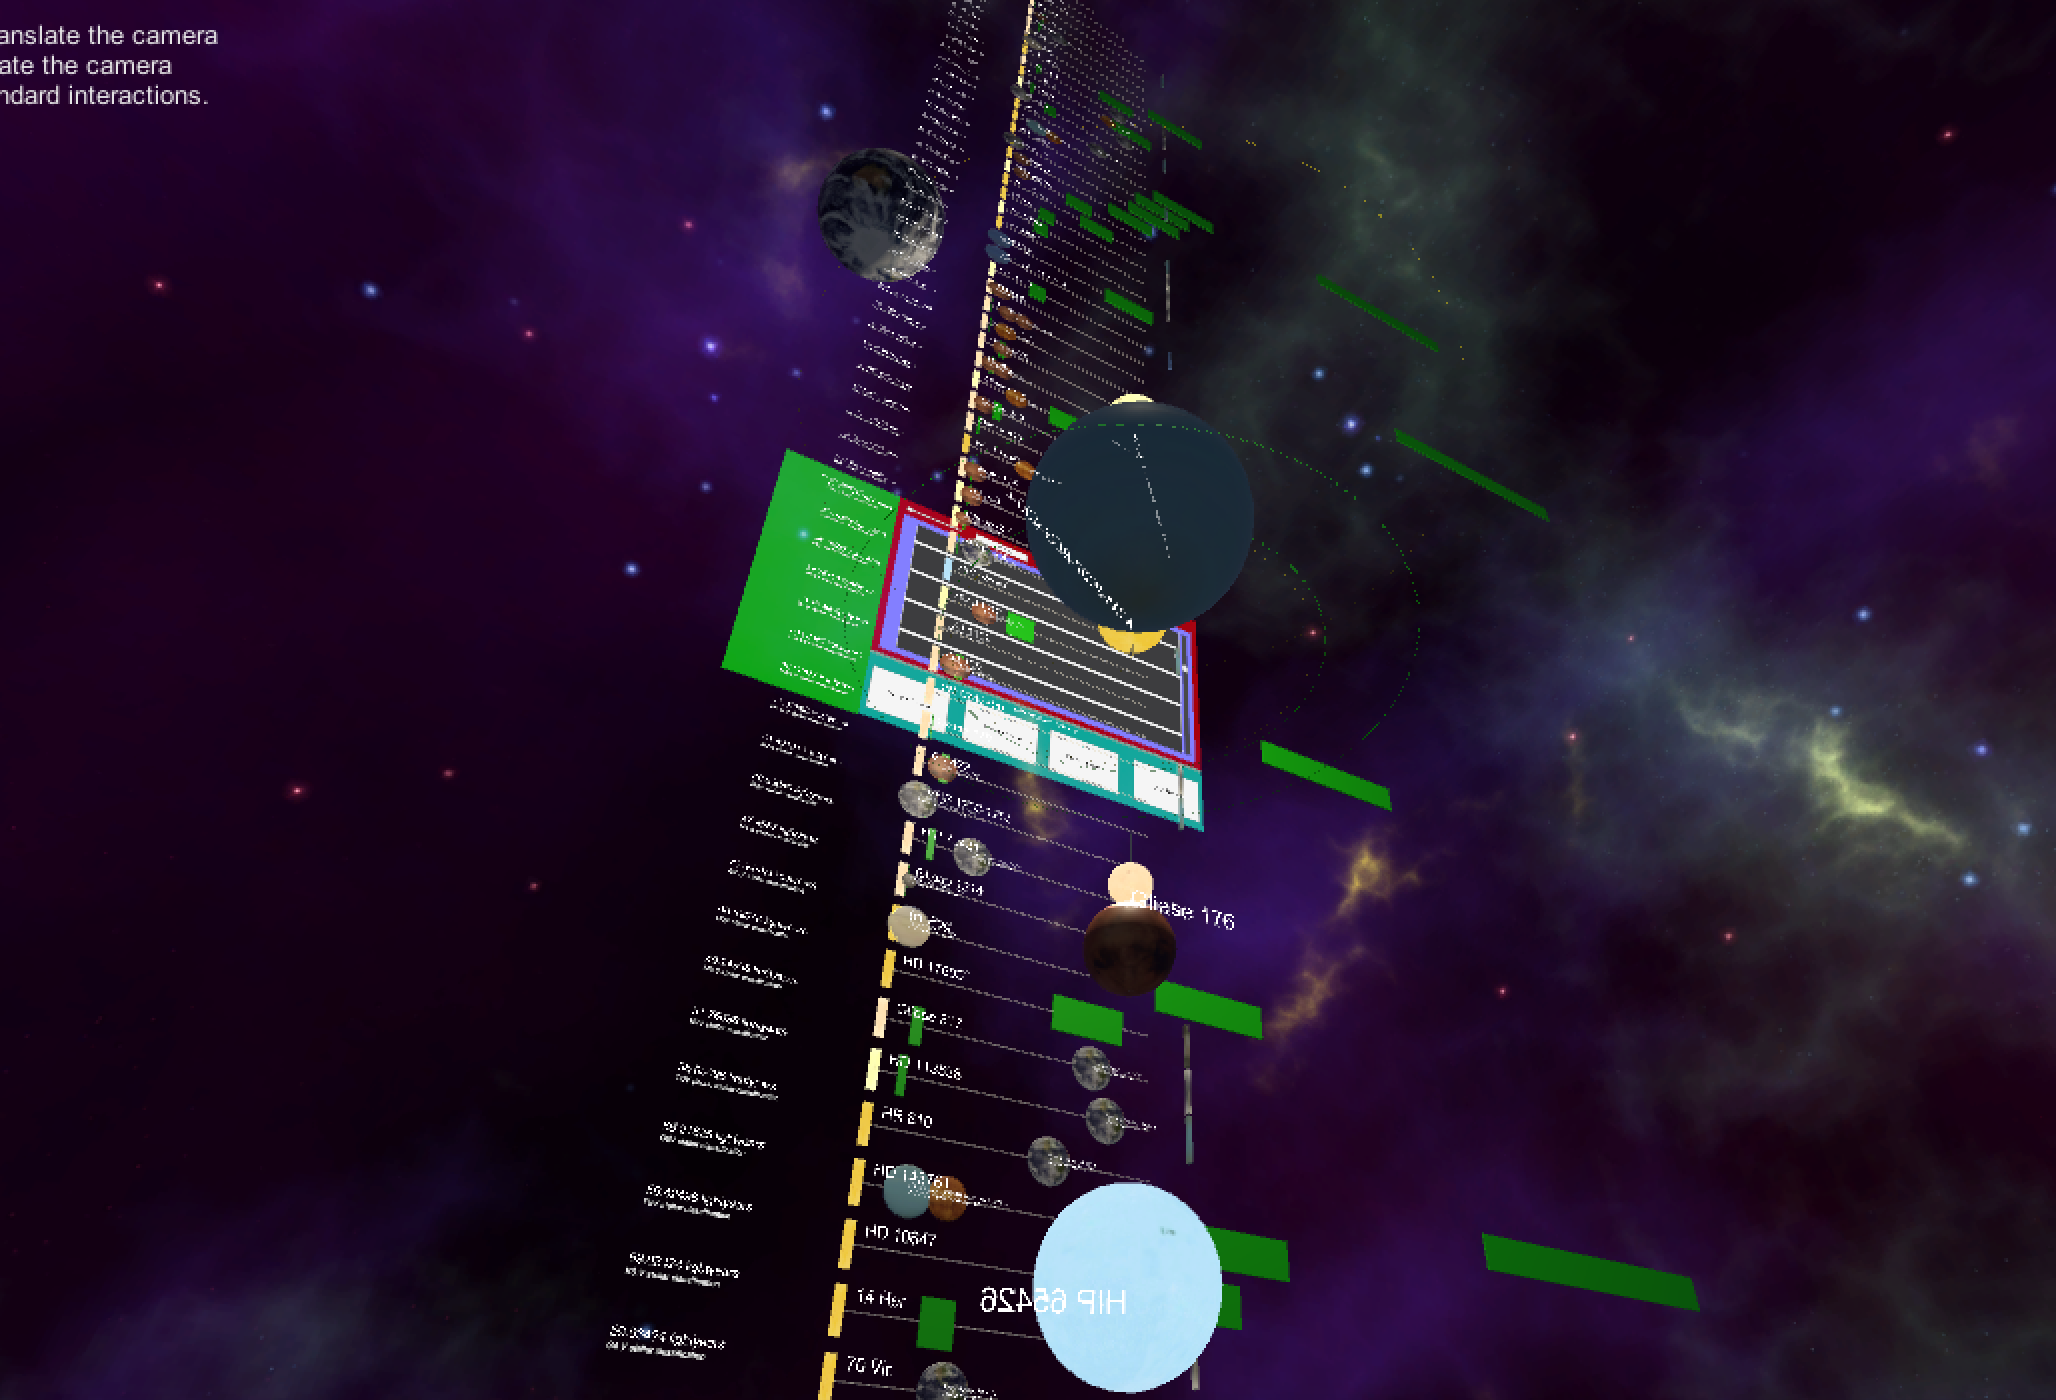
The app
that you will create will show these planetary systems in two
ways:
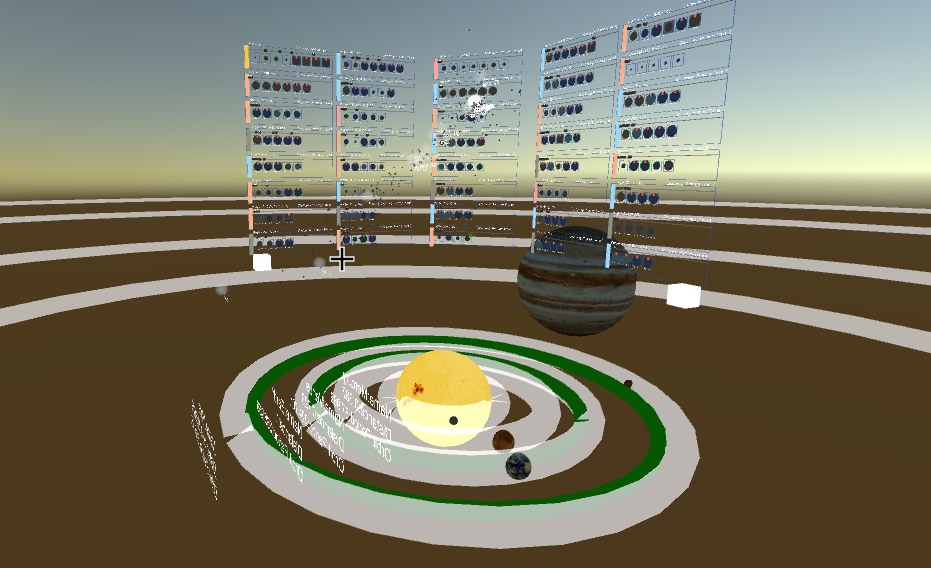
a 2D
'side view' of many of the systems simultaneously
surrounding the user to make initial comparisons
a 3D
moving view of a handful of these systems
You should start with our solar system with its
single star and 8 major planets. One of the 2D side views
should always show our solar system for comparison with the
others, and our solar system should always be available to
view in the center of the space for comparison. The sun and
the various planets should be modeled as spheres with
appropriate textures. For the 2D view you should be able to
see the name of the system, the type of star, how far this
system is away from us, how the planets were discovered, the
distance from the star to each of the planets, the identifying
name of the planet, the relative sizes of the planets, and the
location of the habitable zone for that star. In the 3D view
you should have the planets with their identifying name
orbiting the named star at an appropriate distance, with an
appropriate relative size and texture, and orbiting at an
appropriate rate, and show the habitable zone for the star.
Where it gets more interesting is adding in other systems in
both the 2D view and the 3D view. You should not be building the various solar
systems one by one by hand. Given the data on the various
planets of each solar system you should be able to
automatically generate a visualization for each one. However,
as you add more and more systems to your visualization you
will see more and more oddities where you will need to tweak
your visualization parameters so it remains useful. These
other systems should be stored in a text / XML / json file in
an easy to understand format that your program reads in, so
its easy to update that file as more discoveries are made.
Users
should be able to point at one of the solar systems shown in
the 2D view using one of the wands and bring it into 3D in
the center of the space. Users should be able to walk or fly
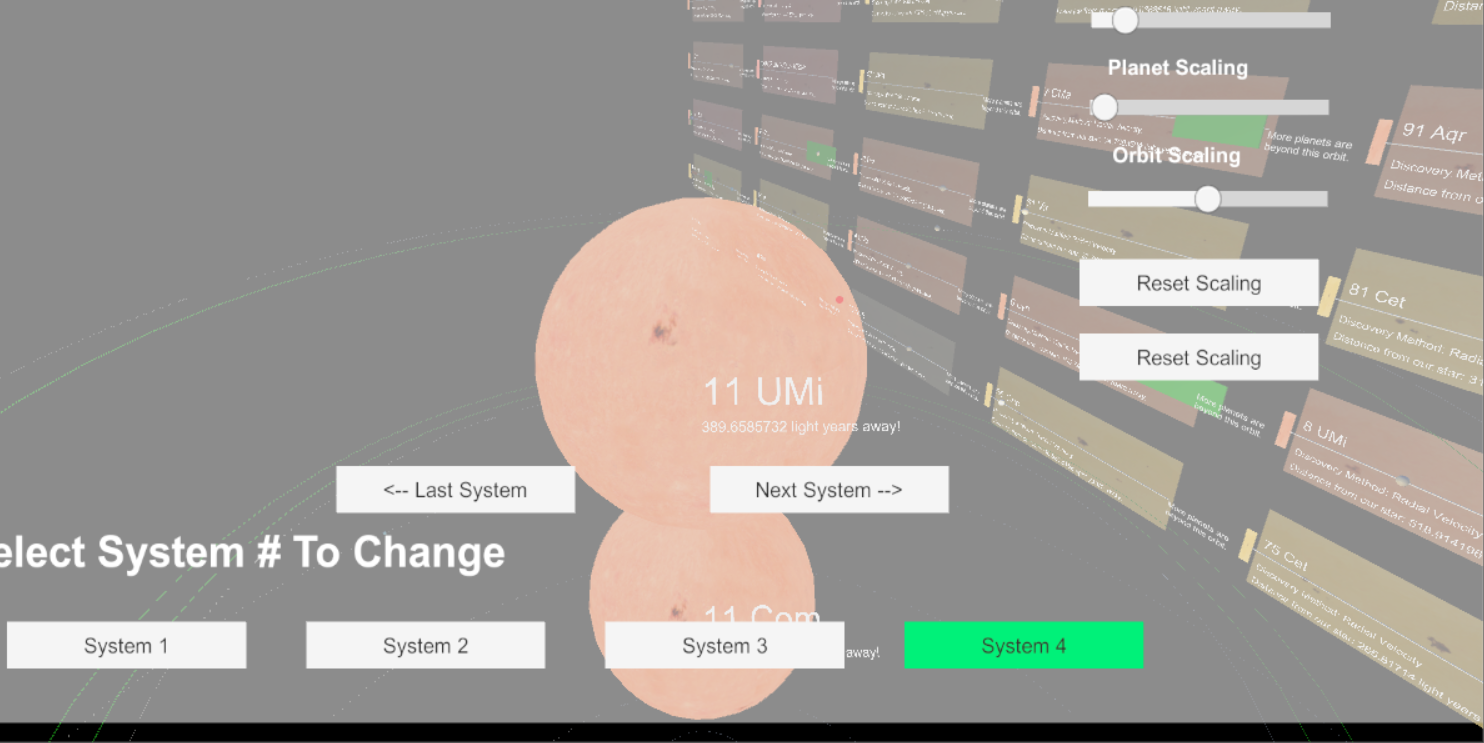
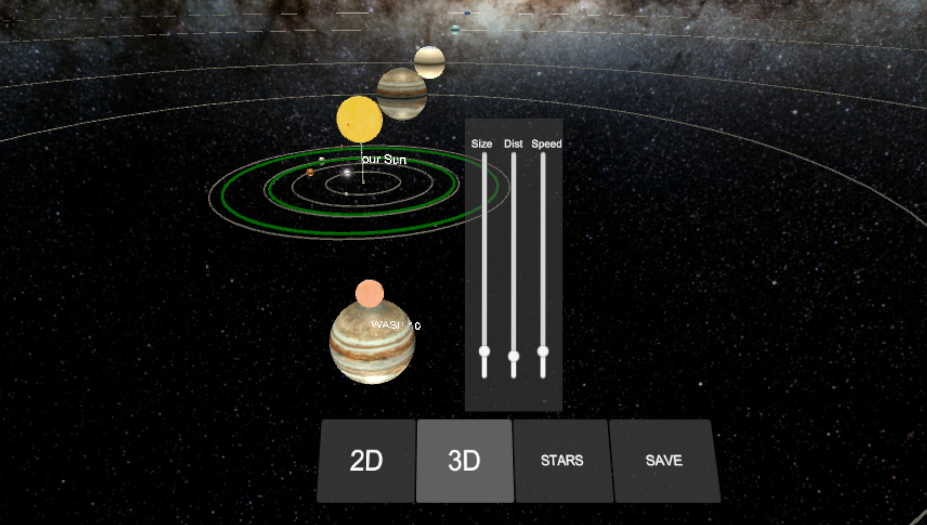
around the 3D solar systems. The user
should also be able to change the scale of the orbits, the
scale of the planets, and the speed that time passes as the
planets orbit. The goal here is to create a useful tool that
will let people make effective comparisons - if all the
planets are overlapping and scrunched up next to the star,
or spread out so far you cant even see them, then that's not
a good tool, so you need to give the user a way of
intuitively interactively changing temporal and spatial
scales.
Note that you are expected to learn some astronomy
as part of this assignment. You will need to do some
research to complete this project, as in the real world when
working with people from other disciplines.
You will find that the different detection methods give
different information about these planets, so some assumptions
need to be made to combine the datasets. Sometimes we know the
radius of the planet and sometimes we know the mass of the
planet. Unfortunately without knowing the composition of the
planet (rocky like the Earth or gaseous like Jupiter) we can
not directly correlate these, but we can do some general
correlations. One such way is given below. There are others.
Pick and defend an appropriate method.
earth-sized ( < 1.25 X
radius of earth) < 2 times mass of the
earth
super earth (1.25 - 2 X
radius of earth) 2 - 5 times mass of
earth
mini-neptune ( 2- 3 x
radius of earth) 5 - 10 times mass of
earth
neptune sized ( 3 - 6 X
radius of earth) 10 - 30 times mass of
earth
jupiter sized ( 6 - 15 X
radius of earth) 30 - 300 times mass of
earth
super-jupiter ( > 15 X
radius of earth) > 300 times mass of
earth
inner
edge of the hab zone = 0.95 * (Luminosity of this star /
Luminosity of our sun) in astronomical units
outer
edge of the hab zone = 1.4 *
(Luminosity of this star / Luminosity of our sun) in
astronomical units
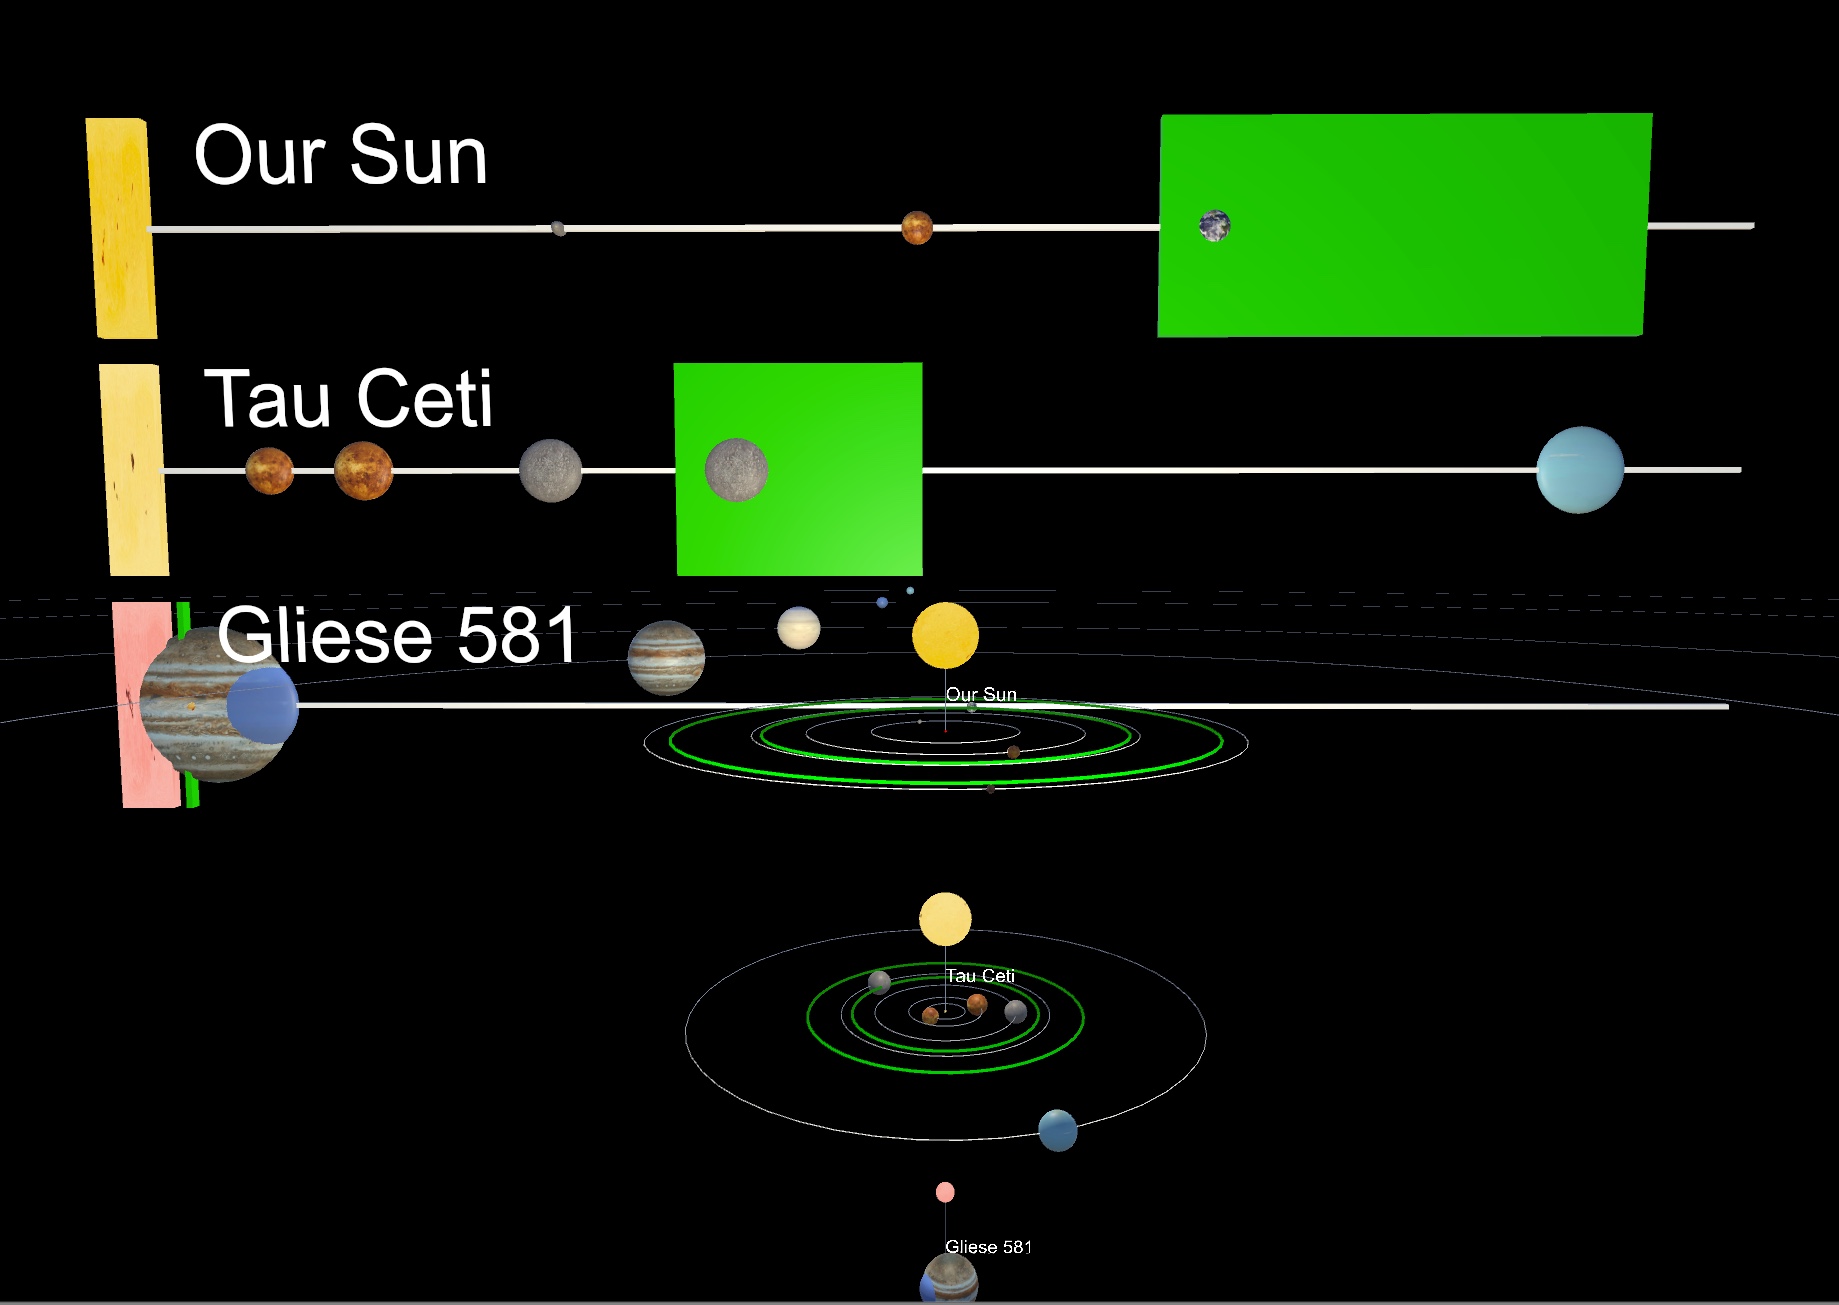
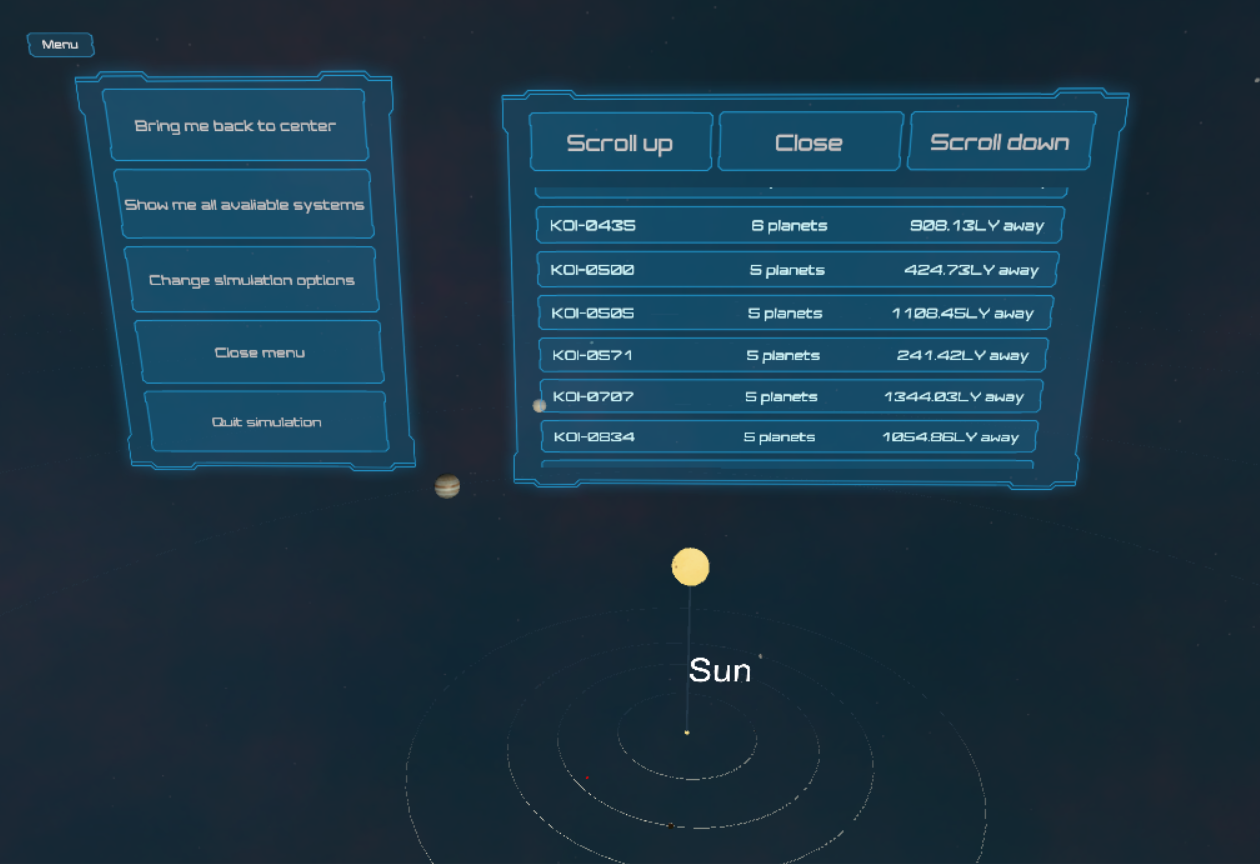
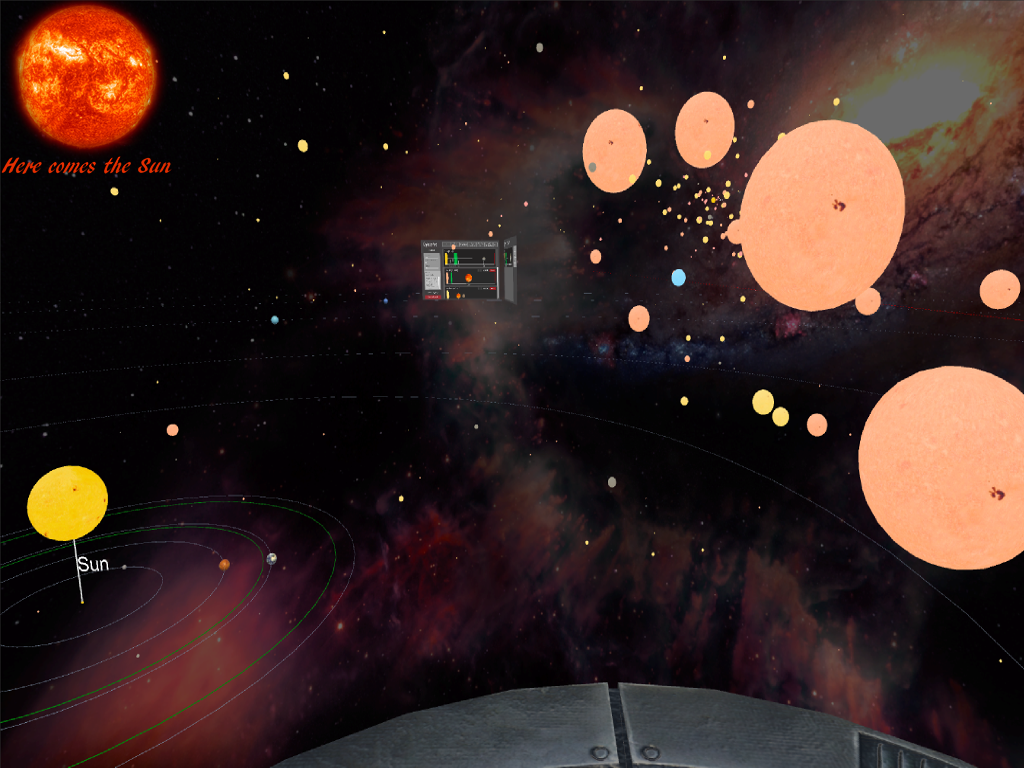
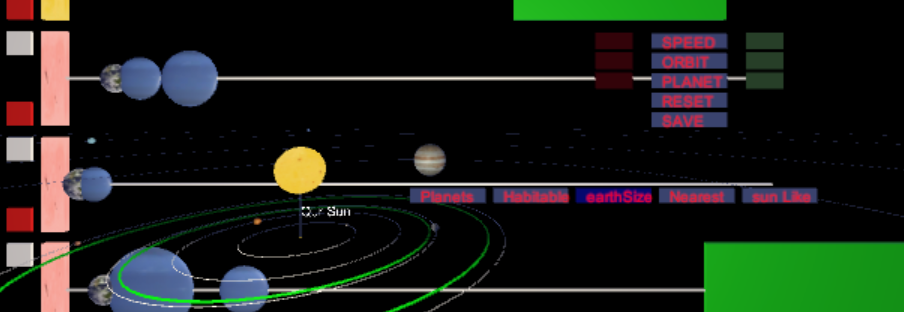
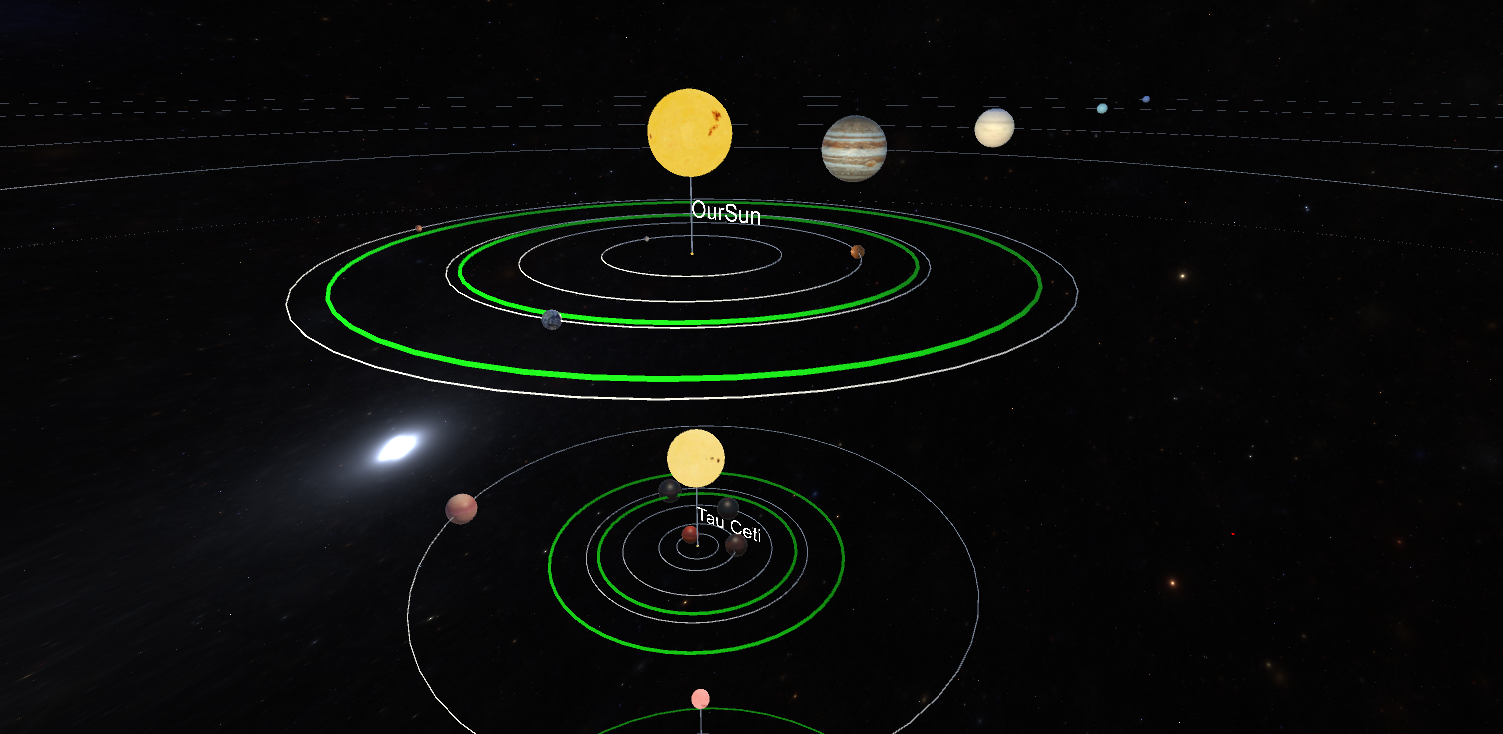
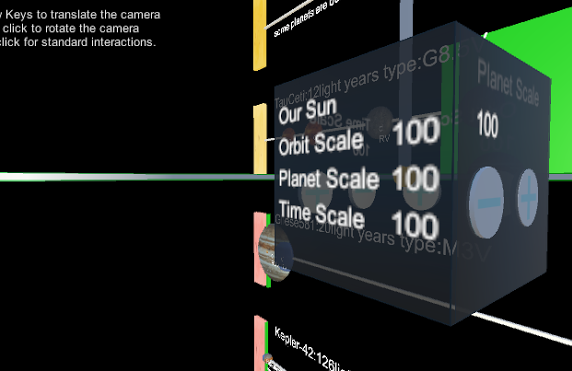
To get you started I created a proof of concept
app with a simple version of the 2D and 3D views of our solar
system along with a couple others (Tau Ceti, a star similar to
our sun, and Gliese 581, with a very different collection of
planets orbiting a much cooler star). In this case the 2D view
shows the color of the star, the name of the star, the
location of the habitable zone in green, the orbits of the
planets around the habitable zone, and the relative sizes of
the planets, with appropriate textures. The three systems are
also shown in 3D with the planets orbiting at the appropriate
rates, and at the correct relative distances, in relation to
the habitable zone of the stars. Note that there are some
problems here - I would like to show Mars as its not that far
outside the habitable zone in our solar system, but even
without Mars at this scale the Gliese 581 system has its
planets scrunched up around the star, so this is where
interactivity is important to be able to dynamically scale
these representations to be able to adapt.
The sample project file to get you started can be
found here
Implementing the
Project This project will be a group project and you can
form groups of your choice with 2 or 3 members. As soon as you
have formed your group send an email to andy so he can approve
it.
While we have good textures to map onto the
planets in our solar system, for the other planets you will
need to find some appropriate textures - a good place to
start ishttp://www.celestiamotherlode.net.
To get a C on the project ...
Create a usable,
visually appealing 2D 'side view' visualization of at least
10 simultaneous planetary systems (including our own) as
described above, read from a data file. Each of the 2D 'side
views' should show the name of the planetary system,
distance from our solar system in light years, the type of
star, how the planets were discovered, and current
identifying name for each planet
Allow the user to use
the wands to increase or decrease the scale of the orbits.
Any change in any of the scale factors should be reflected
in all of the views simultaneously so they are easy to
compare
If one or more of the
planets is not visible in the current 2D view (i.e. its
outside the current scaled view) show an appropriate
indication of that.
Show our solar system
animated in the center of the space in 3D
Use a wand to choose any
one of the currently visible 2D planetary systems to bring
into the center of the space to view in 3D along with our
solar system for comparison. If there is already another
system in 3D (aside from our own) then replace it
Time should pass in the
3D view, so the planets will orbit their parent star in the
3D space, and the user should be able to change the rate of
time passing. You can assume the orbits are circular and all
in the same plane to simplify things.
Allow the user to walk
around or fly around the 3D system(s)
Be able to use the wands
to reset the views back to a default view and the user back
to their default location
Make appropriate use of
audio in your application
Have menu and controller
options to change scale of the planet size, orbit size, and
speed of revolution using the wands
To get a B you need to add ...
Increase from 10
simultaneous 2D planetary systems in view to 40 read from a
data file
Have a predefined set of
4 different interesting sets of planetary systems (e.g.
nearest to the Earth, most planets, most planets likely to
be habitable, stars most like the sun) to view on the walls
based on different parameters in a menu and be able to
switch between them
Move from a maximum of 1
exoplanetary system along with ours in 3D to a maximum of 4
exoplanetary along with ours that can be selected by the
user using the wands
Highlight the earth
sized planets in the habitable zones and larger planets that
may have habitable moons orbiting them in the habitable
zones
To get an A you need to add ...
Read in a much larger
data file of planetary systems (i.e. the 600 systems with
multiple planets)
Move beyond the 4 fixed
sets of planetary systems to dynamically filter which
systems are currently shown on the screens
Allow the user to use
the wands to dynamically move individual 2D systems around
to reorder them manually, and allow the user to remove
systems from the 2D view set and the 3D view set
Allow the user to use
the wands to save off configurations of the 2D systems
Look up some current
research discoveries and highlight these things in your
interface / visualization
Impress me with
additional features
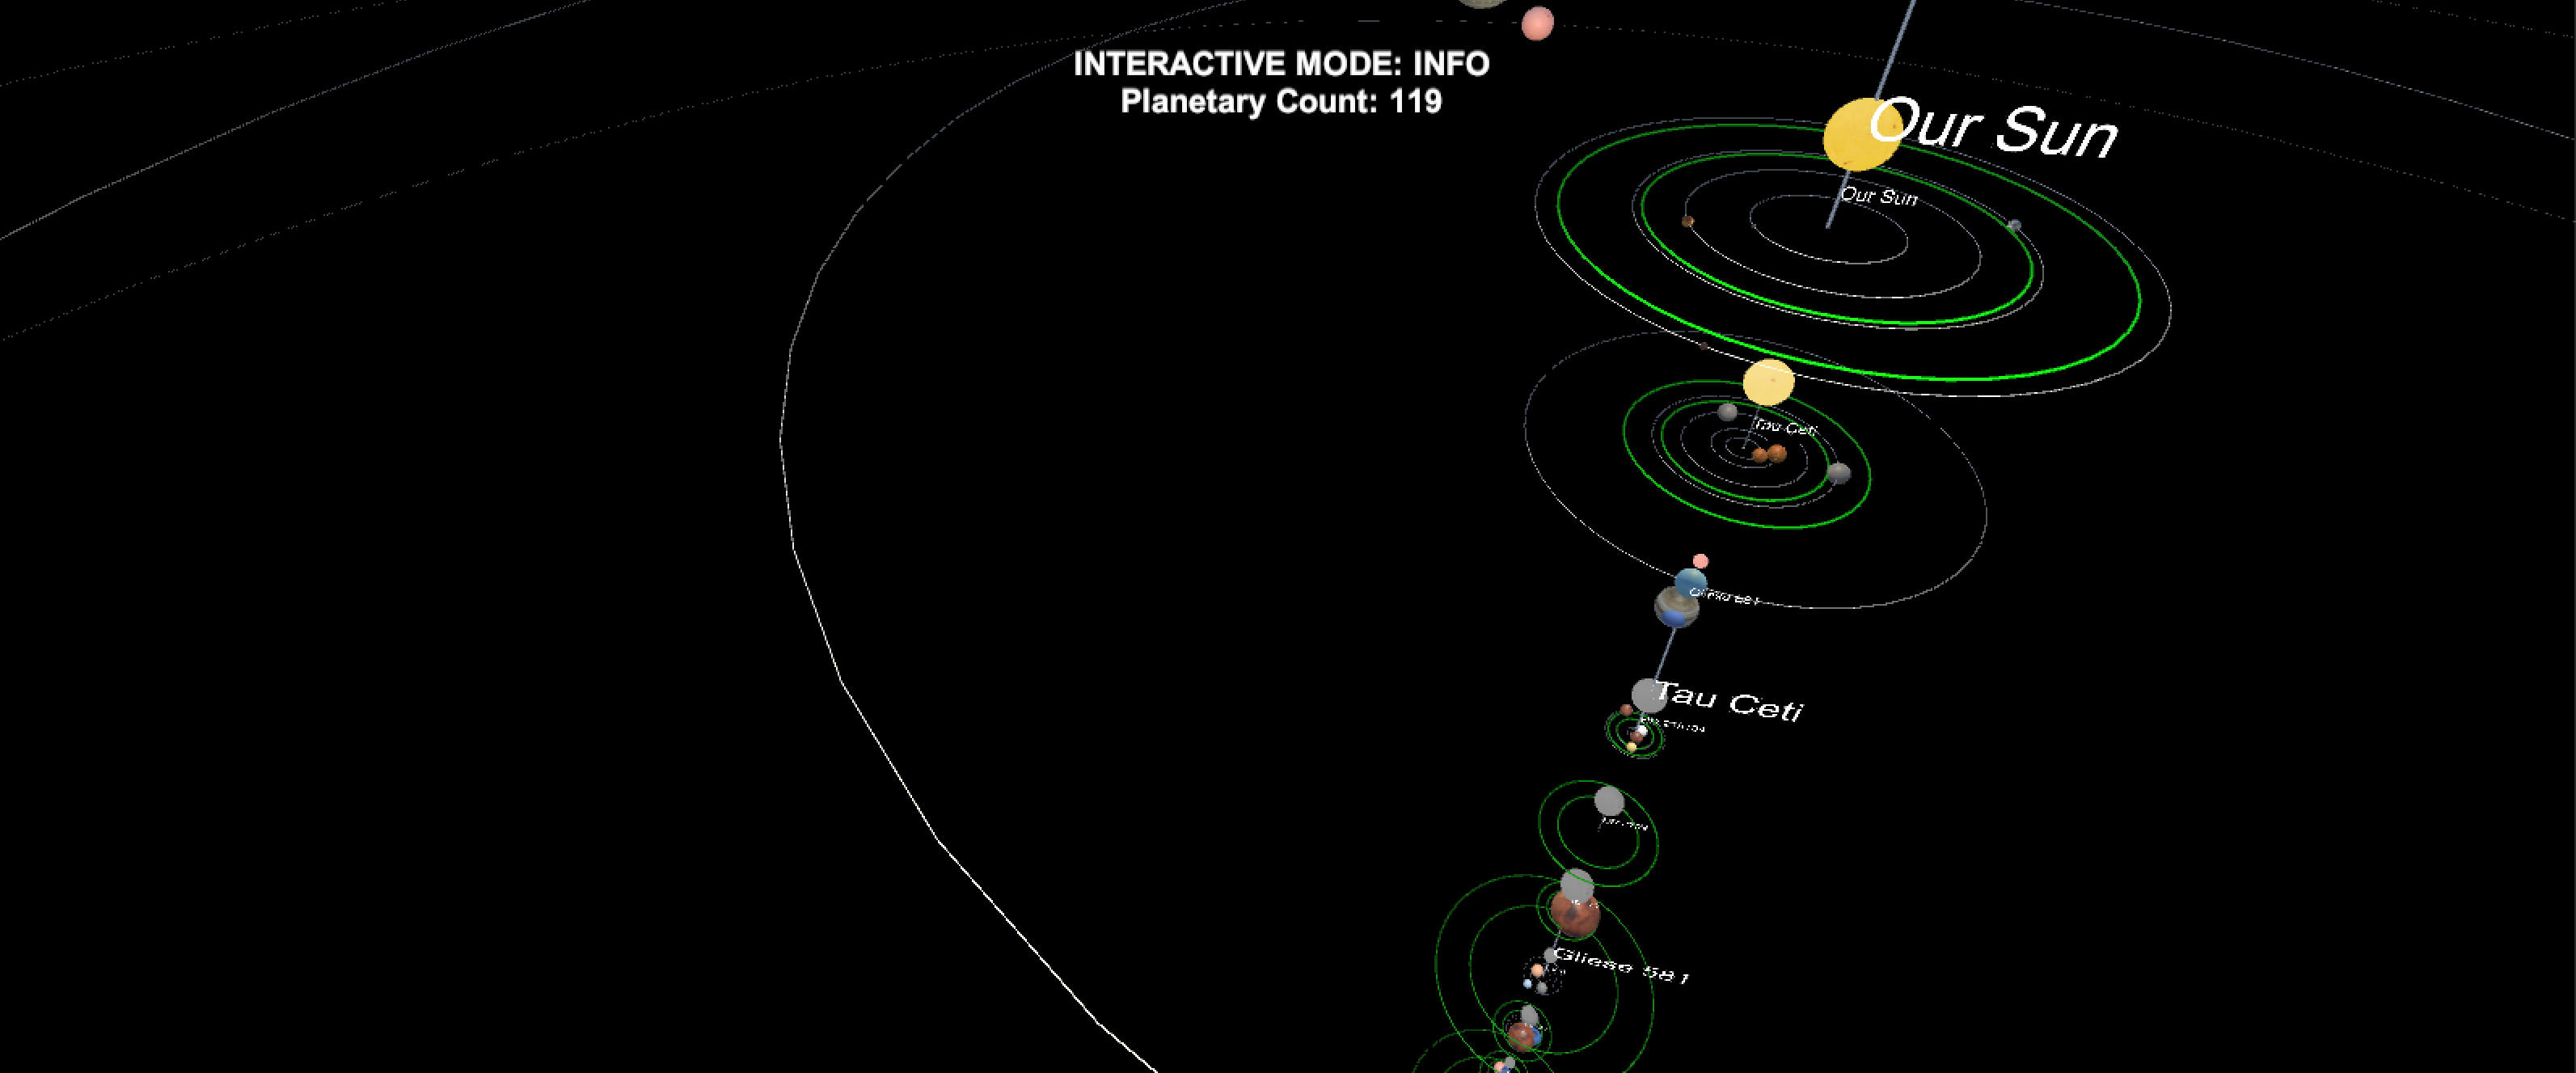
Graduate students need to also do the following
Create another 3D view
showing where all these various stars are relative to our
sun and the other nearby stars (e.g. a bunch of coloured
balls in 3-space), and highlight the system(s) that is/are
currently being shown in the 2D views. This is a good way to
highlight the different detection methods.
Allow a user to choose a
planetary system to view from this 3D view using one of the
wands
Find a
good way to deal with binary and trinary systems in both
the 2D and 3D views and show some example systems.
There are some things to keep in mind when creating this kind
of procedural application in Unity. Unity tries very hard to
optimize the final build in terms of space by not including
shaders, textures, etc that aren't used in the scene. In this
case we start out with an almost empty scene so we need to
tell Unity to load our assets - this is where the Resources
folder comes in. As in my sample project, the Resoures folder
in the Assets folder holds all the assets you want to force
unity to load so you can refer to them by name later on, so be
sure to put any new textures you want to use in there.
Similarly Unity will not load in any shaders unless they are
explicitly used in the scene. In my case I have two shaders,
one that does textures that are affected by lighting (for the
planets) and one that is unlit (for the stars) and I have
applied them to two very small cubes in the scene to force
them to become available so I can find them later in my code.
If you want to make use of other shaders you will need to do
something similar to force them into the scene. You could also
attach something to the wands, or have a cool logo at the
beginning that would serve the same purpose of forcing them to
load.
If you want to add in some fictional exoplanetary systems from
videogames, books, TV shows etc. as part of the additional
features then that is fine, as long as they are appropriately
labelled as fictional and they have to have some external
validity - i.e. they cant just be things you made up but need
to have some community validation on a publicly available
website / wiki / etc.
Again, note that there is a big difference between getting
something working and getting it working well. The first is
not that hard. The second takes much more time. You are
expected to have things working well. I highly recommend visualizing a variety of data
into your application quickly, beyond our solar system, to
start seeing the real issues you will be encountering in
creating a good interactive visualization environment.
Part of the work on this project is coming up with a nice format
for the data that you read in and getting the various exoplanet
data into that format. If you want, that part of the project can
be done collaboratively across groups. Once you read the data
into your application then your group is on its own. Turning in the
Project
The classroom VIVE PC will have a folder on the desktop named
491VRAR_Project 2. You should put a copy of your executable and
its associated data folder into a folder named after you, and
then put that folder into the 491VRAR_Project 2 folder..
You should create a set of public web pages (available to anyone
for at least the duration of the course) that describe your work
on the project. You can host your web pages at UIC (http://people.uic.edu) or the provider
of your choice, as long as they remain publicly available to
all. You can use any publicly available templates as long as you
cite them, or create your own.
These pages should include:
description of how to
use your application and the things you can do with it
a page on interesting
things you found using your application
links to all the source
code and any assets (models, textures) that you used along
with instructions on how to build your application on the
classroom PC
list of all the
different assets you used and citations for them
link to a zipped folder
containing your entire project which can be moved to the
class PC to be run
all of which should have plenty of screenshots with
meaningful captions. Web pages like this can be very helpful
later on in helping you build up a portfolio of your work when
you start looking for a job so please put some effort into it.
You should also create a 2-3 minute YouTube video showing the
use of your application including narration with decent audio
quality. That video should be in a very obvious place on your
main project web page. The easiest way to do this is to interact
with the video in the classroom or the EVL main lab in front of
the screen showing what you are seeing - this way people
watching can see you interacting and what you are seeing. You
can try to narrate while interacting but you will most likely
find its useful to do some editing afterwards to tighten the
video up.
The web page including screen snapshots and video need to be
done by the deadline so be sure to leave enough time to get that
work done. Once you have your webpage done, send the URL to Andy
before the deadline. I will respond to this email as your
'receipt'. I will be linking your web page to the course notes
so please send me a nice representative jpg or png image of your
application for the web. This should be named
p2.<your_last_name>.pg or p2.<your_last_name>.png
and be roughly 1024 x 768 in size. When the project is done, each person in a group
should also send Andy a private email with no one else CC'd
ranking your coworkers and yourself on the project on a scale
from 1 (low) to 5 (high) in terms of how good a coworker they
were on the project. If you never want to work with them
again, give them a 1. If this person would be a first choice
for a partner on a future project then give them a 5. If they
did what was expected but nothing particularly good or bad
then give them a 3. By default your score should be 3 unless
you have a particular reason to increase or decrease the
number. Please confine your responses to 1, 2, 3, 4, 5 and no
1/3ds or .5s please. Presenting the Project
An important part of creating VR applications is getting
feedback and using it to improve your design.
We will be spending time in class for each person to show off
their work.
Teams