Due:
9/23/03 at 2:00pm
You can find a shell of the program here and a simple Makefile here. If you want to get this to work on OS-X you will also need to either download the latest apple version of glut, or this resource file mac.r. If you want to get this to work in visual c++ then you should look here.
The shell contains the calls to the GLUT routines which deal with opening an appropriate graphics window, accepting keyboard commands, and setting up the appropriate display loops. The program shell initially opens a 2D orthographic projection double-buffered window that is 500 pixels wide by 500 pixels tall that can be resized. The 'logical' graphics area stretches from -200 to 200 in both directions. In this window there is a triangle that will bounce back and forth across the window, changing direction when it hits the side of the window, or when you press the spacebar.
For this assignment you are going to read in 2 datafiles that are specified on the command line. The first file draws the landscape. The second contains earthquake data downloaded from the internet.
The format of the lansdscape file is given next. The first line contains the text "Latitude,Longitude" and then the following lines contain a latitude and longitude pair. Connecting these points by lines will draw the outline of the landscape.
Latitude,Longitude
45, 142
43, 142
etc, etc, etc
The
format of the earthquake file is given next.
The first line contains the text "Year,Month,Day,Time(hhmmss.mm)UTC,Latitude,Longitude,Magnitude,Depth" and then the following lines contains the data itself. This file contains data on earthquakes using the Richter scale. I have ignored all quakes of magnitude less than 3 so make the data file a maneageable, but still interesting length. We will make use of the Year/Month/Day values, and the latitude/longitude values on this assignment. You can assume that any file we use will also contain quakes of magnitude 3 or higher. Note that since this is real data, sometimes there are values missing. You should disregard any line of data that has missing values. Note that we will make use of the depth value in assignment #2. If you are interested in more information about this data you can see the web page at http://wwwneic.cr.usgs.gov/neis/epic/epic_rect.html
Year,Month,Day,Time(hhmmss.mm)UTC,Latitude,Longitude,Magnitude,Depth
1973,01,05,053105.80, 33.47, 140.87,4.5, 56
1973,01,05,114837.50, 33.16, 140.91,3.9, 33
etc, etc, etc
The sample files provided here cover Japan from January1973 to August 2003.
Here is the earthquake file.
Here is the landscape file.
Since both files contain latitude and longitude values we will use these to set up the logical graphics area. For simplicity on assignment 1 we will assume that the area being visualized is in the northern hemisphere, and that the longitude values increase from West to East (ie we are east of Greenwich.) This still gives us 1/4 of the globe to play with, though we will relax this assumption in assignment 2.
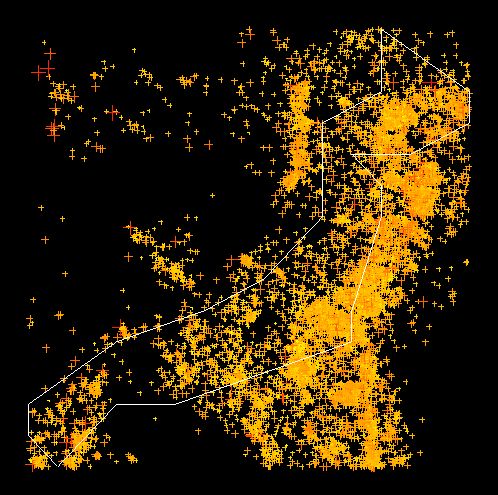
You should set up the logical graphics area so that the user can initially see all of the landcape plus a little extra space. The landscape should be drawn with white lines. You will probably find glBegin(GL_LINE_LOOP) useful here. The location of each earthquake in the file will be drawn with a '+' made out of two small lines. glBegin(GL_LINES) will be useful for this. The more intense the quake, the bigger the '+'. Magnitude 3 earthquakes will be drawn in yellow, magnitude 8 in red, with a smooth interpolation of those colours for the earthquakes in between.
Drawing all of the earthquakes and the terrain from the given sample files will look something like this:
Now we can add some user interaction.
Using the arrow keys (left, right, up, and down) the user should be able to move the lanscape and earthquakes within the window. This may mean that at times some or all of the landscape and earthquakes are not visible. Using the a and z keys the user can zoom in and out. This zooming should occur always from the center of the window, not the center of the landscape/earthquakes.
The user can use the 0, 3, 4, 5, 6, 7 keys to control which magnitudes are visible. If the user presses a number key then then all of the earthquakes at or above that magnitude will be shown. A textual display in the lower left corner will show which magnitudes are visiible.
Using the p key the the user can play back the earthquakes in time, starting back at the time of the first earthquake in the file, and finishing 1 minute later with the last earthquake in the file. The earthquakes displayed will have a window of one month - that is, once an earthquake becomes visible it will stay visible for 1 month of simulation time before disappearing.While doing this playback the current date (year, month, and day) should be displayed in the lower right hand corner. To make things a bit simpler you can treat leap years like non-leap years.While playing the user can take control and use the g and h keys to move time forward and backward interactively. The user can also use the number keys here to control which magnitudes are shown.
Using the o key the user can go back to showing all the earthquakes at once (with the number keys controlling which magnitudes are shown)
For all of the keys, the user should be able to use the lower case version or the upper case version (e.g. 'A' or 'a')
Your program should be well commented and be a good example of literate programming.
Your program will be submitted electronically. This will be discussed further in the discussion section. You can compile your program using the OpenGL libraries or any of the implementations of the Mesa libraries, and whatever platform you chose, but be sure that it compiles and runs as submitted on the linux machines in the CS lab because that is where we will be compiling and running your program.
The biggest problem you will encounter is the dreaded 'black screen' - its hard to debug graphics code when you can't see any graphics on the screen. The code to draw the triangle should help you over this hurdle, but I would first get the code to draw the outline of the terrain, then add in the earthquakes, and then the various ways to modify the view of the data. Hint, you should draw the landscape after drawing the earthquakes so the landscape is always visible.
I would also highly recommend that you understand the code you are writing - you never know when you might need to reproduce it (hint hint).
additional note (added 9/5/03): There are several ways of doing this assignment, including using functions that have not been introduced yet in the class, but since those funtions have not been introduced yet, you can't use them yet. Aside from what is given in the shell I believe the only other gl routines that you will need are glBegin(GL_LINE_LOOP); and glBegin(GL_LINES); Some functions that you can NOT use on this assignment include gluLookAt, glTranslate, glScale.