The first project is designed to get you used to working with vtk and the language and interface of your choice. You can use whatever language and interface set that you wish (Tcl, C++, java, python, etc) as long as it does what is needed and is easy for the user to use. It is highly unlikely that a text based interface will work so you should be using some widget set for the user interface. In the 2004 class people started with a wide variety of languages but eventually it came down to most people using c++.
In this first project we are going to look at 2D image datasets.
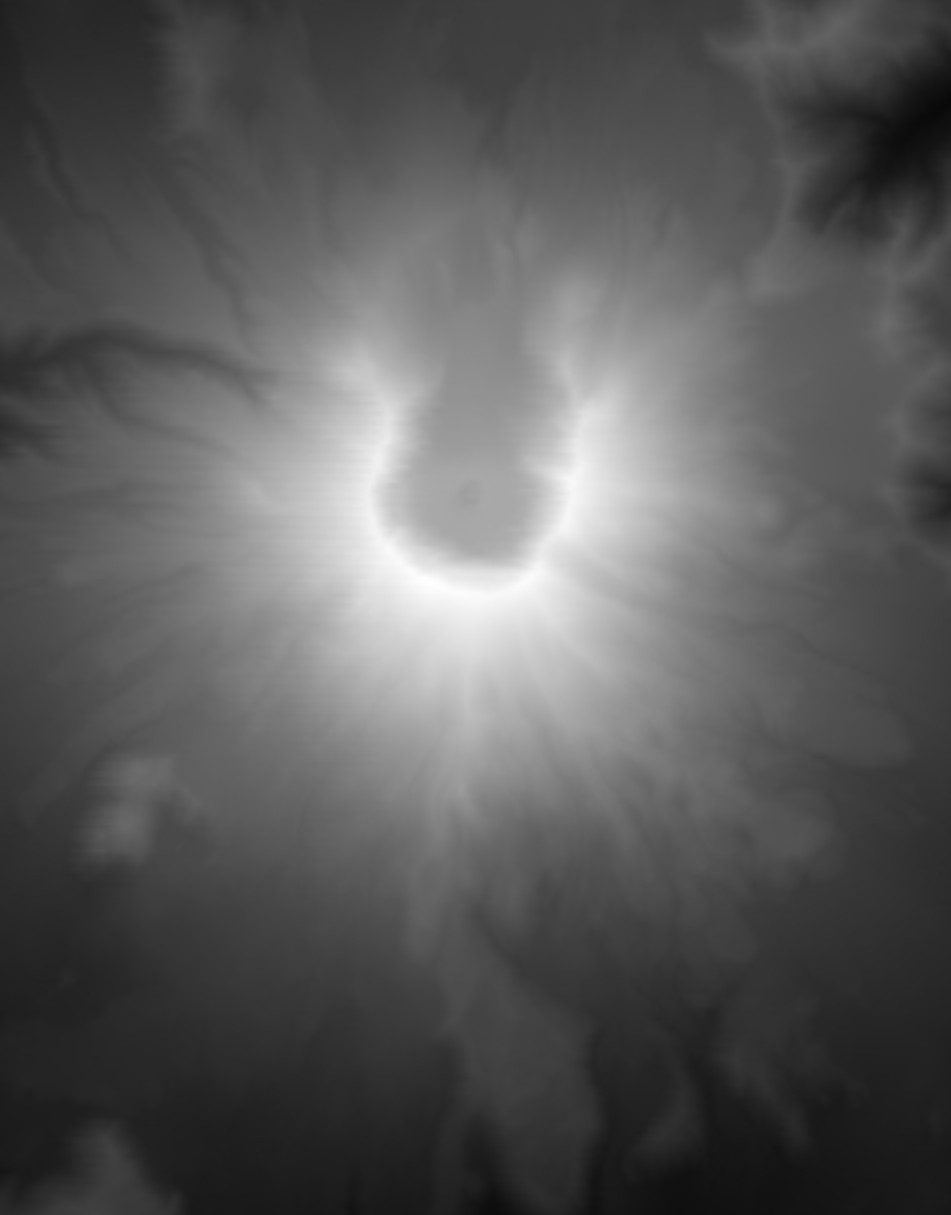
The main part of the assignment involves taking the following dataset for crater lake and visualizing it in several different ways.
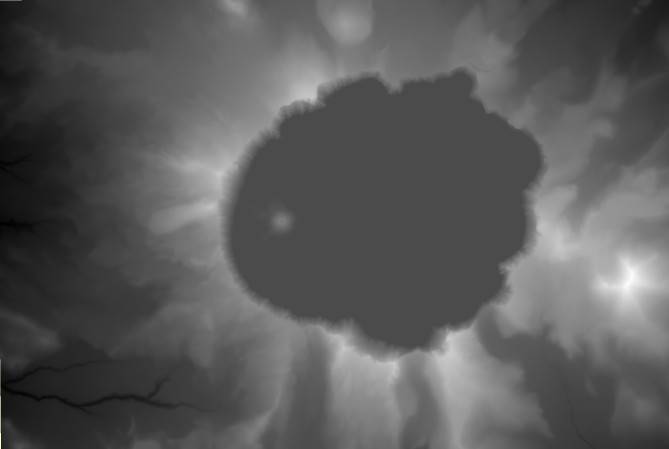
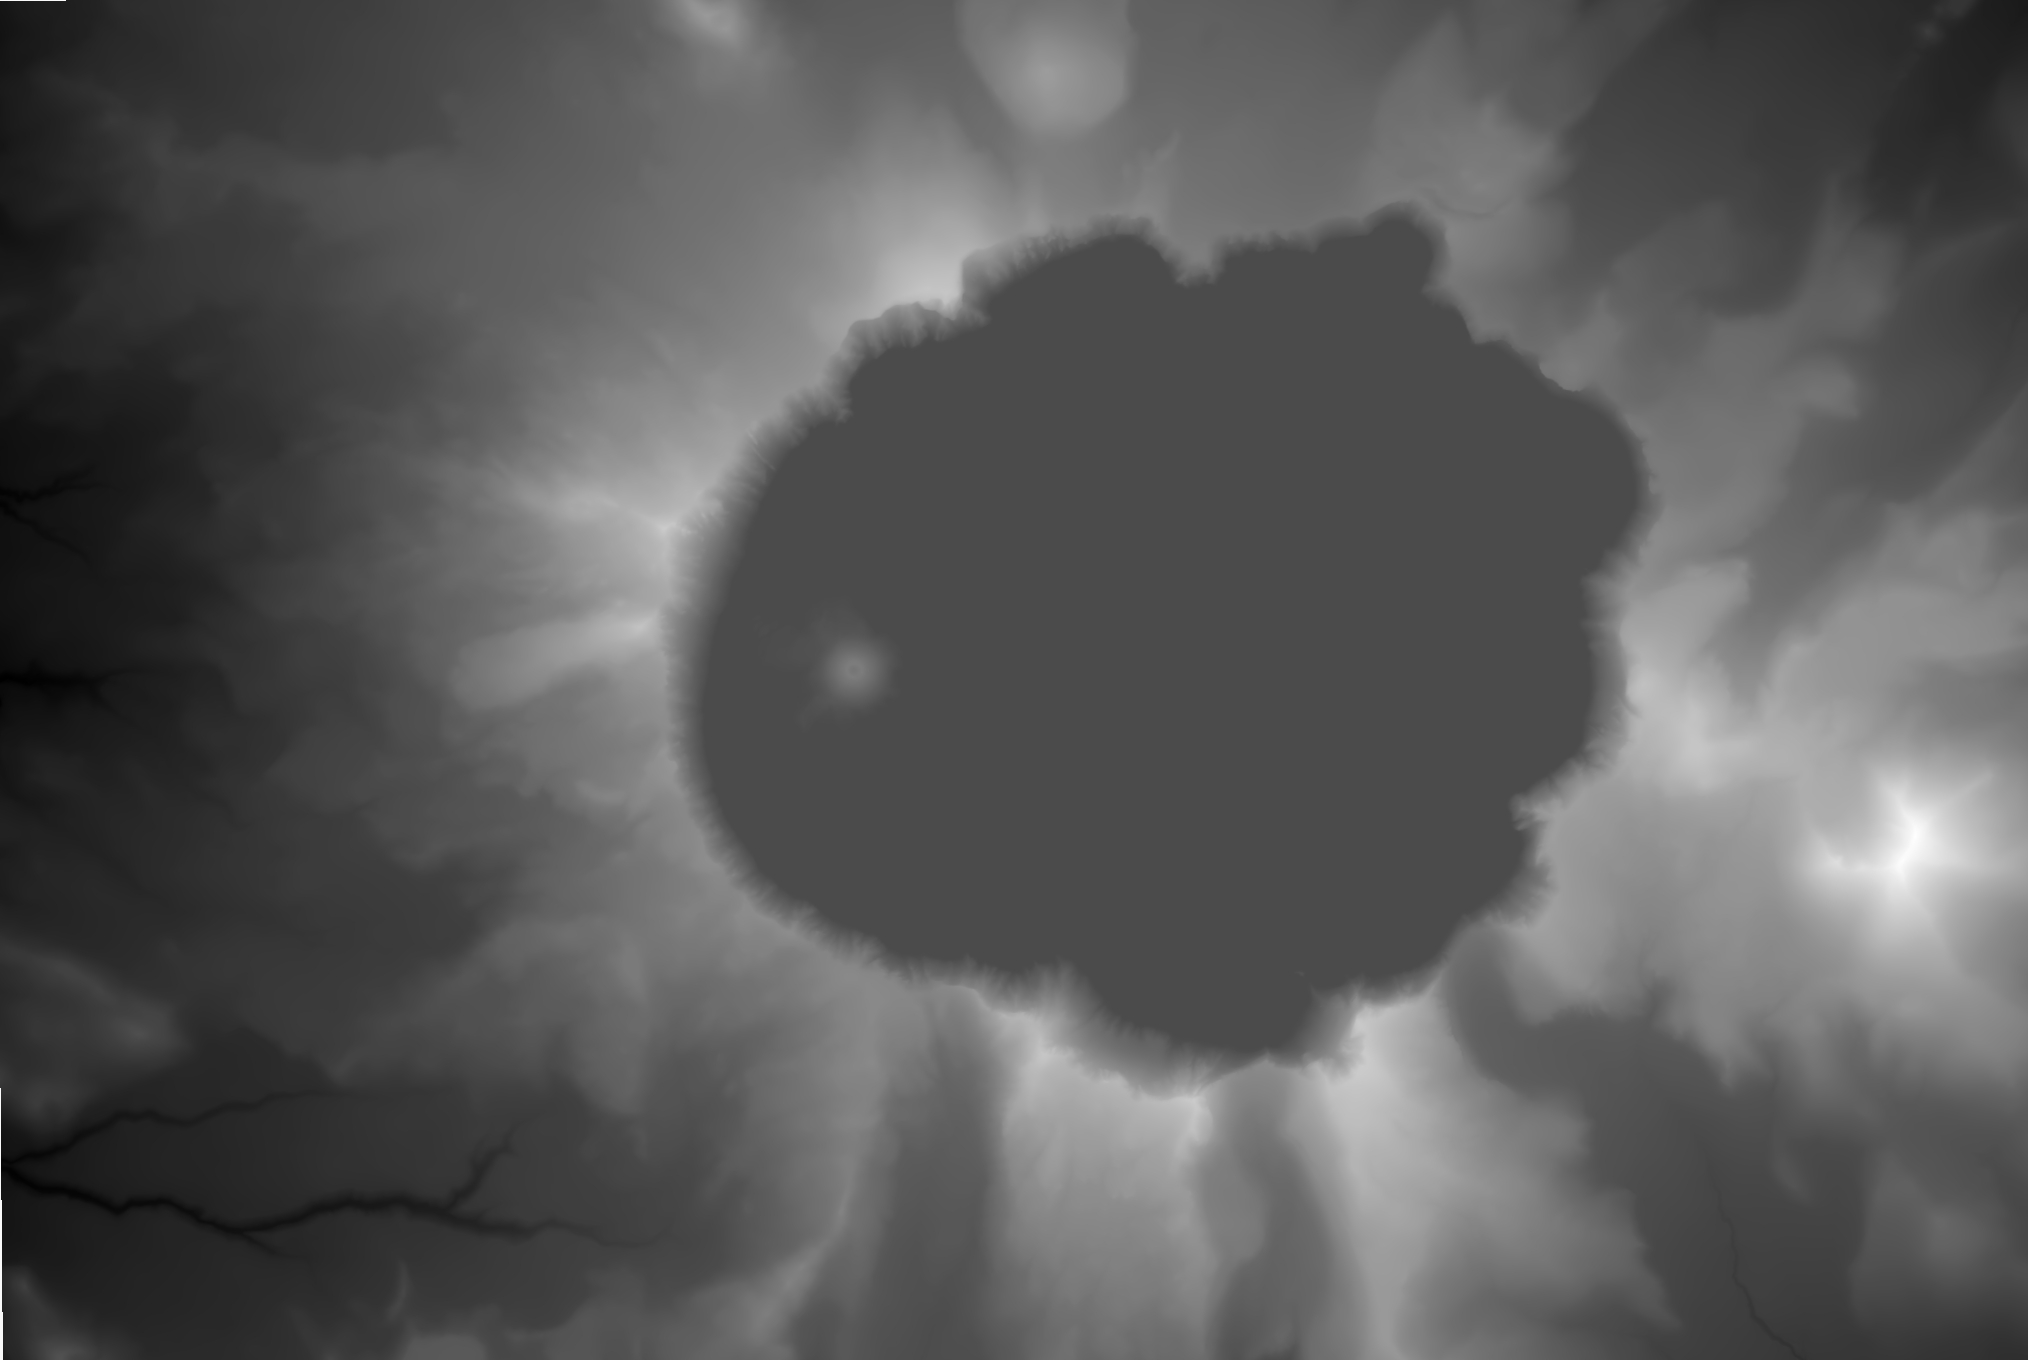
small version of elevation data in jpg format - dark is low and bright is high. The minimum elevation shown is 5009 feet and the highest elevation is 8930 feet.
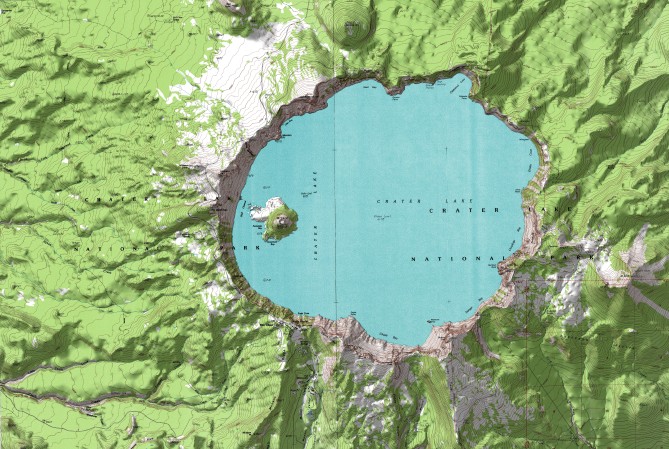
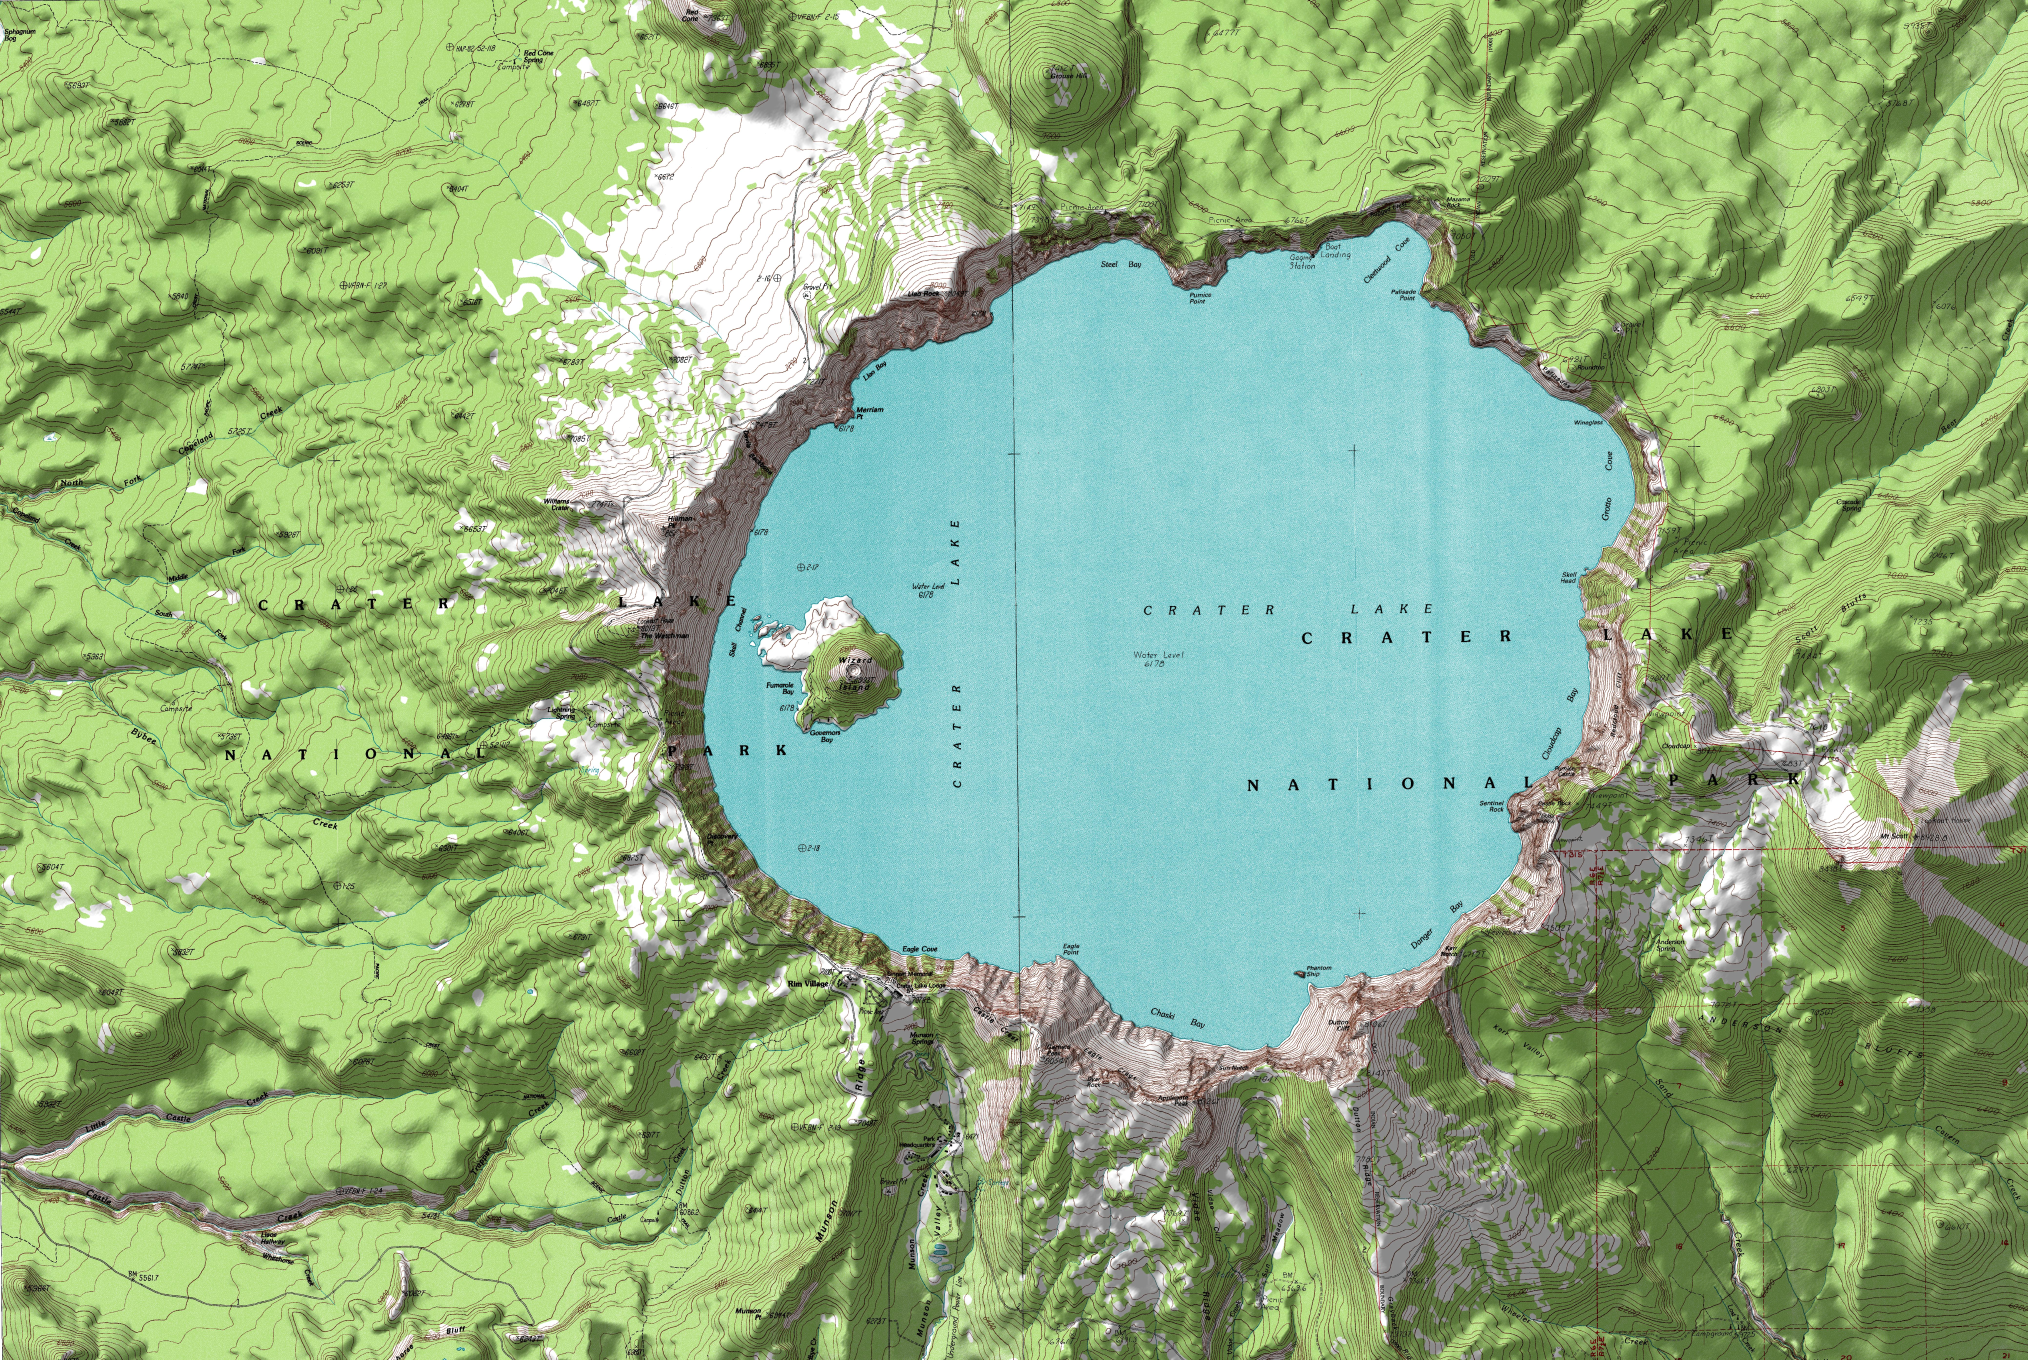
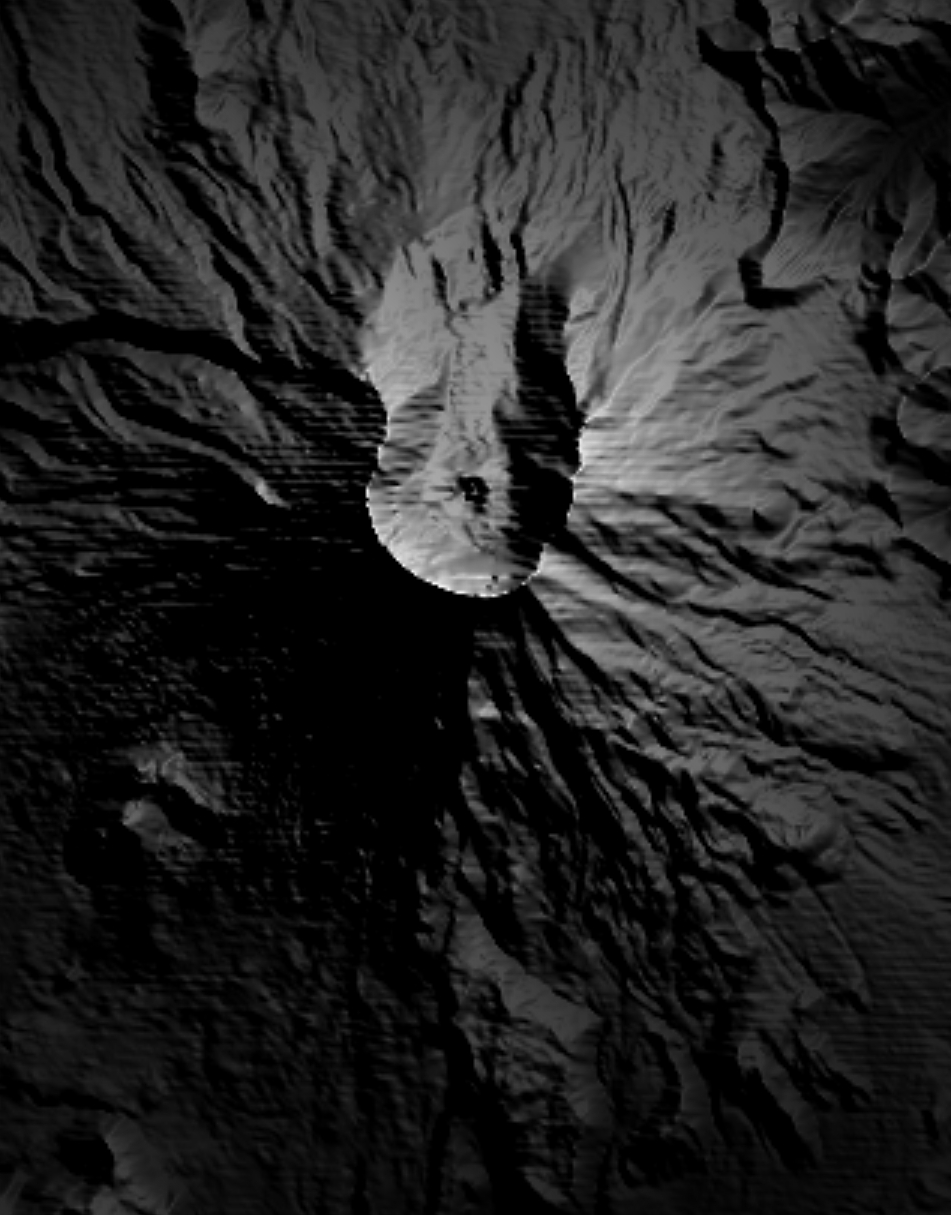
small version of texture data in jpg format
The data is given here in jpeg mode so you can see it easily. I have also included a png version of each file below. These are nice to read into paraview to get an idea what the data looks like once its transformed.
crater10.100.png contains the elevation data where each pixel represents a 10meter square patch of ground.
Crater_Lake_50.png contains the texture map at 50% of its original size.
Your program should bring up a large window showing the current visualization as well as a control panel allowing the user to change that visualization. Each time a parameter is changed the visualization should automatically redraw. The user should also be able to rotate the current visualization using the mouse in the visualization window.
The different visualization styles are:
The first style is a height field. The height field will allow the user to see this landscape in 3D (like it is in real life) and the user should be able set the amount of elevation scaling (from the height field being flat to an exaggerated elevation) with a slider.
The user should also be able to choose between several views of the height field itself:
The second style is contour lines. The contour lines will allow the user to see this data as a set of 4 2D contours in the 3D space - that is the 4 contour lines should not be in the same plane - they should have the appropriate elevation. The user should be able to independantly set four contour values (elevations) each with a different colour (red, blue, green, yellow). The user should set each of these contour values with a slider - ie the red contour has its own slider, the green contour has its own slider, etc. The sliders should limit the user to the range of data in the data file.
Once you have vtk installed, which can take some time depending on your platform, I would suggest the next thing you try is to install paraview from www.paraview.org. This application, built on top of vtk, allows you to interactively try out a bunch of the filters vtk makes available.
In this case you can read in the crater10.100.png file, then tetrahedralize it, then do a warp (scalar) on the tetrahedralized version and you get the landscape in 3D.
Having only one dataseet is kind of boring, so your program should allow the user to flip between the crater lake dataset and the dataset below for Mt. St. Helens after its 1980 eruption.
helens10.100.png contains the elevation data where each pixel represents a 10meter square patch of ground.
helens10.100shaded.png contains the texture map at 50% of its original size.
The data in the image files ranges from 0 to 255 (which is really low-resolution compared to the instruments available today, but its only the first assignment) so the user will need some way to input the correct minimum and maximum elevation values. This will also allow the user to choose either feet or meters or whatever units they prefer.
You may also want to experiment and add some other _useful_ features of your own for some extra points. Be sure to document these useful features.
To submit your project you should create a public webpage that has several snapshots that show that your project works. These snapshots should have captions that explain clearly what is shown in each. The web page should also have links to all of the various source files that you used to complete the project (.tcl, .cxx, whatever.) This html file also works as your 'readme' file so be sure that it tells me everthing you think I need to know about your project. You can then email me the address of this webpage.
If you can't create a public webpage then you can send me email containing the various source files and images. Note that if you are an outlook user, please make sure your email attachments are readable by non-outlook users.
The deadline is 5pm on the due date.
You will also be giving a short 10 minute presentation on your work in class which should highlight what you did and how you did it. You are _highly_ encouraged to demonstrate the various important aspects of your program(s). The schedule for these presentations will be on the schedule page.
You may notice some errors in 2 of the corners of the crater lake elevation dataset. This is a pretty common occurence with real datasets and in this case it doesnt hurt the visualization much. It would be nice if you could come up with a solution for this within vtk; modifying the input image is a solution, but not one that is very scalable when you have lots of data.
You may also need to resize or reformat the texture map. That is OK, but you should not reformat the elevation data without asking first.