Lecture
1
Intoduction
to
the
Course
Information
about
the
Course
-
Syllabus,
presentations,
projects
etc.
How
this
class
relates
to
to
other
similar
/ related CS courses
CS 422
|
User Interface
Design |
developing
effective
user
interfaces
|
Every spring
|
CS 424
|
Visualization
& Visual
Analytics
|
interactive 2D
visualization of different types of data
|
Every fall
|
CS 426
|
Video Game
Programming |
creating
complete
audio visual
interactive (and fun) experiences |
Every spring
|
CS 488
|
Computer
Graphics I |
basics of how
computers create
images on screens, OpenGL |
Every fall
|
CS 522
|
Human Computer
Interaction |
interaction and
evaluation of interactive environments |
Every 2 years
|
CS 523
|
Multi-Media
Systems |
creation of
Educational Worlds |
Every 2 years |
CS 524
|
Visualization &
Visual
Analytics II
|
3D Visualization |
Every 2 years |
CS 525
|
GPU Programming |
shaders and
parallel
processing |
Every 2 years |
CS 526
|
Computer
Graphics II |
current topics
in computer graphics
|
Every 2 years |
CS 527
|
Computer
Animation |
creating
realistic
motion |
Every 2 years |
CS 528
|
Virtual Reality |
immersion
|
Every 2 years |
In CS 424 the
projects focused on creating 2D interactive visualizations in processing - here
the projects will focus on creating 3D interactive visualizations using
the vtk library with c++ (or java or python).
Where
CS
424
focused
more
on
the basics of creating interactive
visualizations, we will be sopending more time talking about current
research in the area with presentations of current research papers to
see where the field is headed next.
Scientific
Visualization
Webster
defines
Visualization
as:
- formation
of mental visual images
- the act
or process of interpreting in visual terms or of putting into visible
form
What
are
the
advantages?
(adapted
from
[Ware
2000])
- ability
to comprehend vast amounts of data
- allows
the perception of unanticipated emergent features
- problems
with the data itself can often be quickly recognized
- helps to
see both large-scale and small-scale features of the data
- facilitates
hypothosis
formation
How
do
we
make
good
visualizations?
(adapted
from
[Tufte 1983])
- show the
data
- allow the
viewer to focus on the substance rather than the methodology, graphic
design, technology of the production, etc.
- avoid
distoring what the data
- present
many numbers in a small space
- make
large datasets coherent
- encourage
the eye to compare different pieces of data
- reveal
the data at several levels of detail, from a broad overview to the fine
structure
- serve a
clear purpose: description, exploration, tabulation, or decoration
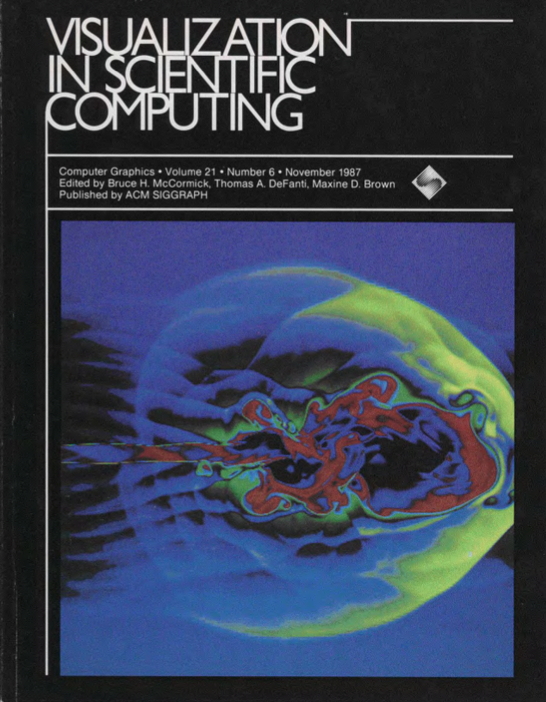
Back in 1987 the
field of scientific computing was organized through the Workshop on
Visualization in Scientific Computing, held February 9-10, 1987 in
Washington DC, and then disseminated through the report from that
workshop - 1987's Visualization
in Scientific Computing.
available in pdf
format here
Today this
workshop report still provides a good overview of the field, and
looking back at the predictions made over 20 years ago should
give you a
better idea about the predictions made a few years ago in the reports
we will be looking at next.
But first, a
quick primer on 1987:
A typical
desktop computer had:
- 10 mhz CPU
- 512 Kilobytes RAM
- 640 x 480 displays
- 800 Kilobyte floppy drives for storage
- first 'laptops' were coming out and hard drives started to become
available
a Supercomputer
like the Cray-2 from 1985 with 4-8 processors, 2 to 40
gigabytes of disk storage, and 512MB to 4 gigabytes of RAM could do 500
Megaflops per CPU (millions of floating point operations per second)
and cost roughly $15,000,000. 27 were sold.
Today's CPUs can
do 100 gigaflops and GPUs can go to 500 Gigaflops to
1000 Gigaflops and supercomputers are reaching 2 petaflops (2,000,000
Gigaflops) ... so our desktop machines are 25 to 250 times faster than
the supercomputers of the time, and our supercomputers are 500,000
times faster than the supercomputers of the times.
There was no
public internet, but we had 1200 bits/sec modems to call bulletin
board systems, or CompouServe, or log into mainframe computers over the
phone lines, but those 'on-line' services were not connected to each
other.
Software was
distributed on floppy discs or CD-ROMs (680 megabytes). Internal hard
drives could hold 20-40 megabytes.
Most music was
being bought on casette for people to play on their Sony
Walkmans. LP records had almost disappeared but CDs were only a couple
years old and starting to catch on.
NES was the main
videogame console (2 Mhz CPU, 2 kilobytes of ram, but
game 'lived' on the 16K cartridge)
Now back to the
report.
Visualization is
a method of computing. It transforms the symbolic into the geometric,
enabling researchers to observe their simulations and computations.
Visualization offers a method for seeing the unseen. It enriches the
process of scientific discovery and fosters profound and unexpected
insights. In many fields it is already revolutionizing the way
scientists do science.
Visualization
embraces both image understanding and image synthesis. It studies those
mechanisms in humans and computers which allow
them in concert to perceive, use and communicate visual
information
Visualization unifies the largely independent but convergent fields of:
- Computer graphics
- Image processing
- Computer vision
- Computer-aided design
- Signal processing
- User interface studies
Richard Hamming
observed many years ago that "The purpose of computing is
insight, not numbers." The goal of visualization is to leverage
existing
scientific methods by providing new scientific insight through visual
methods.
An estimated
33-50%
of the brain's neurons are associated with vision.
Visualization in scientific computing aims to put that neurological
machinery to work.
Today's data
sources are such fire hoses of information that all we can do is gather
and warehouse the numbers they generate.
High-volume data sources
include:
- Supercornputers
- Orbiting satellites returning earth resource, military
intelligence, weather and astronomical data
- Spacecraft sending planetary and interplanetary data
- Earth-bound radio astronomy arrays
- Instrumental arrays recording geophysical entities
- Medical scanners
There
is
every
indication
that
the
number of sources will multiply, as will
the data density of these sources.
Scientists involved in the computational sciences require these data
sources in order to conduct significant research. They are
deluged by the flood of data generated. Using an exclusively numerical
format, the human brain cannot interpret gigabytes of data each day, so
much information now goes to waste.
Scientists need improved visual interaction
- With their data
- With each other
Scientists not only
want to analyze data that results from super-computations; they also
want to interpret what is happening to the data during
super-computations. Researchers want to steer calculations in
close-to-real-time; they want to be able to change parameters,
resolution or representation, and see the effects. They want to drive
the scientific discovery process; they want to interact with their data.
The most common
mode of visualization today at national supercomputer centers is
batch. Batch processing defines a sequential process:
- compute
- generate
images and plots
- record on
paper, videotape, or film
On the other
hand, immediate visual
feedback can help researchers gain insight into scientific processes
and anomalies, and can help them discover computational errors.
The application
of visualization to scientific computing will undoubtedly face a type
of cultural inertia well exhibited by the pre-computer history of
visual technology. Over the past 100 years, each newly developed
visual medium first mimicked the old.
- Still
cameras were first used to
replace landscape and portrait artists.
- Movies
first captured theater
from fifth row center; it took 20 years to discover the vocabulary to
move a camera around.
- Television
neatly adopted the style and content
of film; only now are its real-time and interactive capabilities being
developed, as in the use of instant replays and graphic overlays.
- Visualization,
the
new
interactive
visual medium, has great potential
for new modes of use beyond its origins in rotating logos for
television.
Most people see
the end result of visualization — reproduced still color photographs or
movies. With the exception of flight simulator trainees and video game
players, all those not actually in the process of producing
visualization see it as one-way and non-interactive. One cannot publish
interactive systems in a journal.
The process of
scientific discovery is essentially one of error recovery and
consequent insight. The most
exciting potential of wide-spread
availability of visualization tools is not the entrancing movies
produced, but the insight gained and the mistakes understood by
spotting visual anomalies while computing. Visualization will
put the
scientist into the computing loop and change the way science is done.
Scientists need
an alternative to numbers. A technical reality today and a cognitive
imperative tomorrow is the use of images. The ability of scientists to
visualize complex computations and simulations is absolutely essential
to insure the integrity of analyses, to provoke insights and to
communicate those insights with others.
So far, however,
scientists and academics have been largely untouched by this revolution
in computing. Secretaries who prepare manuscripts for scientists have
better interactive control and visual feedback with their word
processors than scientists have over large computing resources which
cost several thousand times as much.
Traditionally,
scientific problems that required large-scale computing resources
needed all the available computational power to perform the analyses or
simulations. The ability to visualize results or guide the calculations
themselves requires substantially more computing power. Where will this
power come from?
Workstations,
minicomputers and image computers are significantly more powerful and
effective visualization tools than supercomputers. It is a waste of
supercomputer cycles to use them to convert model data into new
pictures. Specialized graphics processors are more cost-effective than
supercomputers for specialized picture processing and/or generation.
Workstations should be placed
on the desks of each and every researcher
to give them immediate access to local graphics capabilities. Every
scientist and engineer should have a personal workstation.
Every research
center should provide on-site
capabilities and facilities for high-end visualization. Visualization
equipment and projects should be considered in competition with
more memory, more disks, more networking, and soon, to provide a
balanced response to user needs.
To encourage the
development of visualization tools for scientific and engineering
research, interactions must be fostered between scientists, engineers
and visualization experts. These interdisciplinary groups should be
expected to develop, document, use, and publish both (1) useful results
in their discipline, and (2) effective visualization software and
documentation. Scientists and engineers need to rely on the experience
and intuition of visualization experts to anticipate which
representations best convey the information distilled from a cascade of
numbers from a supercomputer; the visualization experts need to rely on
scientists and engineers to point out the crucial information which
flows from the underlying science of a problem.
We
encourage the support of interdisciplinary research teams, rather than
just facilities, to ensure that long-term visualization
developments be
grounded in real problems. Close interaction between scientific
investigators and visualization technologists will foster better
communication between researcher and computer, and between researcher
and researcher. The resulting effective and reusable tools can
then be
shared with scientists and engineers in other research areas, and
within the research community at large.
It is expected
that all teams engaged in visualization in scientific computing have a
mix of skills, and that the development of the tools and
techniques of
visualization will be an iterative process with different skills
contributing at different stages Here is a list of team members
and their associated skills.
Visualization
and
Interdisciplinary
Teams
- Computational
scientists and engineers conduct research in one of the
discipline
sciences (molecular modeling, medical imaging, brain structure and
function, geosciences, space exploration, and so forth) or engineering
(computational fluid dynamics, finite element analysis, and so forth).
Given visualization tools, these researchers are responsible for making
advances in their areas of expertise.
- Visualization
scientists and engineers are
involved
with
the
development of
visualization software, hardware, networks, languages, operating
systems and databases. These technologists are developing tools and
techniques that have broad applicability to advanced scientific and
engineering research.
- Systems support
personnel understand computer networks, operating systems,
programming
environments on supercomputers, workstation hardware and
software, and device drivers. They integrate systems and new
technologies, and configure and maintain visualization facilities
for the computational scientist.
- Artists
have a
formal education in visual communication, including an understanding of
color theory, composition, lighting, view angles and related
aesthetics. They propose effective visual representations for analysis
and communication.
- Cognitive
scientists, particularly those with formal training in
psychology, have
experience in human / computer interfaces and visual perception. At the
level of basic research, their theories point the field in new
conceptual directions. At the task level, they might work with
scientists and technologists to develop better user interfaces; for
example, they might select input devices or design window management
systems.
Visualization
Benefits
Scientific
breakthroughs depend on insight. In our collective experience, better
visualization of a problem leads to a better understanding of the
underlying science, and often to an appreciation of something
profoundly new and unexpected.
Better
visualization tools would enhance human productivity and improve
hardware efficiency. We believe advanced capabilities for visualization
may prove to be as critical as the existence of supercomputers
themselves for scientists and engineers.
If properly
designed and structured, tools and interfaces developed for one
discipline science or engineering application would be portable to
other projects
in other areas.
Long Term Goals
In the 1980's, visualization communication in the United States is
hobbled by lack of standards, mired in the intellectual frustration of
making interconnections across incompatible media, and held up a
the gateways by disparate transmission protocols never designed with
visualization in mind. Visual communication cannot be shared among
users across a distributed network of incompatible workstations with
idiosyncratic user interfaces and no common layering of portable
software or hardware.
Scientific communication is changing. Traditionally scientific
publication has meant English language print, line drawings and a few
static images. Increasingly, science cannot be done in print; in fact,
essentially all of the visualization research opportunities described
in this report require visualization networking and visualization -
compatible electronic media for publication.
Needs for
visualization-enhanced
scientific communication in a number of areas:
- Visual
publication
- Human /
computer
interfaces
- Televisualization
- Visualization
software
and
hardware
- Standards
- Education
Visual
Publication:
Contemporary
scientific communications media are predominantly language-oriented.
Printed media are coupled weakly, if at all, to the visual world of
space-time. By contrast, half the human neocortex is devoted to visual
information processing. In other words, current scientific
communication leaves out half — the right half — of the brain. An
integral part of our visualization task is to facilitate visual
communication from scientist to scientist, from engineer to engineer,
through the intermediary of visualization-compatible communications
media.
While
interaction today describes the scientist's potential to direct his
computation and synthesize new insights dynamically, interaction has a
social meaning as well. "Do you see what I see?" one researcher asks
another. In this way, hypotheses can be tested and validated or
falsified in minutes instead of years. Changing the scale and
pace of
visualization alone would affect research profoundly. But we can
predict with certainty that such changes in modality will also lead to
immense conceptual advances as well.
Scientific
research requiring computationally intensive visualization is in danger
of becoming Babelized and thereby incommunicable. Much of modern
scientific research cannot be expressed in print — DNA sequences,
molecular models, medical imaging scans, brain maps, simulated flights
through a terrain, simulations of fluid flow, and so on. If poorly
communicated, such research cannot stimulate new discoveries and new
disciplines.
The end results
of selected visualization — photographs, films and videotapes - are
what most people see With the exception of flight simulator
trainees
and video game players, all visualization seen by those not involved in
producing it is one-way it is non-interactive. A scientist cannot
publish "interaction" in a journal.
Electronic
media, such as videotapes, laser disks, optical disks and floppy disks,
are now necessary for the publication and dissemination of mathematical
models, processing algorithms, computer programs , experimental data
and scientific simulations The reviewer and the reader will need
to test models, evaluate algorithms and execute programs themselves,
interactively, without an author's assistance. Scientific publication
needs to be extended to make use of visualization-compatible media.
Reading and
writing were only democratized in the past 100 years, and are the
accepted communication tools for scientists and engineers today. A new
communication tool, visualization, in time will also be democratized
and embraced by the great researchers of the future.
Communications
Media
|
Number
of
Years
Old
|
Sight
|
500,000,000
|
Speech
|
500,000
|
Writing
|
5,000
|
Print
Broadcasting
|
500
|
Visual
Broadcasting
|
50
|
Visualization
|
5
|
The introduction of
visualization technology will profoundly transform the way science is
communicated and will facilitate the commission of large-scale
engineering projects. Visualization
and
science
go hand in hand as
partners. No one ever expected Gutenberg to be Shakespeare as well.
Perhaps we will not have to wait 150 years this time for the
geniuses
to catch up to the technology.
Human/Computer
Interaction
Scientists in
computing environments need to adopt a new mode of human/computer
interaction:
- Rapid
prototyping - When testing
different approaches to human/computer interaction, numerous
experiments with short turn-around times like this are appropriate to
explore the possibilities. Inflexible environments discourage
interesting exploration.
- Graphical
monitoring - High resolution,
multi-window, multi-process displays can be easily used to monitor the
progress of a program by showing pictorial data in various windows.
This technique permits the scientist to monitor simultaneous events in
real time, find incorrect or misunderstood behaviors, and correct them.
- Layered
abstractions - The use of languages
that accept user-supplied macros and permit the hiding of data and
program details are essential aspects of modern programming methods.
These capabilities support th eextension of a language to handle new
application requirements without changing the basic environment.
Scientific
Understanding
The field of
visualization requires a new formulation of the problems of
transforming symbolic and numerical descriptions into graphic
renderings and simulated behaviors. What if the symbols and simulated
behaviors are in the minds of scientists? How can the computer get
high-level access to the mental imagery of what the researcher wants
to express? New concepts are required that define human capabilities
for analogical and metaphorical visualization, transformations of
visually representable concepts, and generation of intuitive
understandings that lead to conceptual scientific breakthroughs.
Concurrent
processing
of
symbolic
information
and visual imagery
Many modes of
thought require concurrent processing of symbolic information and
visual imagery. For example, when we read a textual description,
perhaps of a room in a mountain inn, we can often visualize the scene.
Textbooks provide both text and supporting illustrations, enabling us
to reference either or both for better comprehension.
Knowledge-based
systems, however, do not currently have this capability. The concurrent
processing of verbal and visual information will be of critical
importance if computer-based intelligent systems are to capture any
significant portion of the world's knowledge as archived in published
literature.
Televisualization
The sheer scale
of graphics and image data sets challenges the current bandwidth and
interactivity of networks.
The application
of networks to visualization is termed televisualization.
Televisualization requires a major enhancement over existing network
capabilities in the following areas:
Visualization
Software
and
Hardware
A major problem
to be solved as we enter the 1990's is the need for portable, robust,
useful visualization software. Currently there is no standard set of
visualization tools and graphics interface conventions appropriate for
complex tasks, the definition of which is an open research problem.
Over the next 2-5
years, highly parallel architectures will evolve to the point where
image computers will be able to approach speeds offering real-time
interaction.
Standards
We believe that it is too early in the life of the visualization
discipline to impose standards, but we can recommend categories of
visualization which should be standardized in order for tool makers and
tool users
to move forward on a national scale.
Most research
centers have disregarded thes e standards as being too restrictive or
old -fashioned
to
consider.
Consequently,
there
currently exist an abundance of
graphics
packages which are only standard where they were written.
High-bandwidth
networks will require new, visualization-capable, networking protocols.
These still have not been proposed.
Education
Visual training,
if any, is left to the commercial television and entertainment
industries. Our culture is simply reluctant to accept, much less favor,
any level of non-verbal communication in science. Our culture talks of
the insight necessary for science, but only favor s that form of seeing
which can be reduced to typed symbols an d statistics.
Today's academic
and scientific reward systems overwhelmingly favor those who manipulate
numbers and symbols. We have used computers to replace much
phenomenological observation and rely mainly on symbol processing to
gain insight. We trust numbers and symbols; they are easy to compare
and publish. Academia has an enormous installed base of numerical data
acquisition and analysis machinery, word processing and printing
technology - all in support of getting science in print. Publishing
and grants, and therefore tenure, have rarely come t o those whose
productivity depends upon or produces visualization results.
Coming
Next
Time
Visualization
Basics
You
should start taking a look at vtk by going to www.vtk.org and download the latest
release (currenty 5.6.1) along with the examples.
Another
very nice piece of software built on top of vtk is ParaView www.paraview.org (currently 3.8.1)
which acts like a front end to vtk and encourages
you to read in datasets and apply filters and generate visualizations.
I would suggest downloading paraview and start playing with it.
last
revision
1/3/11