Lecture
5
Fundamental
Algorithms
(1
of
2)
(includes text and images from the 3rd edition of the VTK
book)
Cells
specify
topology
while
points
specify
geometry
Types
of
Datasets
(each
of
these
has
their
own
class
in
vtk) - a dataset has an organizing structure and a
set of associated attribute data
Project
1
will
start
out
with unstructured points and Project 2 will start out
with image data, though in both cases the data may go through several
forms depending on how it will be eventually be visualized
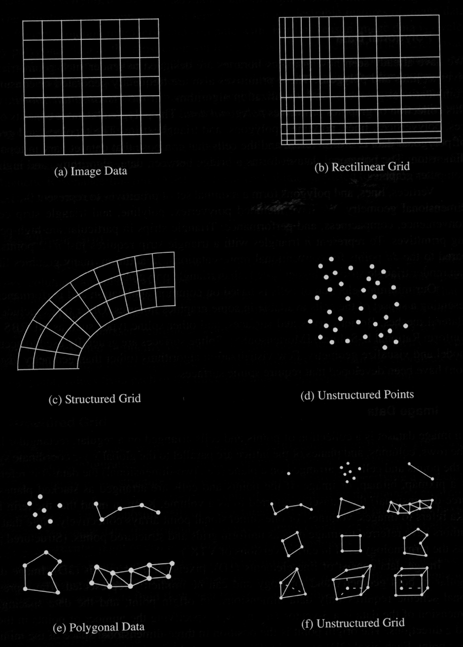
- image
data - vtkImageData - points and cells on a regular rectangular lattice
- if points
and cells are arranged on a plane -> pixmap / bitmap / image
- if
arranged as stacked planes -> volume
- regular
(structured) geometry and topology
- rectilinear
grid
-
vtkRectilinearGrid
-
points
and
cells
on
a
regular
lattice
- rows,
columns, planes are parallel to x-y-z coordinate system
- regular
topology, geometry only partially regular (spacing between points may
vary)
- structured
grid-
vtkStructuredGrid
- regular
topology, irregular geometry
- warped
into any configuration w/o overlap or intersection
- topology
stored implicitely
- geometry
explicitely represented by array of point coordinates
- cells are
quadrilaterals (2D) or hexahedron (3D)
- useful
for finite difference computions - fluid flow, heat transfer,
combustion
- unstructured
points
-
vtkPolyData
or
vtkUnstructuredGrid
-
points
irregularly
located
in
space
- no
topology, completely unstructured geometry
- typically
converted to a more structured form for visualization
- polygonal
data - vtkPolyData
- unstructured
topology
and
geometry
- collection
of
graphics
primitives
(vertices,
lines,
polygons,
triangle
strips,
etc)
- unstructured
grid-
vtkUnstructuredGrid
- most
general
- completely
unstructured
topology
and
geometry
- requires
most memory and processing
- used in
structural design, vibration, dynamics, heat transfer
Cell
- type plus
connectivity list (ordered list of point IDs) implicitely defines the
topology
Linear
Cells
-
linear
or
constant
interpolation
functions
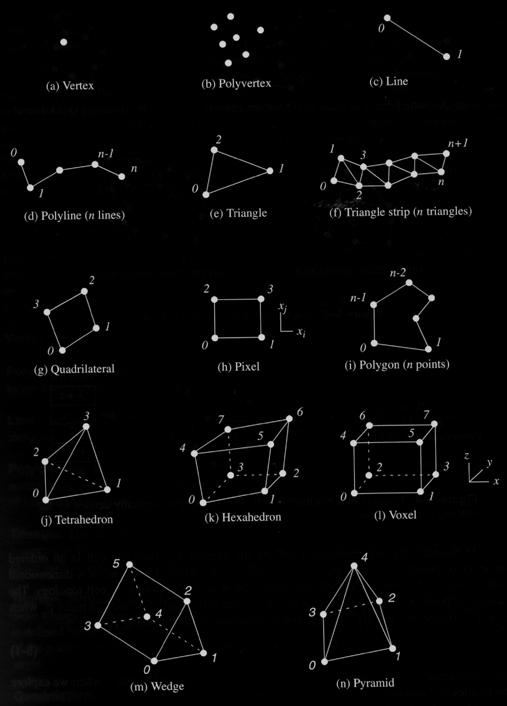
eg
for
the
Hexahedron
we
can declare a cell to be a hexahedron and then
give the connectivity list of point IDs (0, 1, 2, 3, 4, 5, 6, 7) where
the point IDs in the connectivity list index into a (potentailly much
larger) point coordinate list of x,y,z point locations. We know
implicitely that 0,1 is one of the 12 edges and 0, 1, 2, 3 is one of
the six faces.
- vertex -
0D cell
- polyvertex
-
composite
0-dimensional
cell
- arbitrary
ordered list of points
- line- 1D
cell
- 2 points
- direction is from first to second
- polyline
- composite 1-dimensional cell
- one or
more connected lines, from point i to i+1
- triangle
- 2D cell
- counter-clockwise
ordering
of
3
points
- triangle
strip - composite 2-dimensional cell
- one or
more triangles, (i, i+1, i+2) defines a triangle strip
- points
need not lie in a plane
- quadrilateral
-
2D
cell
- ordered
list of 4 points in a plane,
- counter-clockwise
ordering,
convex,
edges
do
not
intersect
- pixel* -
2D cell
- special
case of quadrilateral
- ordered
list of 4 points in a plane
- each edge
is parallel to one of the 3 coordinate axis (x, y, z)
- each edge
perpendicular to its adjacent ones
- normal is
parallel to one of the 3 coordinate
axis
(x,
y,
z)
- points
ordered in direction of increasing axis coordinate
- note how
this is not the same as a pixel on the screen
- polygon -
2D cell
- ordered
list of 3+ points lying in a plane
- counter-clockwise
ordering
- may be
concave, but not intersecting
- tetrahedron
-
3D
cell
- 6 edges
and 4 triangular faces defined by 4 non-planar points
- hexahedron
-
3D
cell
- 12 edges
and 6 quadrilateral faces defined by 8 vertices, convex
- voxel* -
3D cell
- special
case of hexahedron
- 12 edges
and 6 quadrilateral faces defined by 8 vertices, convex
- each face
is perpendicular to one of the axis
- point
list ordered in direction of increasing coordinate value
- 8
'traditional' voxels form the corners of this kind of voxel
- wedge -
3D cell
- 3
quadrilateral faces and 2 triangular and 9 edges defined by 6 vertices
- must be
convex, faces and edges must not intersect
- ordered
list of 6 vertices
- pyramid -
3D cell
- 1
quadrilateral face and 4 triangular faces and 8 edges defined by 5
vertices
- 4 points
defining base must be convex, apex not coplanar w/ base
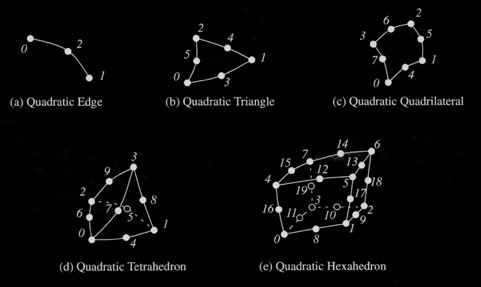
Nonlinear
Cells
more
accurate
rate
interpolation
functions
model curved geometry better
linear
cells
are
easily
converted
to
linear
graphics
primitives.
nonlinear
cells
(except maybe
for NURBS) must first be converted (tesselated) into linear form
- quadratic
edge - 3 points - 2 points at endpoints, 1 in middle of edge
- quadratic
triangle - 6 points - 3 at endpoints, 3 in middle of edges
- quadratic
quadrilateral - 8 points - 4 at vertices, 4 in middle of edges
- quadratic
tetrahedron - 10 points - 4 at vertices, 6 in middle of edges
- quadratic
hexahedron - 20 points - 8 at vertices, 12 in middle of edges
Attribute
Data
-
each
Cell
has
0
or
more
pieces
of
attribute data associated with
it.
- scalar -
single value at each location in dataset (eg temperature)
- vector -
magnitude and direction (eg wind speed and direction)
- normal -
direction vector with magnitude = 1
- texture
coordinate (2D, 3D) (eg a location in the visible human dataset)
- tensor
(generalization of vector and matrix)
- rank 0 -
scalar
- rank 1 -
vector
- rank 2 -
matrix
- rank 3 -
3D rectangular array
Fundamental
Algorithms
(Chap
6
vtk)
Categorize
algorithms
according
to:
- structure
- effect transform has on topology
- type -
type of dataset the transform operates on
structure
- Geometric
transformations - alter the geometry but not the topology
- eg rotate
or scale polygonal dataset
- Attribute
transformations - convert data attributes to another form or
create new
attributes from input data
- structure
of dataset remains unaffected
- eg
compute vector magnitude
- Combined
transformations - change dataset structure and attribute data
- eg
computing contour lines or surfaces
- Topological
transformation
-
alters
topology but not geometry or attribute data
- eg
converting polygonal data to unstructured grid
- very
uncommon
type
- scalar -
operate on scalar data - eg generating contour lines from temperature
on map
- vector -
operate on vector data - eg showing oriented arrows of airflow on the
same map
- tensor -
operate on tensor matrices - eg showing components of stress using
oriented icons
- modelling
- generate topology or geometry, normals, texture data - vtk includes
lots of misc algorithms in this category
Scalar
Algorithms
single
data
value
associated
with
each
point in dataset
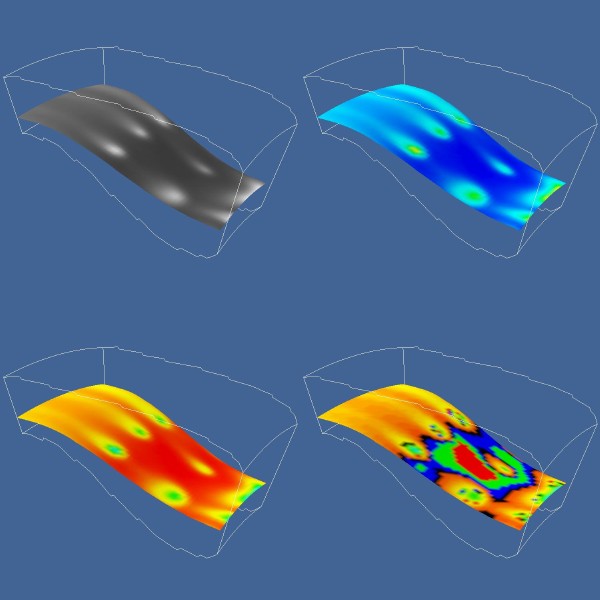
Flow density coloured with different lookup tables
- Color
Mapping - map scalar data to colours using a discrete colour lookup
table
- lookup
table holds an array of colours
- lookup
table has min and max scalar range
- scalar
values serve as indices into lookup table
- if scalar
> max then scalar = max
- if scalar
< min then scalar = min
- map
scalar value into the lookup table
- transfer
function - continuous mapping from scalar data to colour
- mapping
may be linear or logarithmic, etc
- careful
choice of colours is VERY important - Interaction of Color by Josef
Albers
- color
brewer - http://colorbrewer2.org/ is a nice site to find good color
combinations
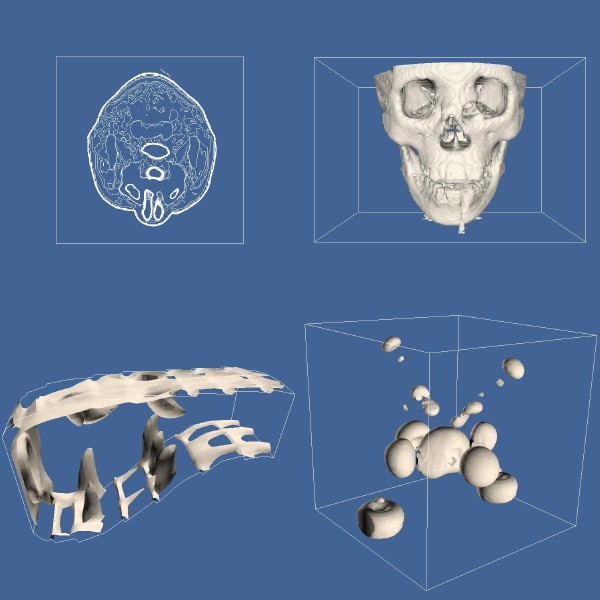
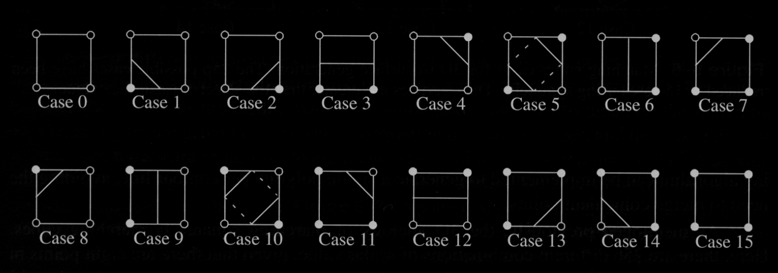
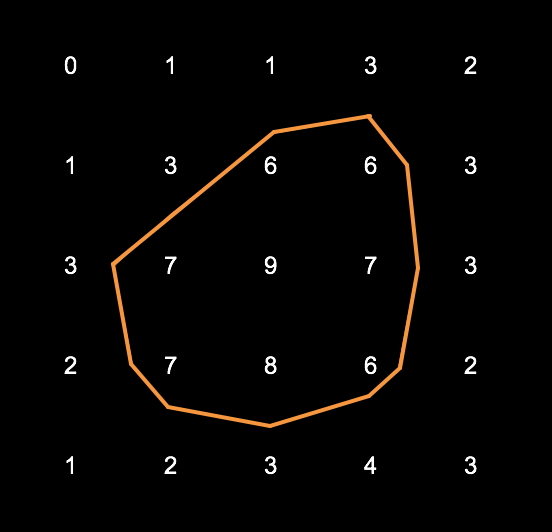
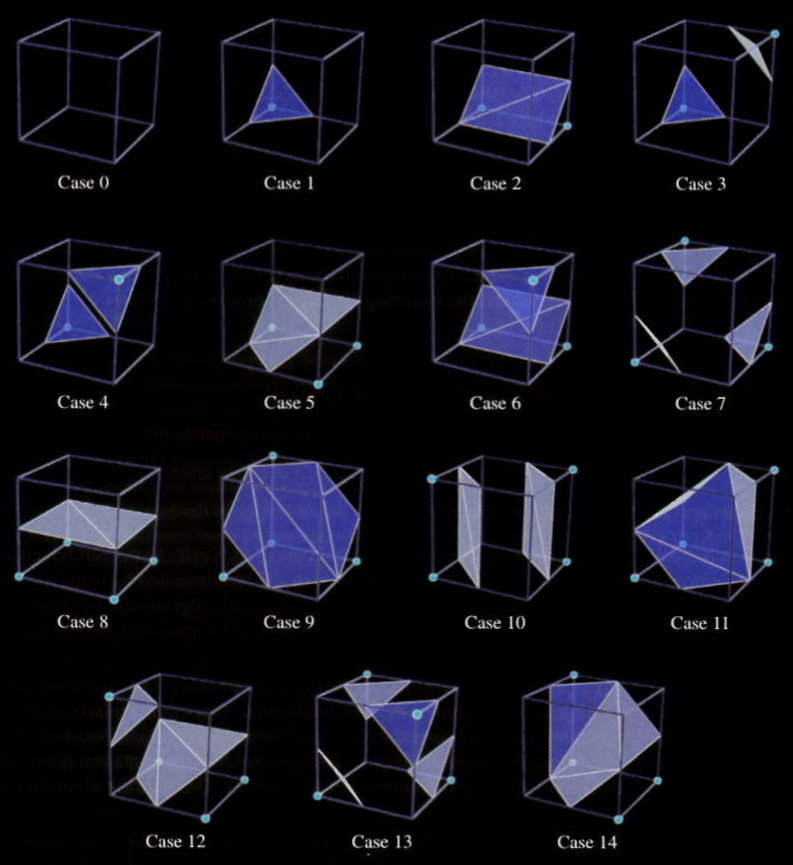
Contouring examples. UL: Marching squares used to generate contour
lines, UR marching cubes surface of human bone, BL marching cubes
surface of flow density, BR Marching cubes surface of iron-proteint
- Contouring
-
constructing
boundaries
between
regions
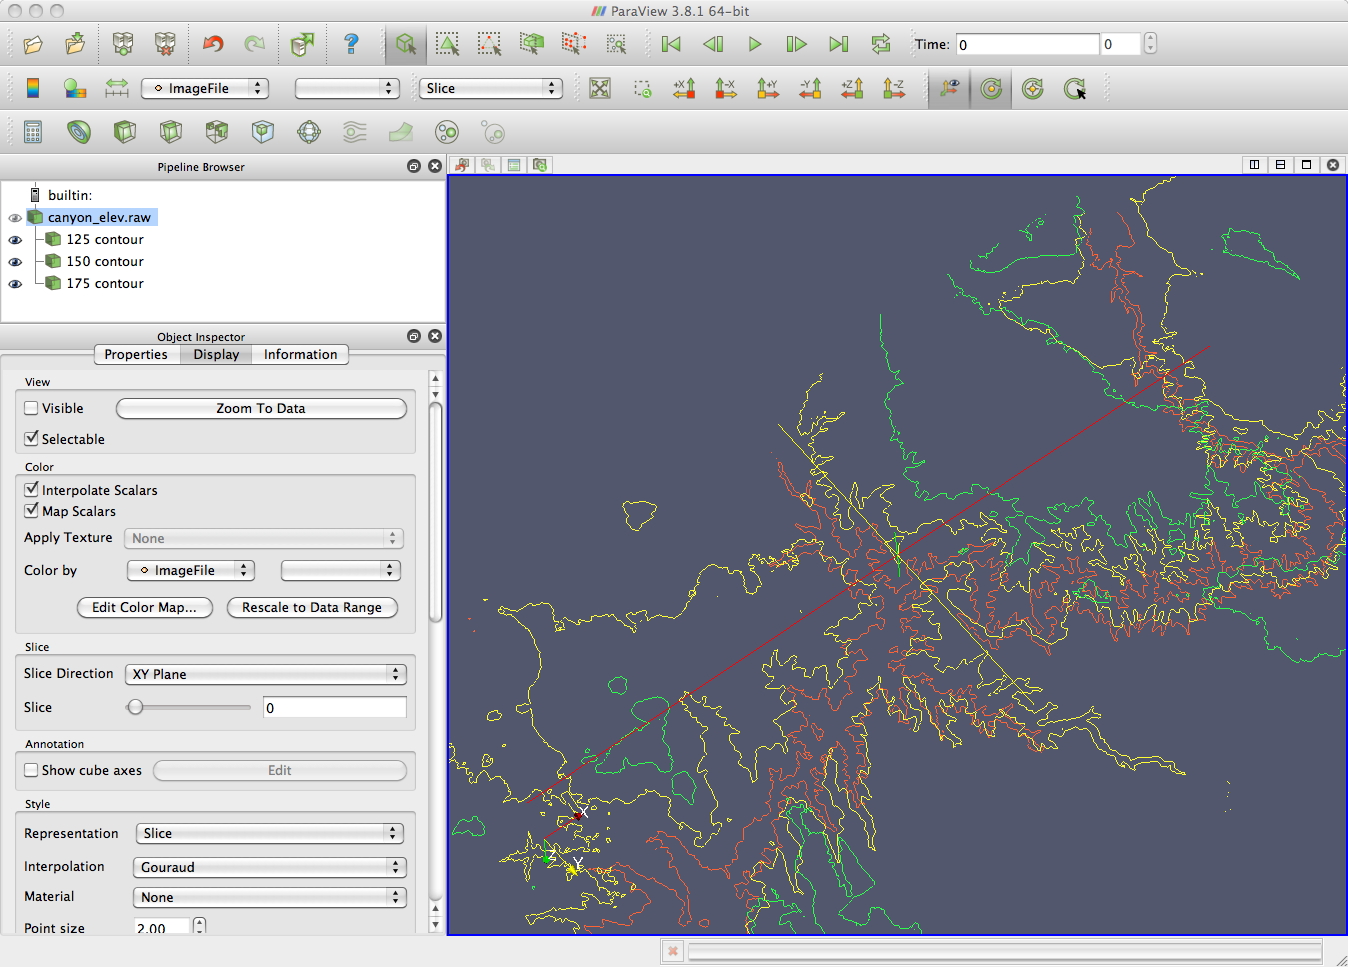
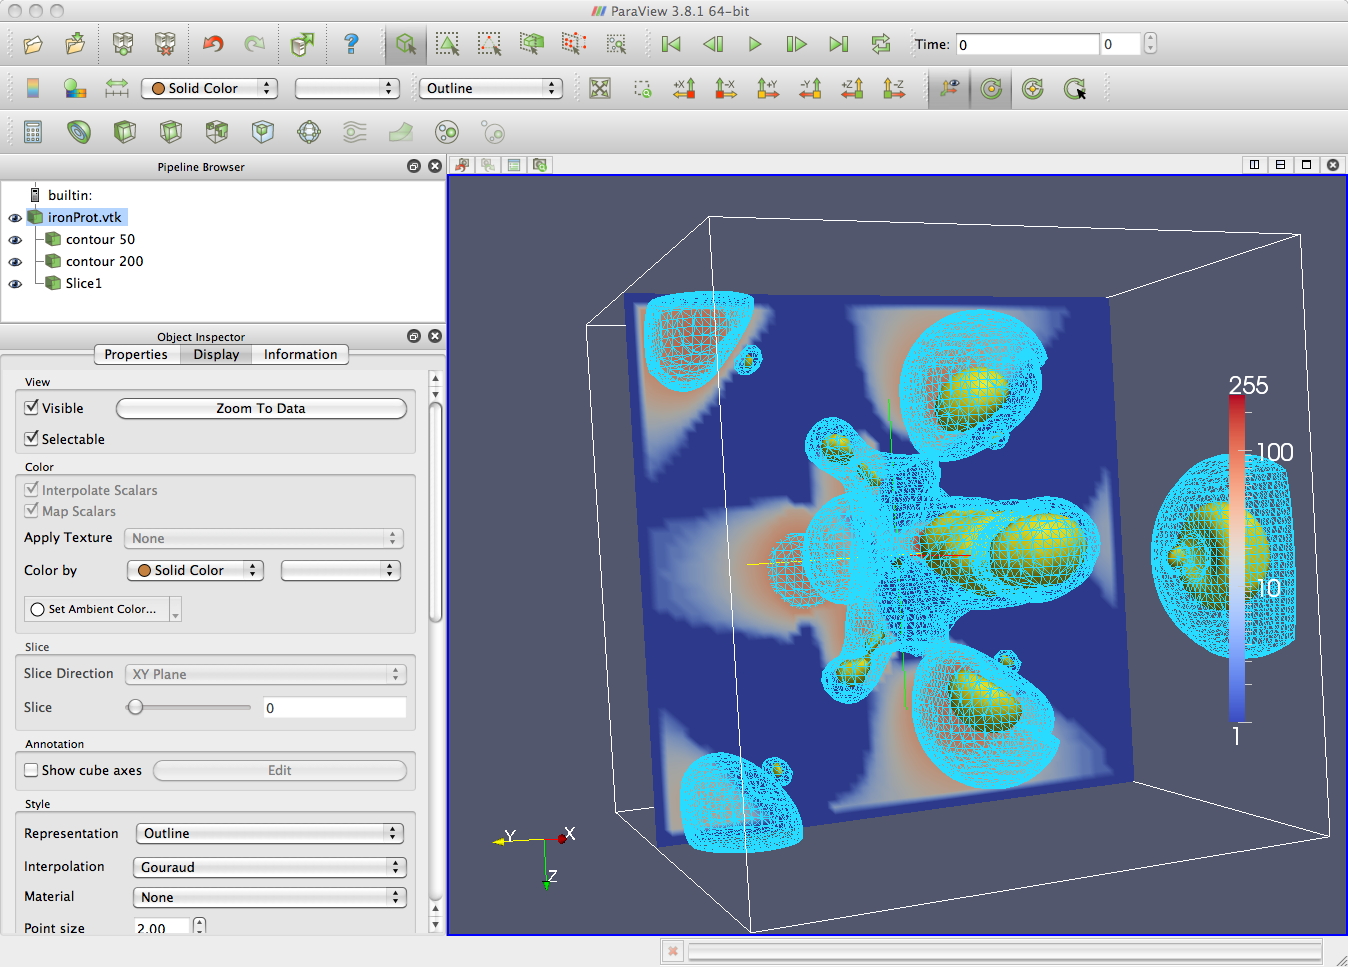
Some
contours
from
last
time
-
the grand canyon - 2D contours and Iron
Protein - 3D contours
Vector
Algorithms
- 3D
representation of direction and magnitude
- Hedgehog
- drawing an oriented scaled line for each vector
- Oriented
Glyphs - 2D or 3D geometric representations can be used instead of
lines
- Time
Animation
- Streamlines
-
connect
point
positions
over
multiple timesteps
- numerical
approximation to a particle trace represented as a line
- tracing
trajectories in a vector field
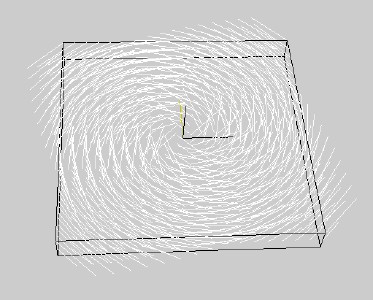
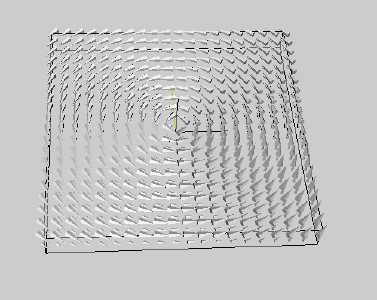
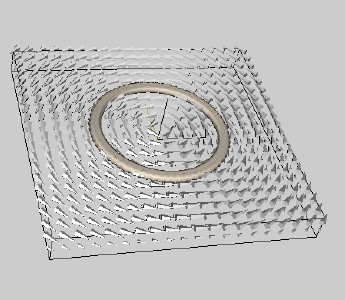
Three different representations of venctor data: hedgehog, glyphs,
streamlines
- Warping -
deforming geometry according to the vector field
- Displacement
Plots
-
shows
motion
of
an object in the direction perpendicular to its
surface
- motion is
caused by applied vector field
- vectors
converted to scalars using surface normal (dot product) vector where +
displacement is out from the surface and - into the surface
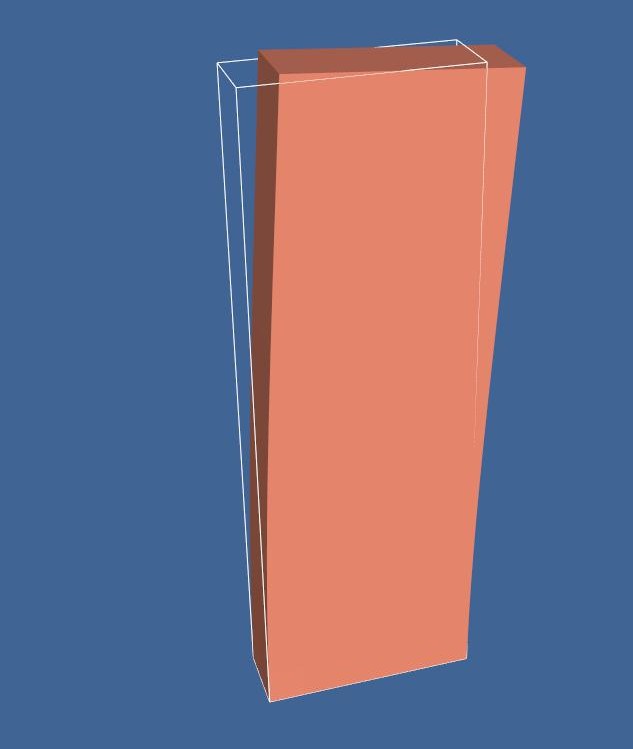 warping
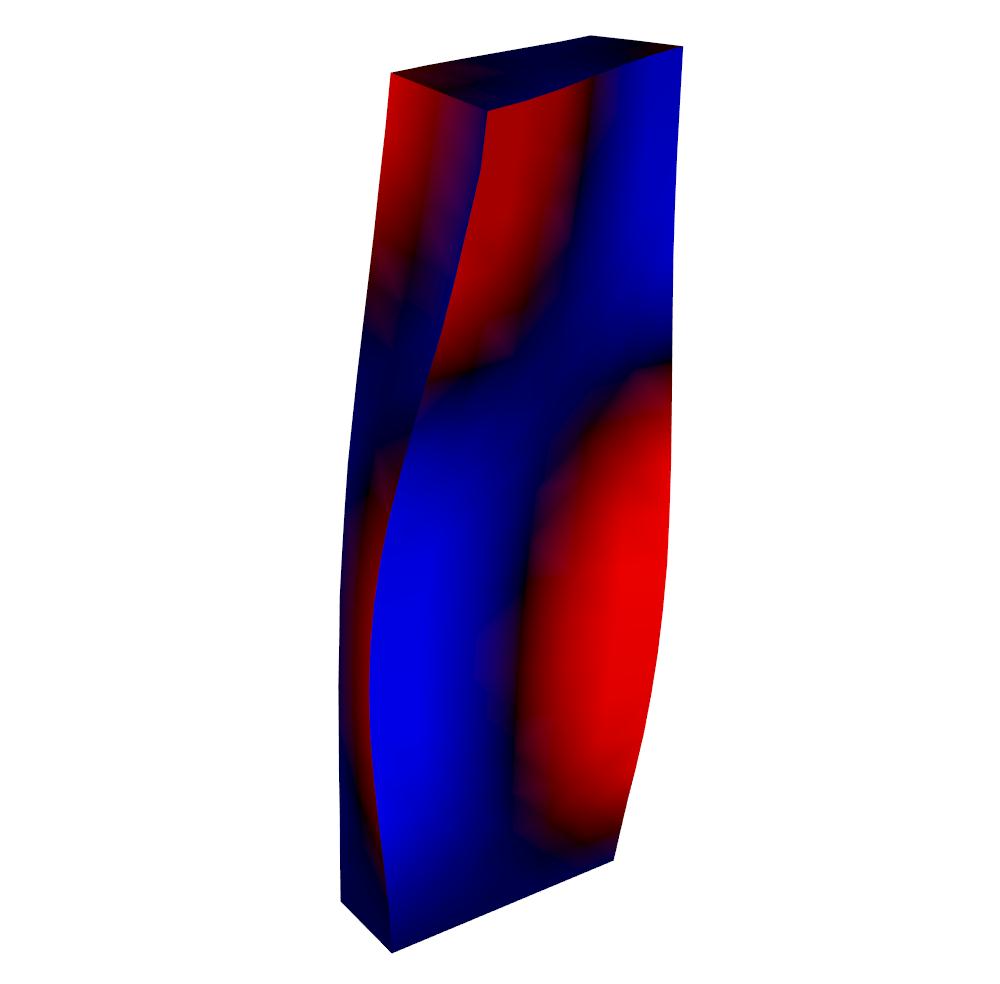 displacement plot
and
we
previously looked at the grand canyon height map represented as a 2D
texture which we warped on one axis into a 3D form and coloured based
on its elevation
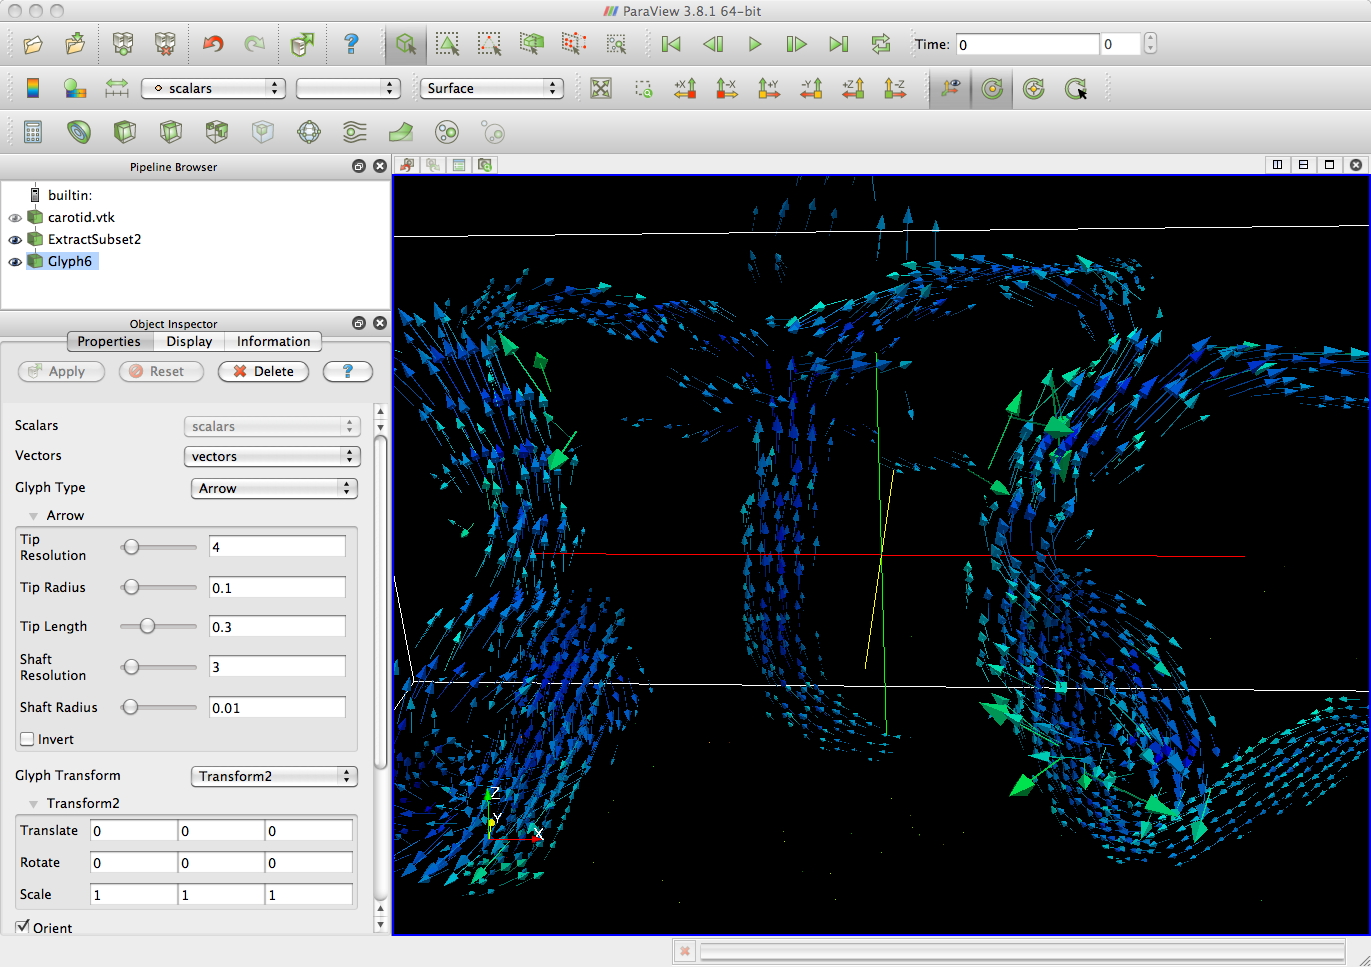
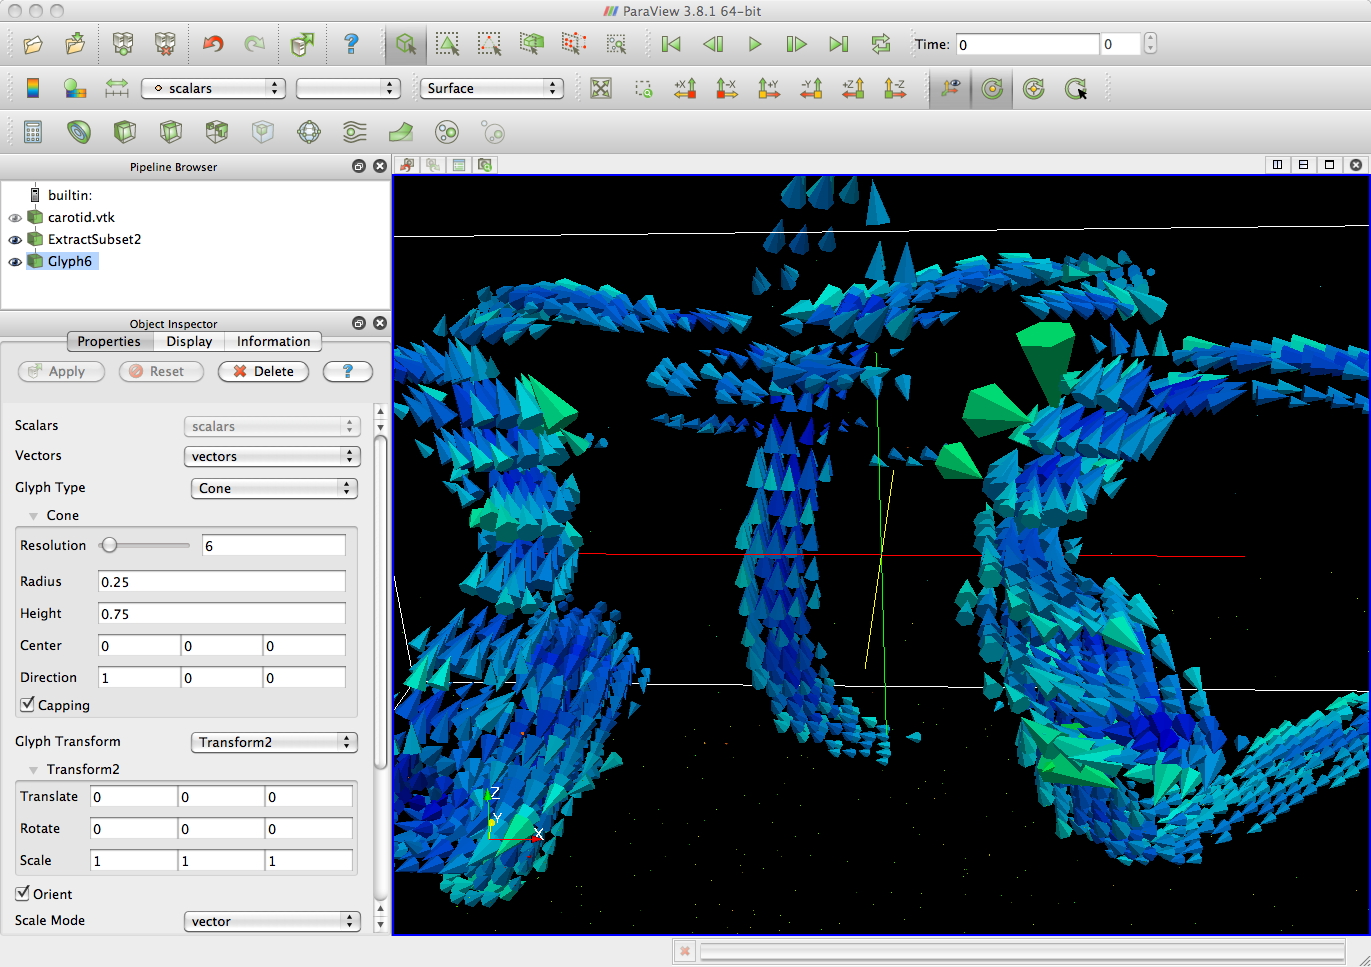
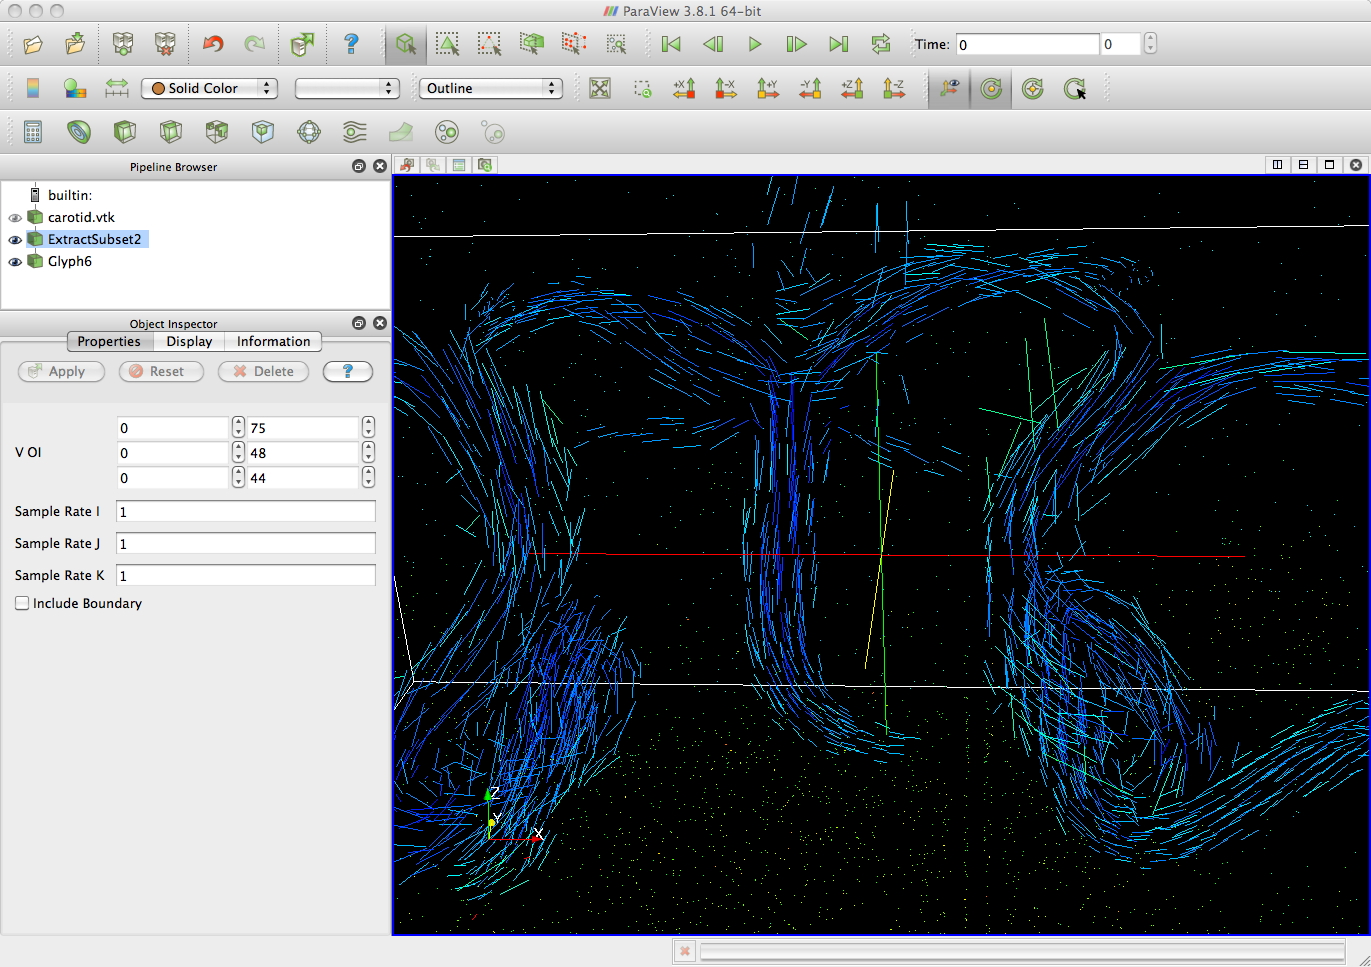
carotid.vtk from the textbook with 167,000
3D
vectors shown as arrows, cones, and lines
kithen.vtk
from
the textbook
first
with
glyphs - with complicated flow patterns it can be hard to see the
flow from discrete vectors
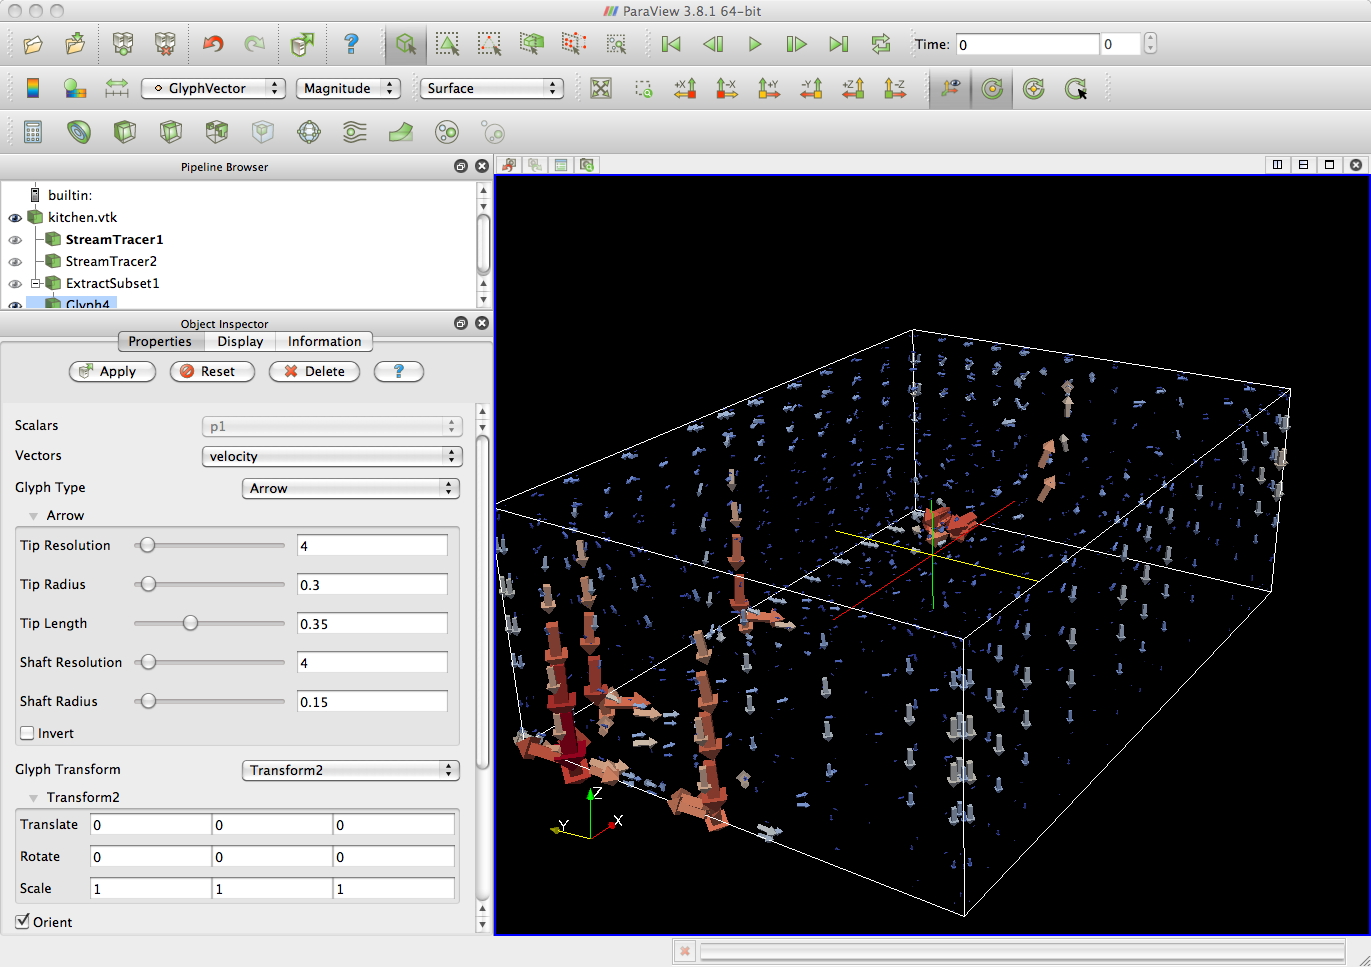
and then with
2 sets of streamtracers which integrate through the discrete vectors to
show streams flowing from, to, or through a given set of points
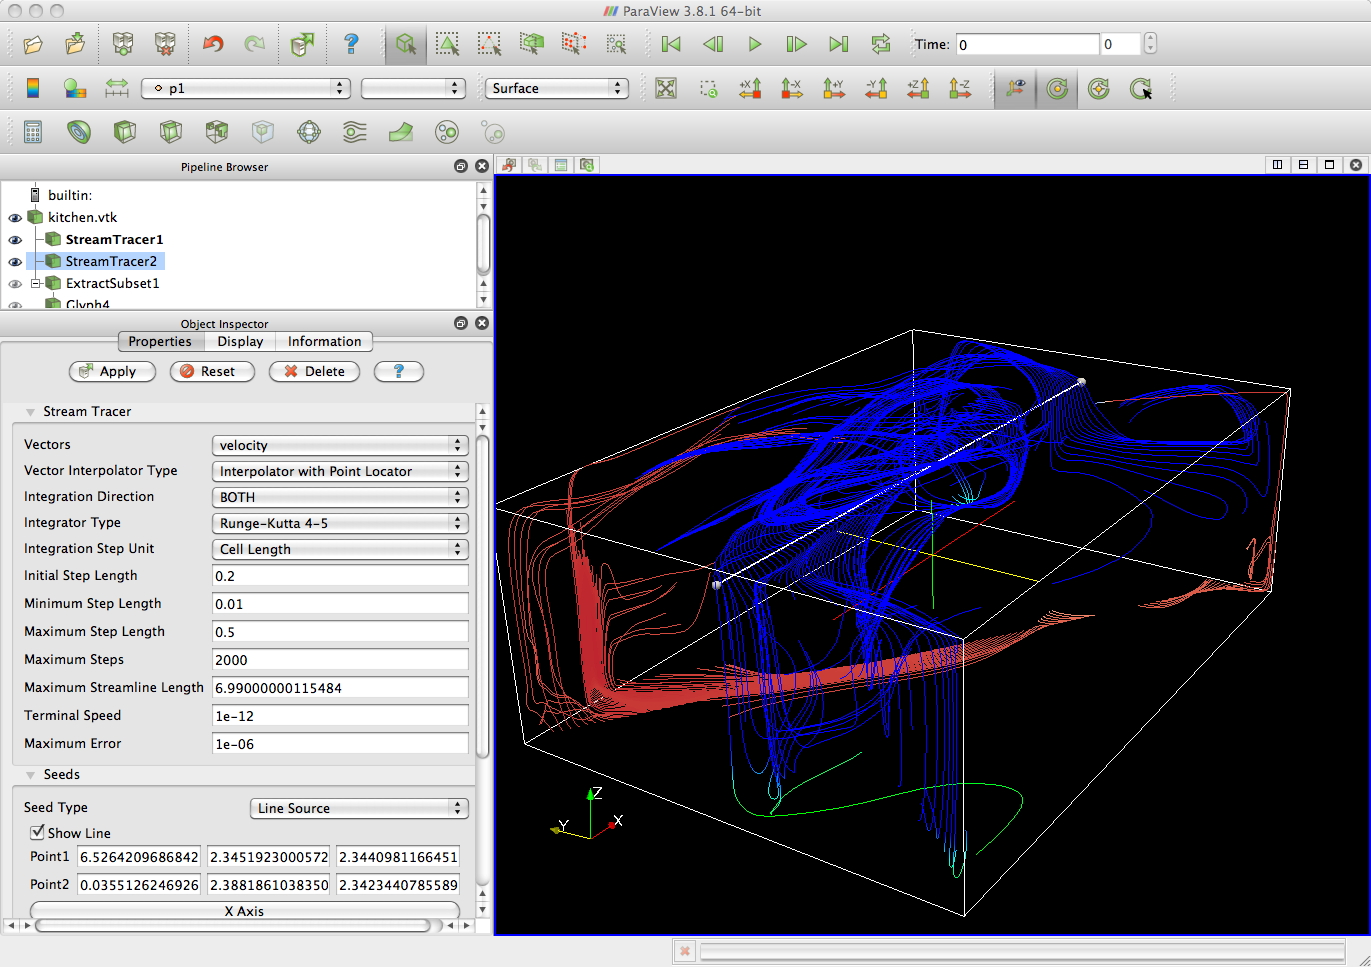
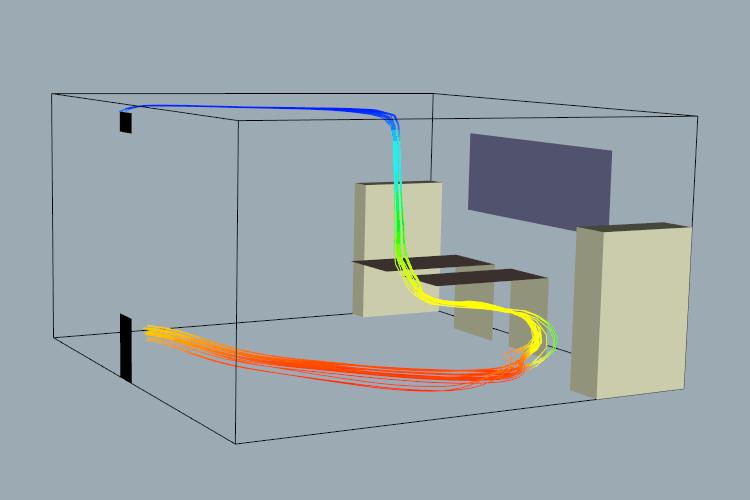
and streamlines
starting from a particular area, with contextual polygonal information
Coming
Next
Time
More
Fundamental
Algorithms
last
revision
1/21/11




 warping
 displacement plot


