Lecture
6
Fundamental
Algorithms
(2
of
2)
(includes
text
and
images
from
the 3rd edition of the VTK book)
Volume
Rendering (Chapter
7 in Visualization Toolkit book)
Have
data
such
as
MRI
or CT scans, ultrasound, etc
Direct
Rendering
(no
intermediate
geometric
representation) vs Geometric
Rendering
Image
order
vs
object
order
- image
order - rays cast through each pixel in image plane through volume
- object
order - volume traversed back-to-front (usually) processing each voxel
- hybrids
Image
Order
-
raycasting
/
raytracing
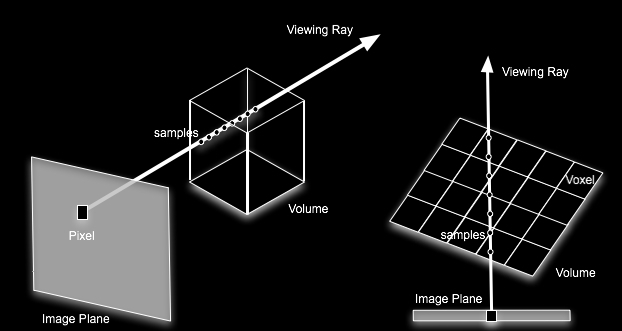
- greyscale
data values
- minimum
value = transparent black
- maximum
value = white
- determine
values encountered along ray
- processing
those
values
according
to
ray function - many possibilities
- volume is
3D image dataset w/ scalar values at points of a regular grid
- need an
interpolation function to sample locations between the grid points
- zero-order
/
constant
/
nearest
neighbour returns closest grid point - simple
- trilinear
- linear interpolation between closest points along 3 axis
- can
sample volume at uniform intervals while traversing the ray
- need to
take care in choosing step size - speed vs accuracy tradeoff
- or
examine each voxel encountered while traversing the ray (fig 7-8)
- convert
the ray into a discrete form to obtain an ordered sequence of voxels
- each
voxel has 6 sides, 8 vertices, 12 edges
- 6-connected
if
each
share
a
face (best at finding small details)
- 18-connected
if
share
a
face
or an edge
- 26-connected
if
share
a
face
or an edge or a vertex (faster) (fig 7-10)
- ray: (x,
y, z) = (xo, yo, zo) + (a, b, c) t where (a, b, c) is normalized
direction vector
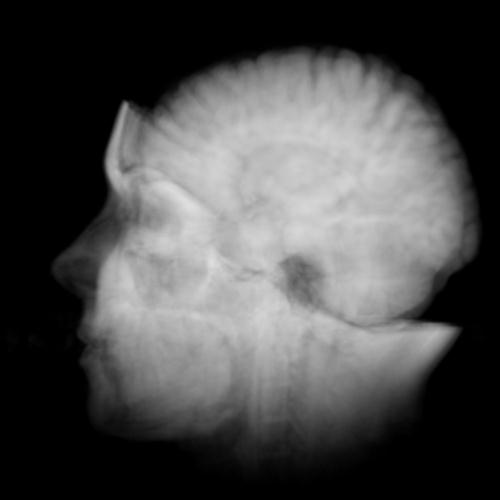
4
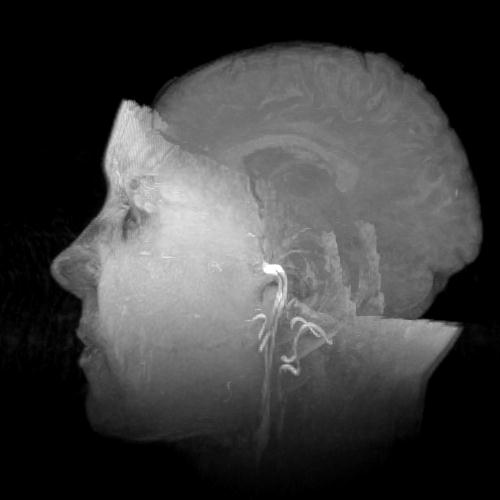
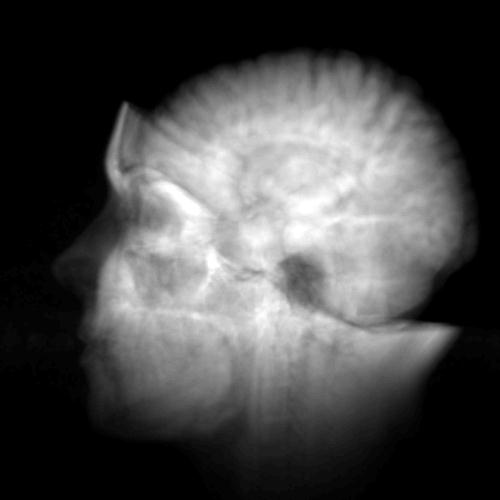
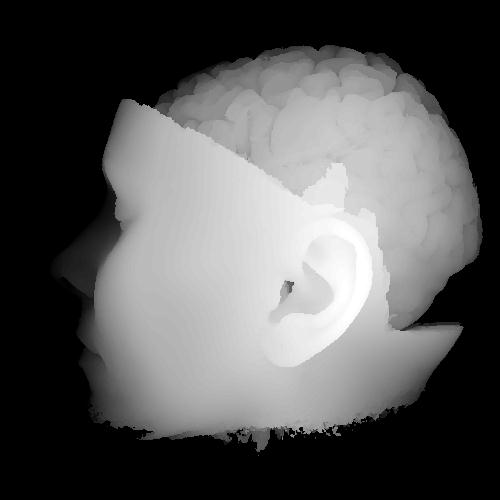
different ray functions - UL:maximum, UR:average, BL:distance=30,
BR:composite
a
nice program to explore this kind of data on the mac is osirix - http://www.osirix-viewer.com/
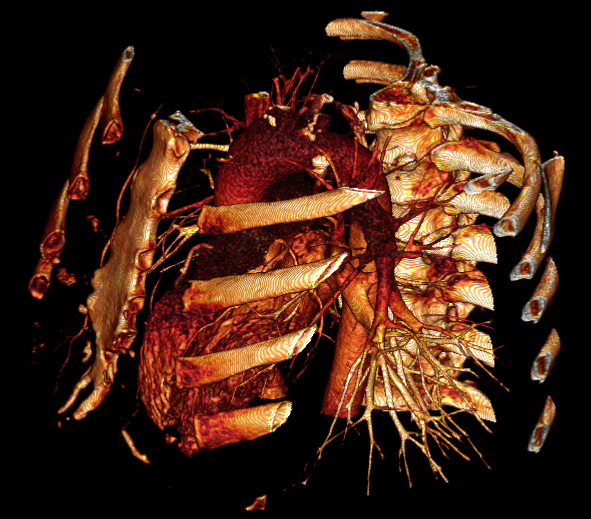
Object
Order
- typically
voxels traversed back to front or front to back and composited using
alpha values
- similar
to situation where everything in scene is a transparent polygon
- some
algorithms do not need to process voxels in a particular order
- typically
have triple nested loop:
- for each
plane ordered back to front
- for each
row of the plane
- for each
voxel in the row
- determine
its projected location on the view plane
- alter the
pixel at that location
- problem
may occur in that by projecting back to the view plane we may have
'holes' as adjacent voxels may not map onto adjacent pixels
- solution
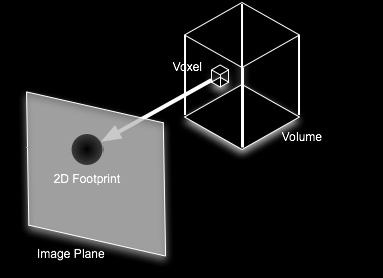
is Splatting - distribute energy of voxel across multiple pixels in a
splat/footprint
- kernel
with finite extent placed around each data sample
- footprint
is projection onto the view plane
- in
parallel projection with symmetric kernel the footprint is identical
for all samples aside from its location so fast
- type of
kernel, radius of kernel, resolution of footprint table all affect
results
- texture
mapping volume rendering - based on hardware in the graphics
cards/boards
- 2D
or 3D
- project a
set of texture mapped polygons which span the entire volume
- sampling
step using interpolation (multiple methods, hardware/software)
- blending
step to combine samples in the frame buffer
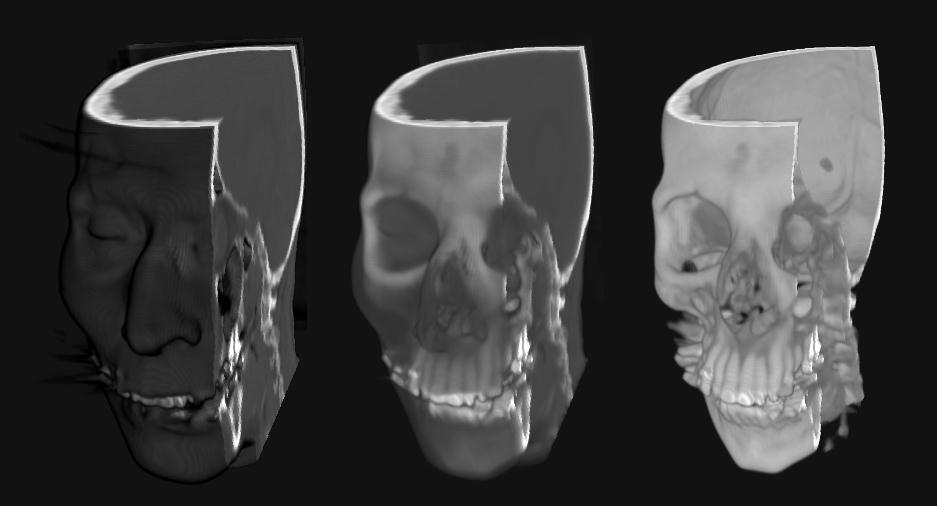 2D Texture-mapped
volume rendering with different opacity mappings
Volume
Classification
- transfer
function maps information at voxel location into material / colour /
opacity
- eg
differentiating air, muscle, bone in a CT scan
- can have
separate functions for red, green, blue, opacity
Regions
of
Interest
- often
need to look through parts of the volume to see other parts of the
volume
- can
specify a partial region of the volume to render that contains
interesting things
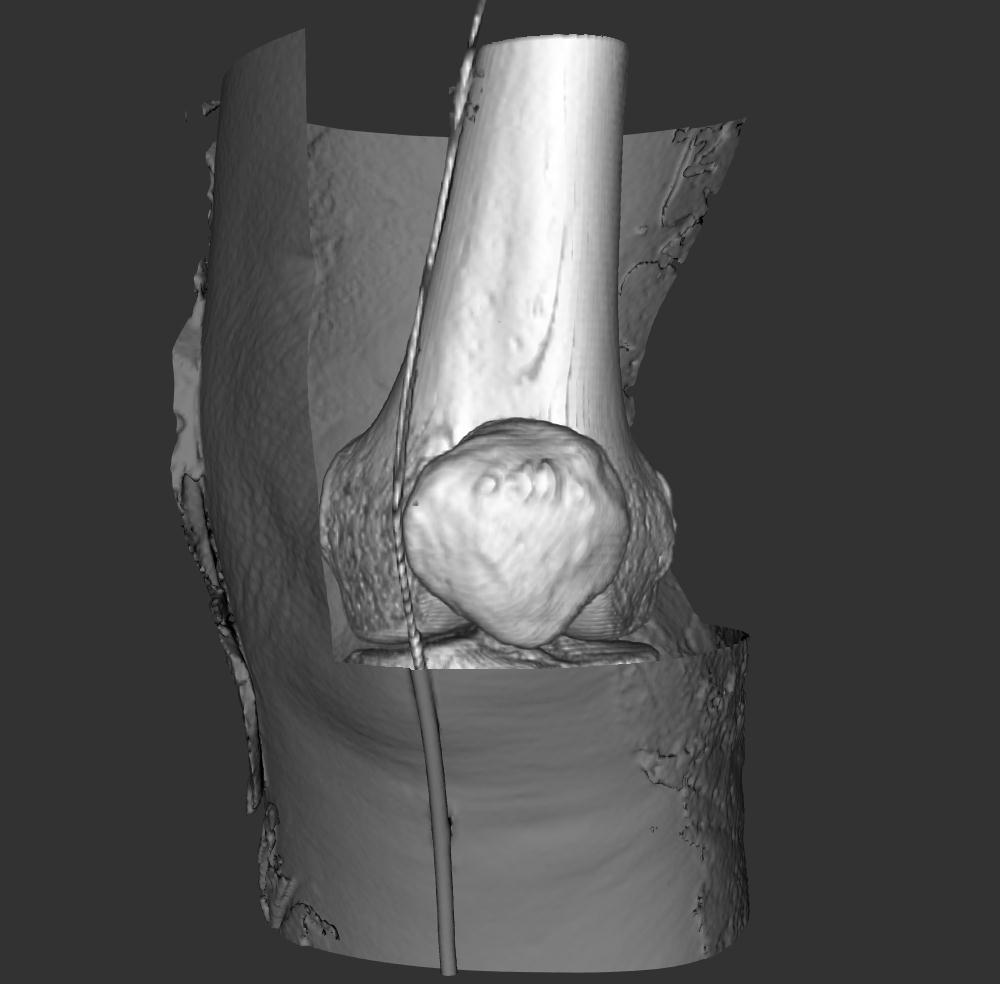
- use
clipping planes or other geometric forms to specify the region
Modelling
Algorithms (Chapter 6.5 in Visualization Toolkit book)
create
or
change
dataset
topology
or geometry
Source
Objects
- Modelling
simple geometry
- generate
sphere, cone, cube
- read in
model files with more complex geometry
- Supporting
Geometry
- Data
attribute creation
- procedures
to
create
data
and
attributes
- for
textures
- for
populating a grid with scalar values
implicit
functions
F(x, y, z, etc) = c eg for a sphere F(x, y, z) = x^2 + y^2 + z^2
- r^2
- properties:
- simple
geometric description
- region
separation (inside [ F<0], on [F=0], outside [F>0])
- scalar
generation to convert point in space into a scalar value
- uses:
- modelling
objects
- can
sample F on a dataset and generate an isosurface at contour value c to
get a polygonal representation of the function
- can
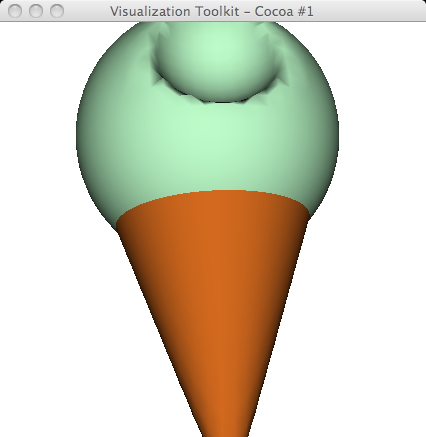
perform boolean operations (union, intersection, difference) to create
complex objects eg vtk ice
cream cone in the Examples/Modelling directory
- selecting
data
- can
select or extract data by choosing cells, points within a particular
region. Cell is within a region if all its points are within the
region. Evaluate each point and check its sign
- can
perform boolean operations as with modelling
implicit
modelling
- similar
to modelling above except scalars generated using distance function
rather than implicit function
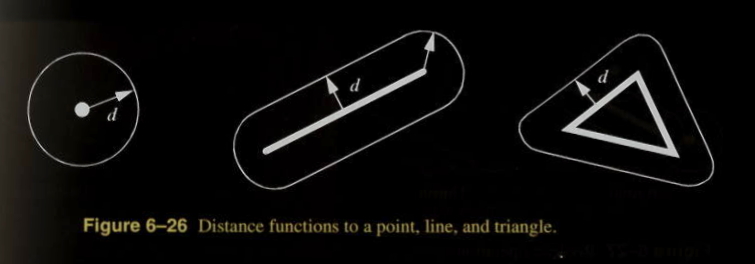
- distance
function computed as Euclidean distance to set of generating primitives
(point, line, polygon)
- isosurface
values
are
distances
to
generating primitive
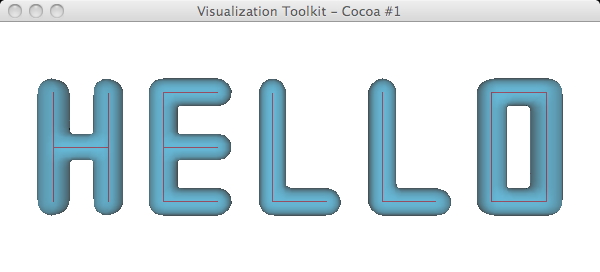
- can
perform boolean operations
- eg
hello.tcl
- some nice
slides (with bad choices of color) on this here: http://www.cpsc.ucalgary.ca/~jungle/555/notes/implicit.pdf
glyphs
- object/icon
that
is
affected
by
input data
- may be
geometry, image, dataset
- may
orient, scale, translate, deform etc in response to input data
cutting
- cut
through a dataset with a surface & display interpolated data values
on the surface
- can view
data on arbitrary surfaces
- cutting
surface defined by an implicit function
- evaluate
F(x, y, z) for each point of each cell in the dataset
- if not
all points + or - then surface passes through the cell
- generate
isosurface F(x, y, z) = 0
- interpolate
cut
edges
to
get
data attribute values
- can make
multiple cuts with different isovalues then show them with transparency
back to front to do volume rendering
Tensor
Algorithms
(Chapter
6.4 in Visualization Toolkit book)
here
are
some
web
pages
with info about tensors:
http://en.wikipedia.org/wiki/Tensor
http://mathworld.wolfram.com/Tensor.html
visualizing
3x3
real
symmetric
tensors
- describe
state of displacement or stress in 3D material
- stress
tensor - stress is measure of loading - force per unit area (N / m^2)
- strain
tensor - strain is measure of displacement - change in length over
length (dL / L)
- diagonal
coefficients are normal stresses and strains
- act
perpendicular to a surface
- normal
stress is either compression or tension
- off-diagonal
coefficients
are
shear
stresses
and strains
- act
tangentially to a surface
- 3x3 real
symmetric matrix can be characterized by eigenvectors and eigenvalues
- ordering
the eigenvalues largest to smallest allows us to name the eigenvectors
- major,
medium, and minor in the same ordering
- visualization
through
tensor
ellipsoids
- visualization
through
tensor
axes
- instead
of ellipsoid, just show the principal axes
some other
representations are shown in http://lmi.bwh.harvard.edu/papers/papers/westinMEDIA02.html
Coming
Next
Time
Visualization
reports
from
the
00s - Part I
last
revision
1/23/11


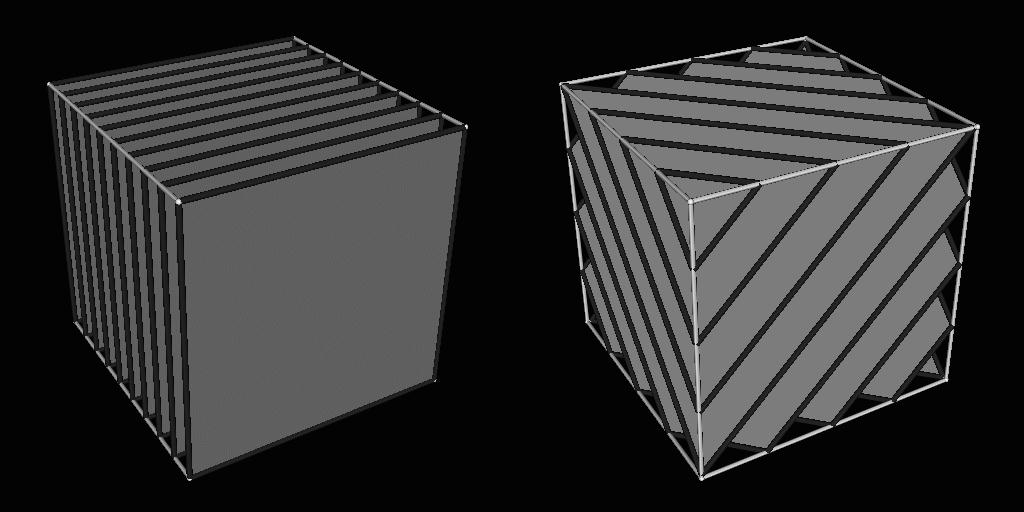
 2D Texture-mapped
volume rendering with different opacity mappings


