Lecture
8
Visualization
reports
from
the
00s
- Part II
First
lets
talk
about
the Project Presentations next week.
I will be grading your project and your presentation. I also want
everyone to get feedback on the talk from the rest of the class so each
person in the audience will be filling out the following form for each
presenter. This way the presenter will get 8 reviews of his/her talk.
I will not see these, they will go directly to the speaker. I will hand
out a big pile of these forms next week, but please bring a pencil or
pen to fill them out.
Speaker Evaluation Form
Date:
________
Name
of
speaker:
Please rate the speaker on each
item, using the following scale:
5 = excellent 4
= good 3 = average 2 =
fair 1 = poor
Presentation was
well-organized
______
Main points were
clear
______
Speaker began and finished without rushing ______
Speaker looked at and spoke to the audience ______
Speaker's words were clearly understandable ______
Speaker used visual aids
effectively ______
Speaker finished within time
limits ______
Presentation held your
interest
______
Overall
rating
______
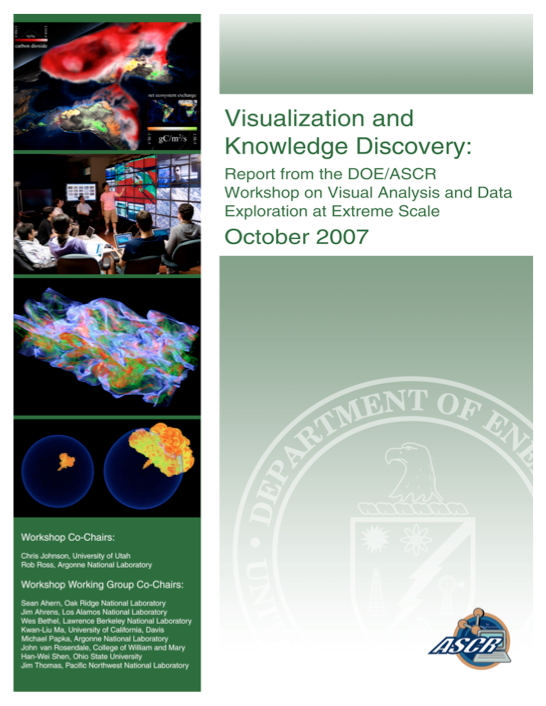
Visualization
and Knowledge Discovery: Report from the DOE / ASCR Workshop on Visual
Analytics and Data Exploration at Extreme Scale - October 2007
 available in pdf
format here
Principal
Finding: Scientific data analysis, visualization, and data
management
have evolved over the past few decades as a result of research funding
from the DOE, the National Science Foundation (NSF), the Defense
Advanced Research Projects Agency (DARPA), and other agencies. Today’s
ability to understand and explore spatial-temporal data and nonspatial
data is the result of this legacy. However, datasets being produced by
experiments and simulations are rapidly outstripping our ability to
explore and understand them, and there is, nationwide, comparatively
little basic research in scientific data analysis and visualization for
knowledge discovery.
Suggested
Action: We must
restart basic research in scientific data analysis and
visualization as a first class citizen within the DOE Office of
Advanced Scientific Computing Research. A strong basic research
program
is vital to our continued success and competitiveness in the
international scientific research endeavor. Fundamental advances must
be made in visualization to exploit the potential of extreme scale
simulations and large datasets derived from experiments. We must also
pay much greater attention to human factors; for example, by
measuring
which visualization techniques are most useful to the end user. We need
to treat visualization itself as an experimental science, not just a
technology.
available in pdf
format here
Principal
Finding: Scientific data analysis, visualization, and data
management
have evolved over the past few decades as a result of research funding
from the DOE, the National Science Foundation (NSF), the Defense
Advanced Research Projects Agency (DARPA), and other agencies. Today’s
ability to understand and explore spatial-temporal data and nonspatial
data is the result of this legacy. However, datasets being produced by
experiments and simulations are rapidly outstripping our ability to
explore and understand them, and there is, nationwide, comparatively
little basic research in scientific data analysis and visualization for
knowledge discovery.
Suggested
Action: We must
restart basic research in scientific data analysis and
visualization as a first class citizen within the DOE Office of
Advanced Scientific Computing Research. A strong basic research
program
is vital to our continued success and competitiveness in the
international scientific research endeavor. Fundamental advances must
be made in visualization to exploit the potential of extreme scale
simulations and large datasets derived from experiments. We must also
pay much greater attention to human factors; for example, by
measuring
which visualization techniques are most useful to the end user. We need
to treat visualization itself as an experimental science, not just a
technology.
Visualization
and analysis methods are the principal means of understanding data in
many areas of science. Science is increasingly data-driven and
multidisciplinary; both experiments and simulations are producing
petascale datasets, and larger datasets are on the horizon. But data
alone does not suffice; it must be transformed into knowledge to be of
any real value. Visual scientific data analysis and representation are
central to this transformation—a critical link in the chain of
knowledge acquisition.
Visual
data exploration is fundamental to our ability to interpret models and
understand complex phenomena. We use our visual perception and
cognition to detect patterns, assess situations, and rank tasks. Visual
data exploration is one of the most important ways to reduce and refine
data streams, enabling us to winnow huge volumes of data—an
increasingly critical operation. Visual data exploration has thus
become a cornerstone of the scientific enterprise.
Visual
data exploration is, however, clearly underappreciated. One reason is
the tendency to view computer graphics and visualization mainly as a
way to present scientific results. But the field of visual data
exploration is much more than “pretty pictures.” The real power comes
from the integration of interactive visual representation into the
end-to-end scientific discovery process, coupling the spectacular
visual understanding of the human mind with the scientific problem at
hand.
Herbert Simon, Nobel
Laureate in economics:
"A wealth of information creates a poverty of attention and a need to
allocate it efficiently."
This
statement succinctly summarizes the issue with peta- and exascale
datasets. We have far more data than we can explore in a lifetime with
current tools.
DOE Application areas:
- Computational
Astrophysics
- Supernovae
Explosion Modelling
- Cosmic
Microwave Background Data Analysis
- Climate
Modeling
- Magnetically
Confined
Fusion
- Combustion
Simulation
- Accelerator
Design
Fundamental
Algorithms
Findings:
Visualization is more than a “pretty picture.” Effective visual data
analysis must be based on strong mathematical foundations to reliably
characterize salient features and generate new scientific knowledge.
Suggested
Action: Basic research in developing fundamental mathematical methods
such as topology, statistics, high-order tensors, uncertainty, and
feature extraction must be established to tackle tomorrow’s exascale
visualization problems.
Robust
Topological Methods -
Topological methods are becoming increasingly important in the
development of advanced data analysis because of their expressive power
in describing complex shapes at multiple scales.
High-Order
Tensor Analysis
- The challenge of
visualizing higher-order tensor fields is similar in some ways to the
challenge of visualizing multivariate datasets. Both deal with a high
number of interrelated values at each location, where the relationships
of the variables need to be highlighted, while mathematical properties
and invariants need to be preserved in tensor fields. Novel methods
must be developed to help scientists understand such datasets, possibly
including glyph-based techniques, topological representations via
critical region analyses, or continuous field representations.
Statistical
Analysis -
Our current data analysis capabilities lag far behind our ability to
produce simulation data or record observational data. A particular gap
exists in the mathematics needed to bring analysis and estimation
methodology into a data-parallel environment.
Feature
Detection and Tracking
- The scaling of simulations to ever finer granularity and timesteps
brings new challenges in visualizing the data that is generated. It is
crucial to develop smart, semi-automated visualization algorithms and
methodologies to help filter the data or present “summary
visualizations” to enable scientists to begin analyzing the immense
data following a more top-down methodological path.
Uncertainty
Management and Mitigation -
A significant problem faced by the Office of Science simulation efforts
is the robust treatment of uncertainty. Numerical simulations are rife
with sources of uncertainty, which can be introduced in the form of
numerical imprecision, inaccuracy, or instability. Predictions and
forecasting inherently contain uncertainty arising from the variability
in the physical processes under study. Scientific experiments and
measurements introduce uncertainty in the form of calibration errors,
differences in repeated measurements, and the like. Visualization of
petascale datasets also can introduce uncertainty during processing,
decimation, summarization, and abstraction as an artifact of creating
much-condensed representations of the data.
The
ability to fully quantify uncertainty in high-performance computational
simulations will provide new capabilities for verification and
validation of simulation codes. Having a robust mathematical framework
for tracing the sources of uncertainty and its propagation throughout
the simulation process turns simulation into a strong predictive
capability. Handling uncertainty must be an end-to-end process, where
the different sources of uncertainty are identified, quantified,
represented, tracked, and visualized together with the underlying data.
Hence, uncertainty representation and quantification, uncertainty
propagation, and uncertainty visualization techniques need to be
developed in order to provide scientists with credible and verifiable
visualizations.
Complexity
of
Scientific
Datasets
Findings: Trends
in scientific simulation—which include coupled codes, hierarchical
computation and data models, extreme and varying scales of spatial and
temporal resolution, and increasing numbers of variables to more
faithfully represent physics and chemistry phenomena—present challenges
that cannot be met by extrapolating existing approaches, known
techniques, and familiar methodologies.
Suggested
Action: A concerted and long-term visual data understanding and
representation research effort is a sound and crucial investment for
providing the technologies needed to enable knowledge discovery on the
complex, heterogeneous, multiresolution datasets projected to be
produced by scientific simulations on peta- and exascale platforms.
Multimodel Data
Understanding
- One area of significant advancement in computational science in
recent years enabled by more powerful computing platforms is multimodel
codes. These codes, which play a significant role in SciDAC projects
aiming to model complex facilities, such as fusion tokamaks and
particle accelerators, and complex scientific phenomena, such as
supernovae explosions and Earth system models, consist of combinations
of codes each modeling some individual scientific regime. Data produced
by one component is often used as input to another, resulting in an
extremely complex and information-rich dataset. In other cases, input
from instruments is combined with simulation results. Traditional
approaches to visual data analysis have focused on data generated from
a single code or code family. These approaches do not lend themselves
to use on the complete systems simulated with such multimodel codes.
New approaches to visual data analysis and knowledge discovery are
needed to enable researchers to gain insight into this emerging form of
scientific data. Such approaches must take into account the multimodel
nature of the data; provide the means for a scientist to easily
transition views from global to local model data; offer the ability to
blend traditional scientific and information visualization; perform
hypothesis testing, verification, and validation; and address the
challenges posed by vastly different grid types used by the various
elements of the multimodel code. Tools that leverage semantic
information and hide details of dataset formats will be critical in
enabling visualization and analysis experts to concentrate on the
design of these approaches rather than becoming mired in the
trivialities of particular data representations.
Multifield
and Multiscale Analysis
- In many scientific fields of study, computational models aim to
simulate phenomena that occur over a range of spatial and temporal
scales spanning several orders of magnitude. Those models also attempt
to capture the interaction of multiple variables‚ often referred to as
multivariate or multifield data. Visualization of multivariate or
multiscale datasets is helping scientists discover hidden relationships
among the data, as well as transient events (occupying a small fraction
of simulation time) that have a profound influence on the outcome of
the simulation.
Multiresolution
techniques are needed to support zooming in to regions of interest,
generating geometry with high accuracy where needed, and displaying
animations that are short enough to match a viewer’s desired context
while providing sufficient detail for transient important events. For
multifield data, visualization cannot simply map different variables to
different visual parameters, as one will quickly run out of visual
parameters and introduce a visual overload on the user, hampering the
task of data understanding. We therefore need to bring in different
approaches from visual analytics, projections and dimensionality
reduction, database queries, feature detection, and novel visualization
techniques.
Time-Varying
Datasets -
One major factor contributing to the growth of data
size is the increasingly widespread ability to perform very large scale
time-varying simulations. Although intensive research efforts have been
undertaken to enable visualization of very large datasets, most of the
existing methods have not specifically targeted time-varying data. New
visualization techniques and user interfaces must be developed to
assist the user in understanding exascale time-varying multivariate
datasets. Scientists must be able to interactively browse
through
different spatial and temporal scales, visualize and identify
scientific phenomena of different temporal lengths, and isolate and
track salient features in both time and space. Multiresolution spatial
and temporal data management and encoding techniques need to be fully
integrated with current and future visualization algorithms so that the
scale and location of the time-varying data will be completely
transparent to the visualization users.
Advanced
Architectures
and
Systems
Findings:
Upcoming system architectures are a significant departure from systems
of the past decade. Current approaches for performing visualization and
analysis are not well suited to the processing or storage capabilities
of petascale and exascale architectures. Likewise, software
environments surrounding these algorithms are not adequate for
scientific discovery using these resources.
Suggested
Action: Sustained research in exploiting parallelism, in situ
processing, data access, and distance visualization is necessary to
adapt visualization and analysis techniques to the rapidly changing
computational landscape in order to help scientists gain insight into
their problem using advanced systems.
Pervasive
Parallelism
-
Computer architectures are undergoing revolutionary change. In the near
term, all computer architectures will involve parallelism on a single
chip. In the longer term, all computer architectures will involve
massive parallelism. For example, AMD and Intel have changed
their
product lines to include dual-core and quad-core processors, with
roadmaps for continued increases in the number of cores. The
Sony/Toshiba/IBM Cell Processor has eight stream processing cores in
addition to a conventional scalar processor. Commodity GPUs now feature
hundreds of processors. GPUs and CPUs are also being merged, which will
enable tight coupling between applications and graphics. This is likely
to be the biggest change to the PC platform in the past 20 years.
We are entering
an era of pervasive parallelism. As the number of transistors doubles,
the number of cores will also double. This trend means that software of
the future will be very different from the sequential programs of
today. This revolution in computer architecture will impact the
graphics and visualization enormously. The visualization pipeline as we
know it today will likely be radically different in order to exploit
the new architectures. These new architectures will also enable an
entirely new class of interactive visualization applications. Since
graphics is the main driving application for such high-performing
chips, it is critical that the graphics and visualization community
actively participate in the research and development of these
technologies. One key focus for near-term research is the integration
of the CPU and GPU, and the programming models for each. Future
architectures likely will be heterogeneous, with multiple kinds of
processors on a single die. Visualization, which can use both
multicore-CPU-style thread parallelism and GPU-style data parallelism,
will play a major role in understanding the results from such
heterogeneous systems.
In
Situ
Processing
-
As processing power grows, so does the amount of data processed and
generated. Increased computation rates enable simulations of higher
fidelity, which in turn yield more data. Unfortunately, storage system
bandwidth is not increasing at the rate at which our ability to
generate data is growing. The divide between what we are producing and
what we are capable of storing is critical. It is already common for
simulations to discard over 90 percent of what they compute. With
storing data no longer a viable option, output processing and
visualization must be performed in situ with the simulation.
Collocating certain visualization algorithms with simulation can
simultaneously improve the effectiveness of the algorithm and maximize
the information stored in the data. For example, saliency analysis can
help the simulation make better decisions about what to store and what
to discard. Feature extraction becomes much more effective when all
variable information is available, and feature tracking is much more
reliable when temporal fidelity is high. Features can provide far more
information to an analyst and can require far less storage than the
original volume. Because these techniques must be integrated into the
application and supported by the run-time environment, interaction with
designers of programming models and system software for advanced
architectures is warranted.
Data Access
- In situ processing can mitigate the disparity between data generation
rates and storage system capabilities and is an important component in
managing petascale and exascale datasets. However, applications on
upcoming systems will store an unprecedented amount of simulation data
during their run time. The current practice of postprocessing datasets
from leadership-computing applications on separate visualization
clusters will likely fall short at the petascale and certainly will be
impossible at the exascale. Research in alternative mechanisms for
processing large datasets is critical for enabling visualization at
these scales. These could include out-of-core mechanisms and streaming
models of processing, likely used in conjunction with in situ
processing.
Data models and
formats are an important issue for applications as a whole, because the
decisions made when defining these models and formats affect the
scientists’ ability to describe the results of their work as well as
the efficiency with which that data is moved to storage and
subsequently processed. The
explosion of data formats and models
present in the DOE application space is causing significant problems in
our ability to generalize tools for visualization and analysis, and
this situation is exacerbated by the use of multiple formats and models
in applications that combine simulation with other data sources or that
leverage coupled codes. The disconnect between the data models
used in
simulation codes and subsequent postprocessing access patterns, in
conjunction with an increase in the complexity of these datasets, is
leading to increased overhead in the I/O component of the visualization
and analysis process. Attention is needed to ensure that storage
organizations are optimal for state-of-the-art visualization algorithms
and map well to the systems on which this data will be processed.
Achieving this objective will require the combined effort of
scientists, visualization experts, and storage researchers.
Mechanisms for
reducing data within the storage system provide another avenue for
reducing the I/O requirements of analysis. Active storage technologies,
under research in the storage domain, could be an important enabler by
allowing analysis primitives to execute within the storage system. In
cases where scientists prefer to locally view results of remote
simulations, minimizing the amount of data that must be transferred is
critical. Additional research is necessary to understand how best to
integrate data reduction into remote I/O protocols so that reduction
can be performed prior to movement of datasets over long- haul networks.
http://hpc.pnl.gov/projects/active-storage/
Distance
Visualization
- For DOE Office of Science application teams, visualizing, analyzing,
and understanding their results is key to effective science. These
activities are significantly hampered by the fact that scientists and
the supercomputing resources they work on are located in geographically
different locations. These teams are expecting to generate petabytes of
data soon and exabytes of data in the near future, making this problem
increasingly challenging. To address this challenge, we need to look
beyond application and adaptation of existing technologies. Many orders
of magnitude separate the data sizes we need to visualize and the data
sizes our current gigabit networks can handle.
A diverse and
broad set of interrelated research and development activities is needed
to address specific distance visualization challenges. These include
development of latency-tolerant techniques for delivering interactive
visualization results to remote consumers using distributed and
parallel computational platforms; techniques for delivering
visualization results that gracefully accommodate the wide variance in
network capacity, from multiple OC-192 rings (ESnet) to consumer-grade
broadband; resource- and condition-adaptive partitioning of the
visualization pipeline to meet performance or capability targets; and
data storage and transmission techniques that leverage advances in
compression, progressive refinement, subsetting, and feature-based
methods to help reduce the I/O bandwidth requirements to a level more
appropriate for distance-based visualization.
End-to-End
Integration
-
In order to analyze and understand scientific data, complex
computational processes need to be assembled and insightful
visualizations need to be generated, often requiring the combination of
loosely coupled computational and data resources, specialized
libraries, and Grid and Web services. Typically this process involves
data management and statistical analysis tasks, such as data extraction
from very large datasets, data transformation or transposition,
statistical summarization, pattern discovery, and analytical reasoning.
Rather than attempting to develop a single, monolithic system with such
a wide range of capabilities, technologies and tools from different
domains must be integrated in a single framework to provide iterative
capabilities of interacting with and visualizing scientific data.
Multiple
visualization and data analysis libraries and tools are available
today, some of which (e.g., VTK, VisIt, ParaView, and SCIRun) are
capable of processing very large data volumes in parallel, and some
(e.g., VisTrails) have advanced provenance, comparative and multiview
capabilities. Statistical and plotting tools (e.g., R, matplotlib, and
IDL) are used routinely by scientists. Integrated environments (e.g.,
Matlab and Mathematica) are also very popular. For data management,
various tools (e.g., such as NetCDF and HDF5) support specialized data
formats, and others (e.g., FastBit) support specialized indexing
methods for efficiently performing value-based queries and subset
extraction. The lack of integration among these tools is a major
shortcoming, however, and hampers visualization and data analysis
efforts.
A framework is
needed that allows multiple tools to interact, permitting the
integration of existing and future software modules into end-to-end
tasks. Research is needed to have visualization, data management,
statistical, and reasoning tools interoperate seamlessly. Further work
is needed to develop specialized workflow capabilities for
visualization and data analysis. The development of these tools is
especially challenging when dealing with expected peta- and exascale
datasets and multiple scientific domains.
Knowledge-Enabling
Visualization
and
Analysis
Findings:
Analysis is about interaction among people working with each other and
computational resources to understand results. Little about this
process is currently captured for reuse except for anecdotal summaries
and final snapshots in the form of images and movies. New capabilities
will be required to enable discovery at the exascale, including the
ability to reconstruct previous analyses for reuse, leverage previously
acquired and related knowledge, and provide guidance and discovery aids
to the scientist.
Suggested
Action: Basic research is needed to develop novel methods for capturing
knowledge about the analysis process and providing that knowledge for
reuse in collaboration and interaction with other team members and
computational resources.
Interaction,
Usability,
and
Engineering
Knowledge
Discovery
- Even as simulation datasets have been growing at an exponential rate,
the capabilities of the natural human visual system have remained
unchanged. Furthermore, the bandwidth into the human cognitive
machinery remains constant. As a result, we have now reached a stage
where the petascale and exascale datasets critical to the DOE ASCR
mission can easily overwhelm the limits of human comprehension.
Over
the past 30 years, computerized techniques for visualizing information
have concentrated on incrementally improving techniques for the
graphical display of data. While these improvements have extended the
field of visualization, they have concentrated on only a small part of
the problem that scientists and engineers face. To enable the creation
of a visual analysis, reasoning, and discovery environment targeted at
peta- and exascale datasets, we need research to develop a better
scientist-computer interface— the nexus of cognitive science, effective
visual presentation of information and data, usability analysis and
optimization, methodologies for exploring and interacting with large
and complex, hierarchical, multimodal, and possibly incomplete and
conflicting data.
Advances in the
area of the scientist-computer interface will have a profound, positive
impact on our ability to gain knowledge and understanding from data of
increasing size and complexity and on our ability to perform hypothesis
testing and knowledge discovery in peta- and exascale data, and will
fundamentally change our understanding about how humans perceive and
gain knowledge from large, complex data. Research directions in this
area include formal usability studies and analysis across diverse
domains such as code, data, and graphics interfaces; alternative
display technologies; quantitative analysis and optimization of
workflow; mappings from data to visual representations; and inclusion
of cognitive principles into the visualization and data analysis tools.
One approach to
improving interaction could be through a common interface across
multiple tools. Ideally,
this new technology would result in reusable
user interfaces that enable intuitive and interactive exploration and
discovery—for example: interoperable user-interface libraries
that
contain widgets having a common look and feel that are specifically
intended for large-scale data exploration yet usable by multiple
applications. One design objective is interfaces that capture the best
interaction methods to support data reduction, feature extraction,
querying, and selection. These interfaces should also support
synchronous collaborative interaction between multiple users who may be
separated by great distances.
Collaboration
-
Today’s scientific research
is inherently distributed, with science
teams often consisting of researchers at universities and national
laboratories around the country or around the globe. A new generation
of visualization and data exploration tools are needed to significantly
enhance interaction between these distributed scientists, their data,
and their computational environments.
Also needed is a
collaboration infrastructure that supports both asynchronous and
synchronous collaboration. Asynchronous collaboration
infrastructure
might include large-scale equivalents of wikis, blogs,
mashups, and other emerging social networking
tools. Synchronous
collaboration infrastructure might include context- and location-aware,
persistent visualization and collaboration environments. These
environments should seamlessly display information from both local and
remote sources, while simultaneously providing an environment that
fully exploits local capabilities without lowering the experience to
the lowest common denominator.
It is also
necessary to deal concurrently with both distributed human-human and
distributed human- computer interactions. The ideal would thus
be
environments allowing remote and local participants alike to
effectively participate in real-time computation, visualization, and
data exploration. Unfortunately, little infrastructure is currently
available to enable graphics and visualization developers to build
tools with such collaborative capabilities. A clear need exists for
both “building blocks” to allow these developers to create effective,
interoperable, collaboration tools. And the tools themselves are
central to the scientific enterprise, enabling distributed teams to
make the discoveries of the future.
Quantitative
Metrics
for
Parameter
Choices
- The fundamental process of visualization involves choices of
parameters for queries of different types. Examples are the selection
of spatial and temporal scales, transfer functions, and lighting and
camera parameters. To glean insight into a scientific dataset, the user
often needs to go through a lengthy, sometimes prohibitively expensive,
process to obtain a large ensemble of visualization results.
Quantitative feedback about
the choice of visualization parameters is
crucial for streamlining visual analysis. Techniques are needed to help
scientists quickly narrow down the immense parameter search space,
identify salient features, and decide the right level of detail in the
data to perform further investigation. Also needed are metrics
to help
users understand the tradeoff between the computational cost and the
information gain, and the completeness of the visualization results.
The users need to be informed not only about what they have seen but
also about what they have not yet seen.
Supporting a
Basic Research Program
Infrastructure
for Successful Research
The following
topics are seen as critical to a successful R&D program in
visualization and knowledge discovery:
- Collaborative
software
process.
Research teams are becoming distributed and larger. Thus, software
processes that support distributed collaboration are essential.
Furthermore, such processes must facilitate the development of stable
systems that are thoroughly tested and managed.
- Data
repositories. Visualization
and analysis researchers typically are starved for example datasets.
Often simplistic data is used to initially develop computational
techniques; however, in many cases this data is not representative of
the targeted applications. Thus the computational community must be
encouraged to gather, distribute, and manage representative datasets to
help enable creation of effective computational methods.
- Toolkits
and
reusable
components.
Many researchers use standard toolkits and applications on which to
base their research. These have the benefit of accelerating research
because such foundational elements do not have to be recreated, and
researchers can focus on the particular problem at hand. Creation of
standard toolkits should be encouraged within the community to help
continue this tradition.
- Open
science.
The practice of science requires the ability to recreate the results of
experiments. It also implies full disclosure as to the methods and data
used to generate the results of an experiment. In the computational
sciences this means access to data, source code, and publications. It
is imperative that the practice of open science be employed to ensure
the full benefit of scientific funding.
Fostering
Education
Integrating
Basic Research Programs
Interagency
collaborations
International
partnerships and collaboration
Centers of
excellence in infrastructure and education
This very recent
paper is also interesting reading:
Visualization
at
Supercomputing Centers: The Tale of Little Big Iron and the Three
Skinny Guys
E. Wes Bethel,
John van Rosendale, Dale Southard, Kelly Gaither, Hank Childs , Eric
Brugger, Sean Ahern
January 13, 2011
http://vis.lbl.gov/Publications/2011/skinnyGuys.pdf
Coming
Next Time
Project 1
Review
Coming
the Week after that
Julian
will tlk about CoreWall and Core Drilling on the 15th
Alessandro will talk about Looking Glass and the Lake Bonney Antarctica
project on the 17th
last
revision 2/1/11