The data we will use comes from the Great Lakes Observing System
http://www.glos.us/thredds/catalog.html
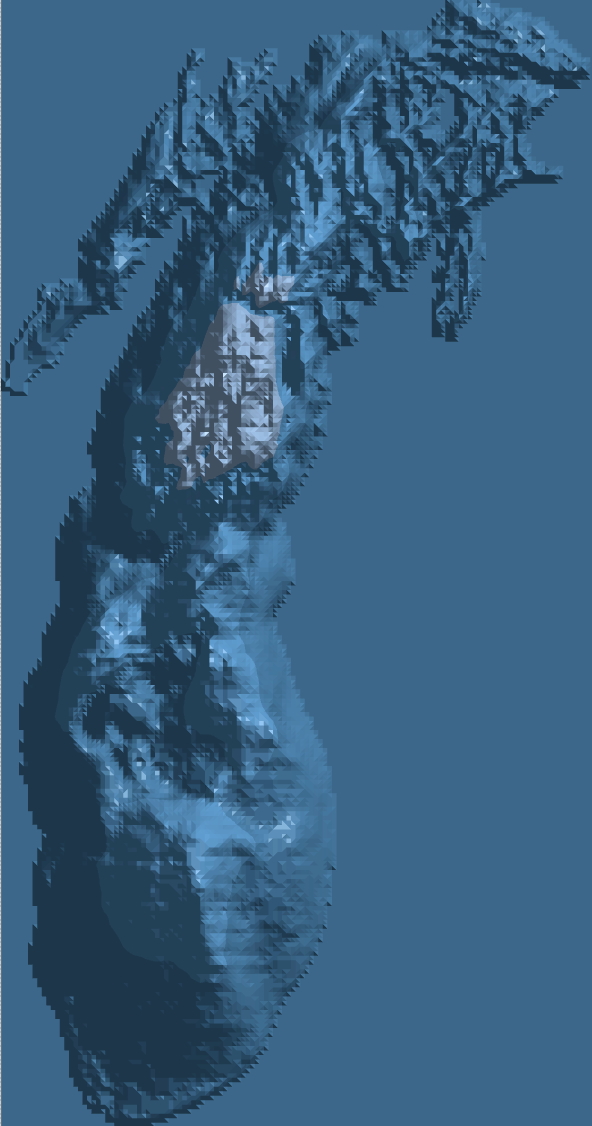
In particular we will be looking at the Lake Michigan History 3D data
In this dataset Lake Michigan is represented by a 250 x 130 grid (2km
square grid cells) with 18 depths
A general overview of Lake Michigan can be found on wikipedia at
http://en.wikipedia.org/wiki/Lake_michigan
Some quick facts: Lake Michigan is 494km by 190 km with an average
depth of 85m. The deepest point is 281m.
There is data for the years 2006 through 2010 including temperature and
horizontal water velocity every 3 hours, which gives a nice amount of
data.
You job is to create an interactive visualization tool to let the user
investigate this data.
You will use vtk
in connection with a user interface toolkit of your choice to implement
the project. You will need to be able to show this app in the classroom
so be sure you have it running on an appropriate machine.
The application
you develop should help the user investigate questions about
Lake Michigan. You shouldn't be thinking of the application as the
end
product but as a means to get to the end product, which is knowledge,
so its important that your application be easy to use and produce
visualizations that are easy to understand.
One of the requirements to
get an A is to use your tool to find some interesting things in the
dataset.
You can store
the data in any way you prefer that gives you sufficient performance
AND is sufficiently portable that andy can easily make your application
run on his hardware. Databases are fine, on line storage is fine, flat
files are fine.
Once you have this working, take a look at the data with your own
application. Do you see anything interesting? Are there any patterns
that show up? Given that you have
this visualization too, what interesting things can you find in the
data using your tool? What features show up better with different types
of visualization?
You might find some things to look for at the
epa
and also the
summary
of pressures for Lake Michigan and
You should
create a set of web pages that describe your work on the project. This
should
include:
- 1
page on
how to install your app starting from "I have a web browser on my
computer." You should provide links and clear instructions on
everything needed to get your application running. You should also
provide links to your well documented souce code on this page.
- 1 page on
the data you used including where you got it, what you did to it.
- 1 page on
how to use your application and the things you can do with it.
- 1 page on
what interesting things you found using your application.
all of which
should have plenty of screenshots with meaningful captions.
You should also create a 2-3 minute video showing the use of your
application including narration with decent audio quality and that
video should be linked to your main project web page.
I will be linking your web page to the course notes
so please send me a 320 x 240 jpg photo of your visualization for the
web. This
should be named p2.<your_last_name>.jpg. Web pages like this can
be very helpful later on in helping you build up a portfolio of your
work when you start looking for a job.
Each student
will bring his / her visualization to class to present it and describe
its features to the rest of the
class. This allows everyone to see a variety of solutions to the
problem, and a variety of implementations.