For this project you will use OmegaLib and osgEarth to display data about the Chicago area in CAVE2. You will create a 3D environment in the CAVE and map data onto that environment.
You have been given the assignment of creating the crime computer for Chicago's new resident superhero. Da-El came to Earth from a highly sophisticated alien world with a clean and modern public transit system. Using the name χ-guy ("chi-guy"), Da-El fights a never ending battle for truth and justice, and always takes the CTA instead of flying or driving in the city.
Some data sources to get you started:
City of Chicago Data Portal - https://data.cityofchicago.org and a good starting point is https://data.cityofchicago.org/Public-Safety/Crimes-2001-to-present/ijzp-q8t2
CTA Train Tracker API - http://www.transitchicago.com/developers/traintracker.aspx
CTA Bus Tracker API - http://www.transitchicago.com/developers/bustracker.aspx
The Rail and Bus routes are available in the KML files if you parse the files manually
and a nice place to look for osgearth sample files:
https://github.com/gwaldron/osgearth/tree/master/tests
To get a C on the project ...
- Your application should start by showing the Chicago area as a 3D interactive environment in the CAVE
- Allow the user to easily navigate through the space, rescale the space, rotate the space
- it should be easy to get an overview of the city
- It should be easy to fly to a particular location
- The user should be able to switch between different map backgrounds - at minimum a map version and an aerial photo version
- Map the major crime types from the 2013 Chicago Crime Data
onto the environment
- allow the user to filter by type of major crime
interactively
- show locations of individual crimes
- break the city into zones and show the number of crimes in those zones
- show amount of crimes in a zone as a function of the time
of day, day of week, and season of the year
To get a B you need to add ...
- Have a menu that allows the user to jump to different neighbourhoods quickly
- Show the data from 2001 through 2013 and allow the user to pick a particular year or aggregate all the years
- Make appropriate use of audio in your application
To get an A you need to add ...
- Use the 2012 crime data as simulated real time data for 2013 (i.e show the data from last year at the same date and time) as though it was happening now
- Show the CTA L lines and integrate the real-time CTA train location feeds to show the current locations of all the CTA L trains in the city
- Impress Me
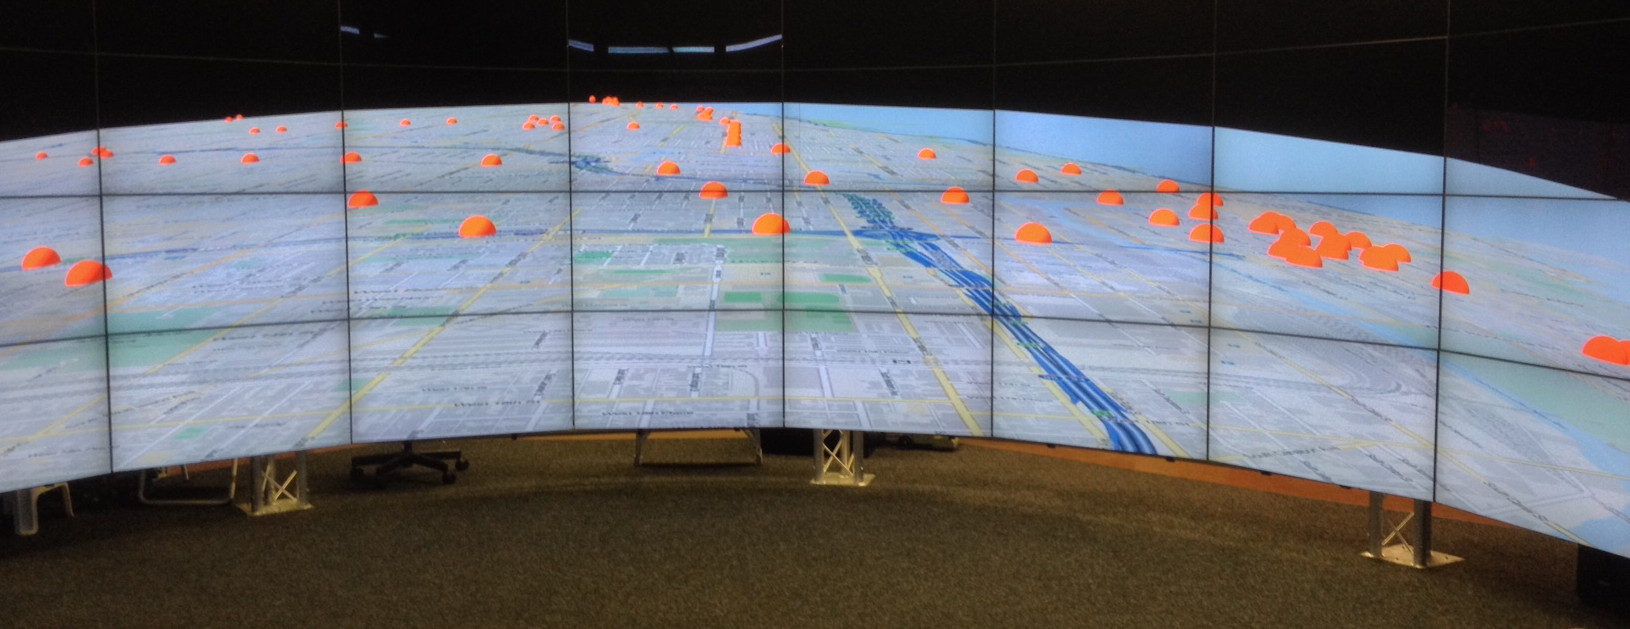
Here is some
omegalib code to get you started. This code loads in a list of
latitude and longitude locations for the CTA L stops and
displays them on osgEarth using omegalib in the cave.
and if you are interested, here is some simple code to start off with the entire planet.
and if you are interested, here is some simple code to start off with the entire planet.
There is a data component to the project -
grabbing the static data and getting access to the dynamic
data, then filtering it, and getting it into a form that can
be visualized efficiently. Then there is the visualization and
interaction component. These two parts affect each other, so
its a good idea to work on them both in parallel.
I will be holding office hours after class in the cave so people will have some time to test out your work. These sessions tend to get very busy near the deadline so its a good idea to start early.
I will be holding office hours after class in the cave so people will have some time to test out your work. These sessions tend to get very busy near the deadline so its a good idea to start early.