Another
major use of computer animation is in scientific visualiation.
In
CS 526 When I talk about scientific visualization it is typically
interactive visualizations where the user is dynamically manipulating
the visualization to gain insight into the data. When the data is time
varying it can be very useful to watch the visualization evolve in
time.
Here
is a nice set of notes on visualization to get you started:
http://www.cg.tuwien.ac.at/research/publications/2005/Viola-vistutillustrativevis/
Here
visual realism is not important, rather the focus is on using motion to
make it
easier to see patterns.
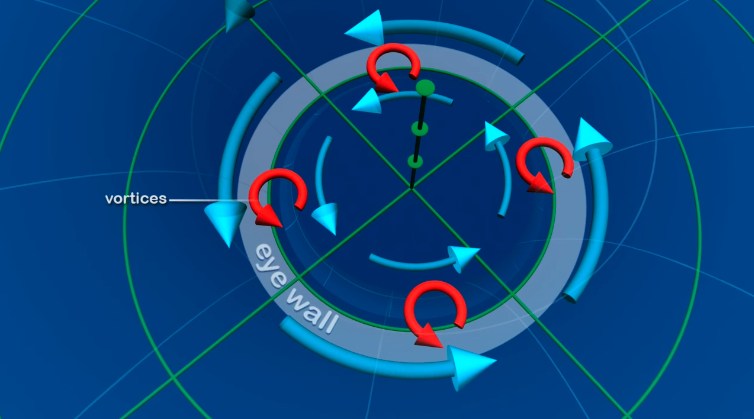
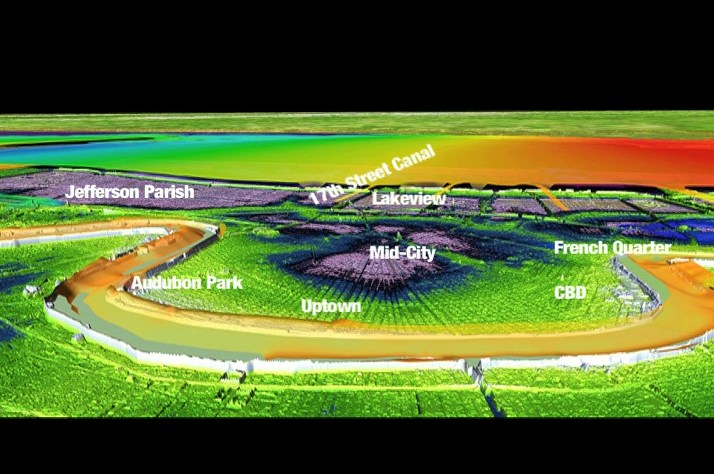
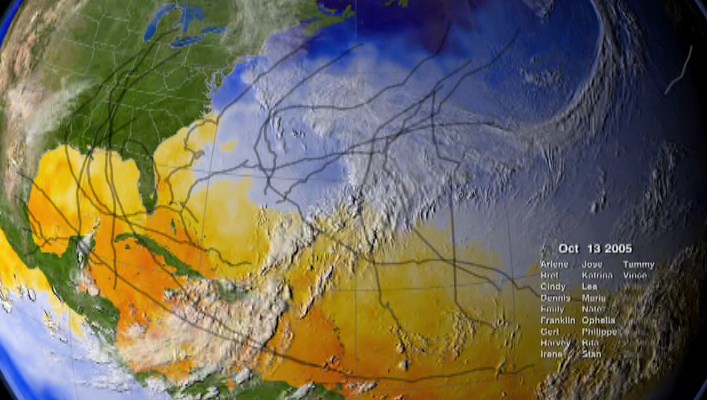
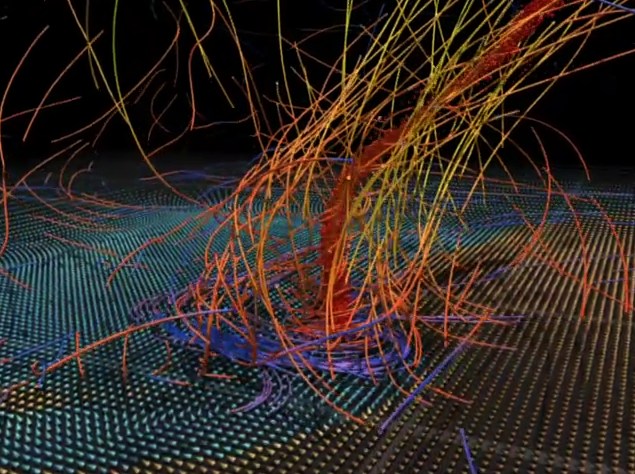
These
four examples deal with similar phenomena, but use computer animation
in different ways to show different things. The Computer Graphics II
course deals with the creation of scientific visualizations, but more
from an interactive point of view. In these cases where the goal is a
non-interactive movie, more computation power can be used, appropriate
camera positions can be chosen, and the experience of the creator can
be leveraged.
What Makes a Good Graphic
So lets take a look at some current visualizations.
As
you watch these for the first time, thing about what you learned that
first time. Then as we watch them again, think about how the
visualization is trying to help ou understand these complex phenomena.


Here
is a nice NASA page with many current animations:
http://svs.gsfc.nasa.gov/
Project
1
Presentations