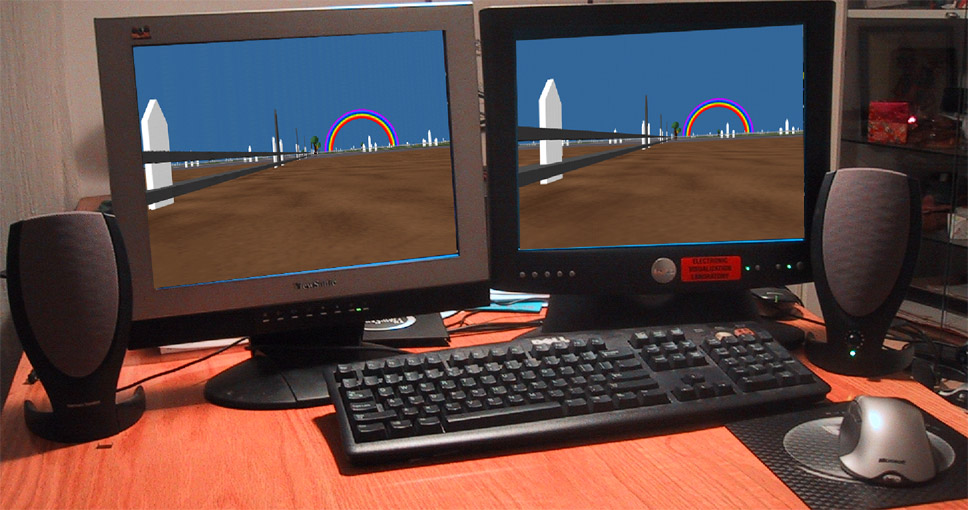
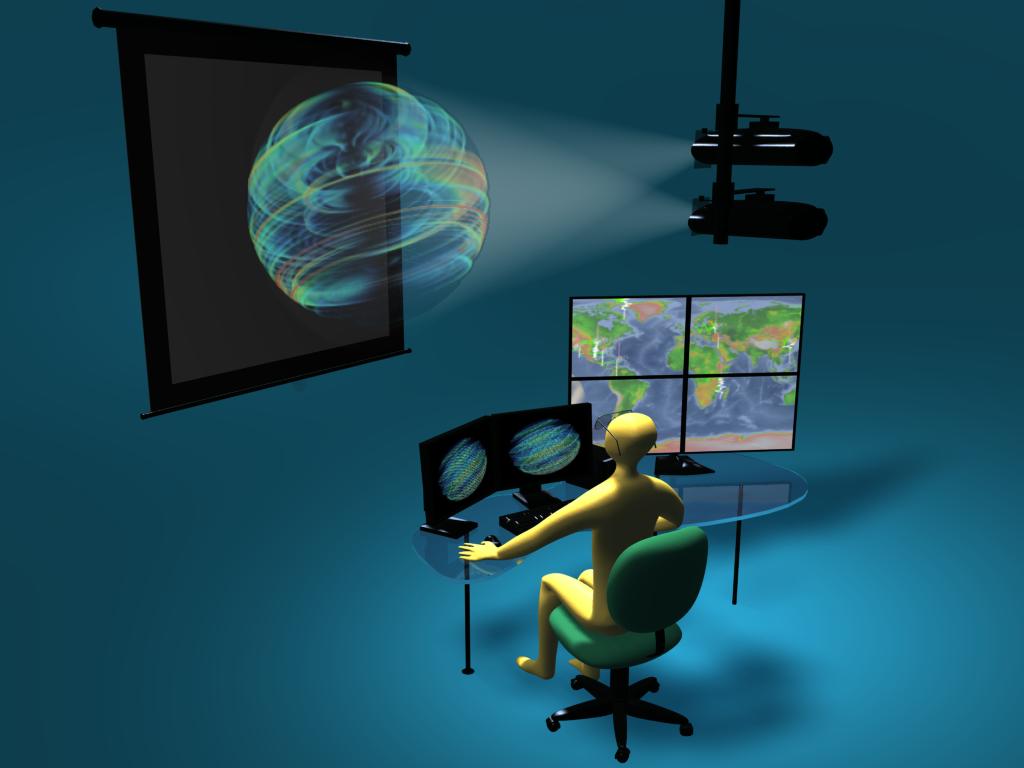
- Allows you to have one wide desktop spread over 2 displays
• Draw left eye view on one display, and the right eye view on the other display
• Filters in front of projectors polarize the light that reaches the screen
• Viewers wear lightweight glasses with filters so
the right eye sees only the right-eye image and the left eye
sees only the left-eye image
PC graphics card with 2 outputs
from around 2000.
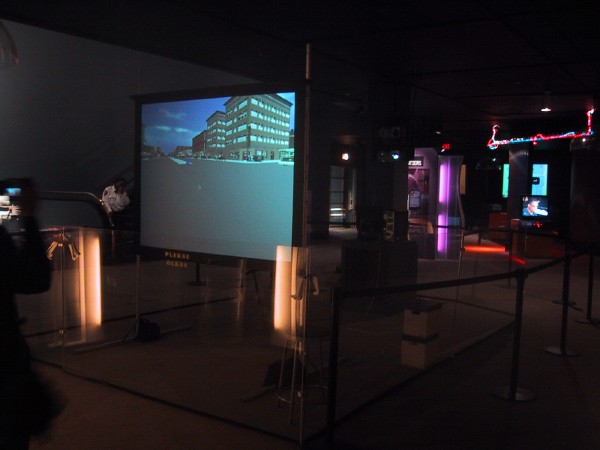
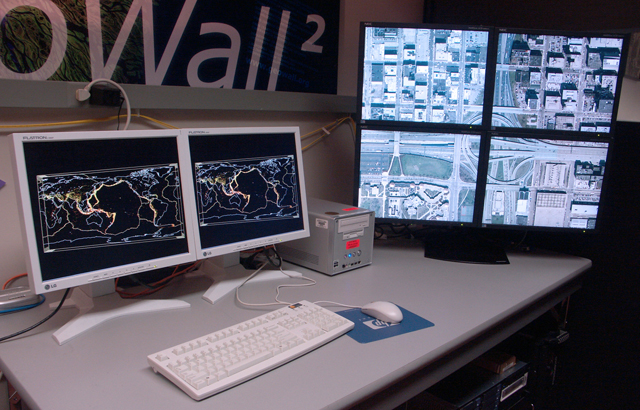
Temporary GeoWall setup at the Museum of Science and Industry
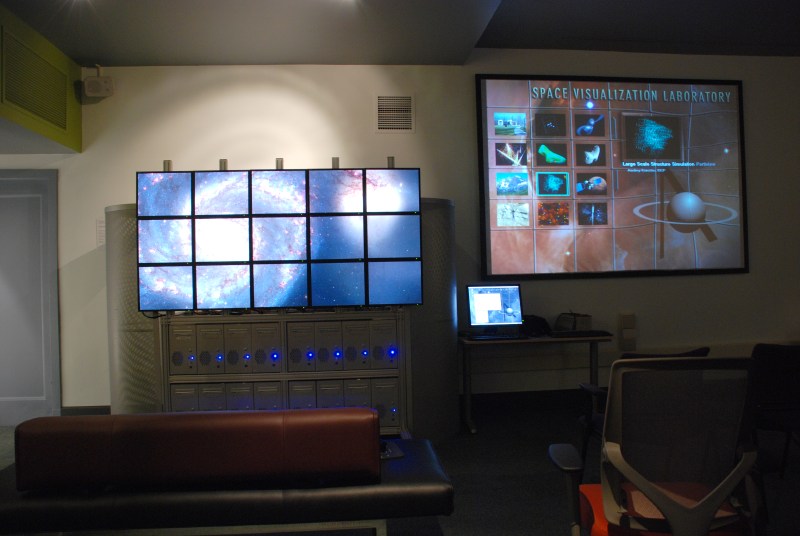
The Adler Planetarium has two permanent GeoWall
setups - one on the exhibits floor and another in the Space
Visualization Laboratory along with a tiled display
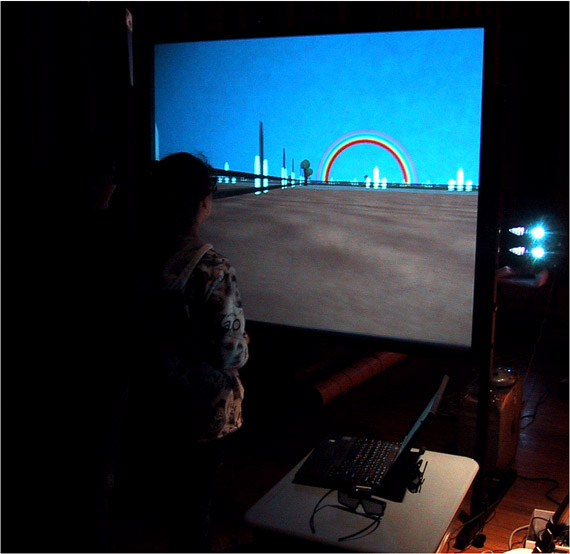
Temporary GeoWall setup at Abraham Lincoln Elementary School
But that's not all ... there is typically enough
room in even the shuttle PCs for more graphics cards to drive a
small tile display as well as a passive stereo display so people
can view 3D data and high resolution 2D data simultaneously from
the same computer.
Today there are quite a few flat screen 3D televisions
for sale which can also be used to display stereo content. The
typical issues of projectors vs flat panels remain.
Projectors can generate an image as large as the polarizing
screen or wall surface you have available but will be
dimmer and lower contrast that the flat panels.
The GeoWall has a fairly large footprint and typically
resolution for each projector. This works well for a classroom,
but less well for single investigator with high-resolution
3D data. One solution to these problems is a smaller version of
the PARIS called the ImmersaDesk 4 which we built in 2004. The
ImmersaDesk4 made use of two 2560x1600 30" monitors, a
half-silvered mirror, and passive stereo driven by a single PC. An
optional tracking system allows for head/hand tracking.
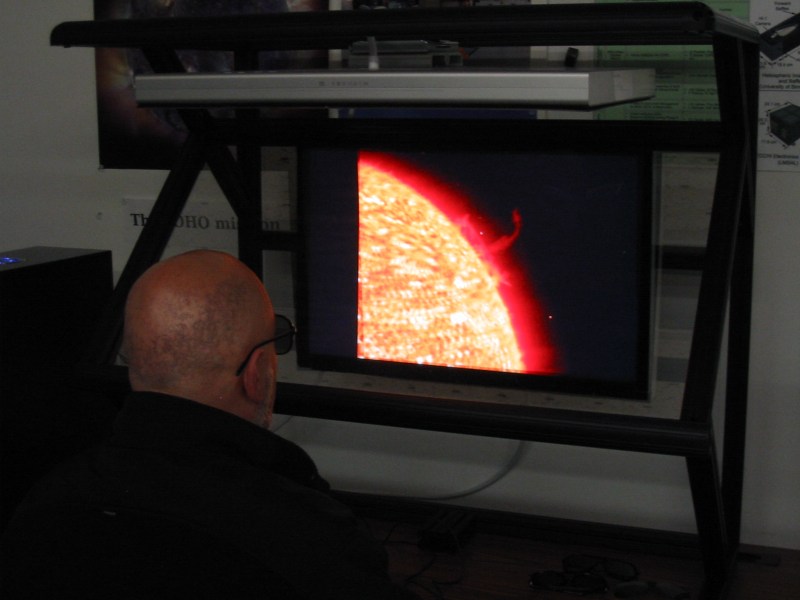
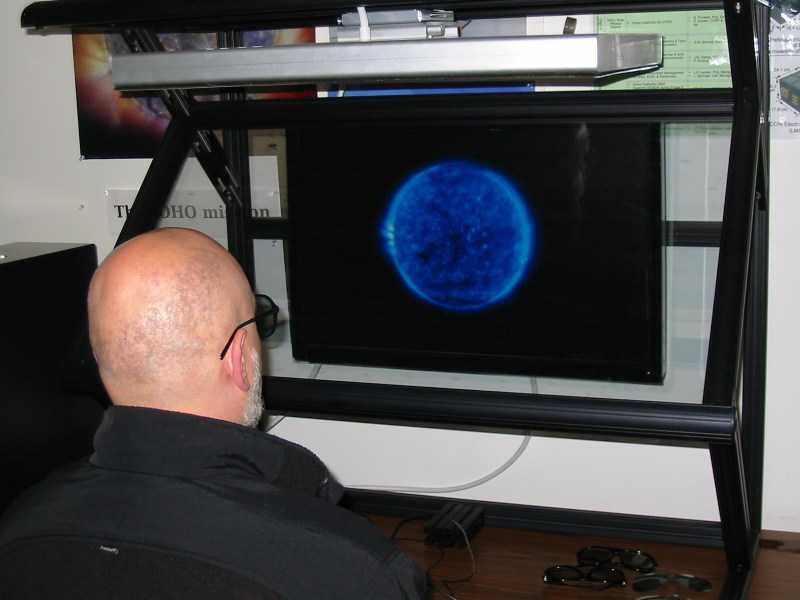
These photos show an ImmersaDesk4 built at the Naval
Research Lab for the STEREO project to look at stereo photographs
of the sun (and compare them to simulated modes.)
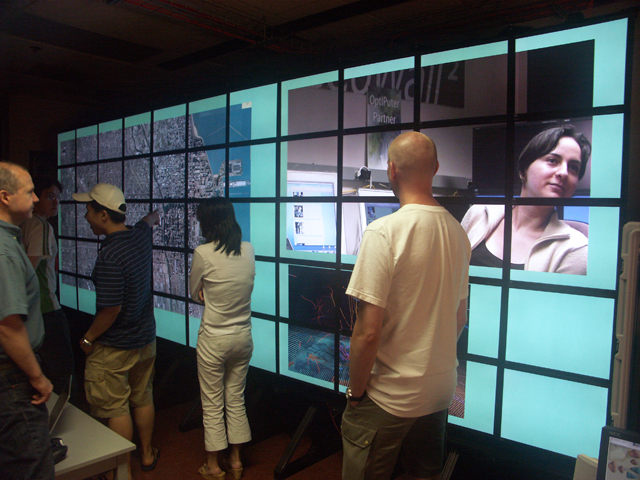
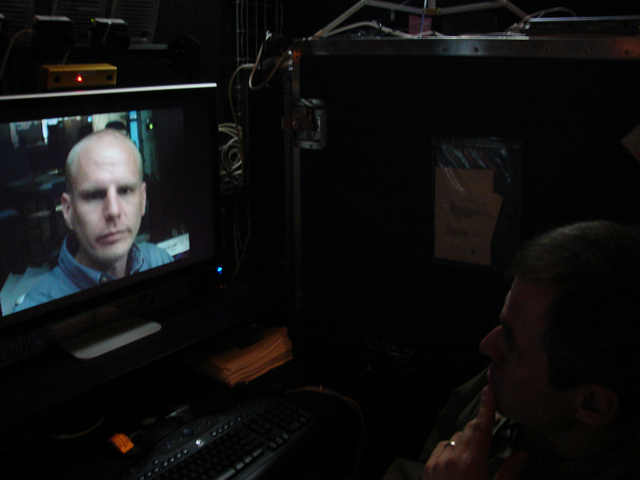
All of these devices are designed to take advantage of fibre optic networks through the OptIPuter research. These networks allow you to create dedicated 10 gigabit links between computational resources and visualization resources.
These kinds of links allow us to separate the data used for visualization, the visualization generators, and the display into three separate sites linked by high-speed high-bandwidth networks.
These kinds of resources are needed because there is so much data to visualize in certain disciplines.
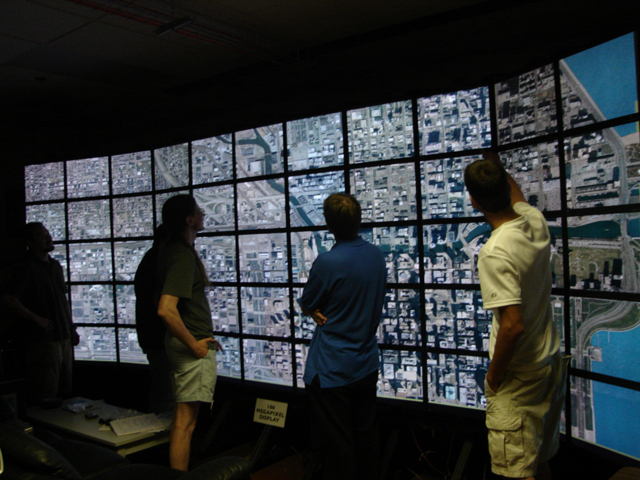
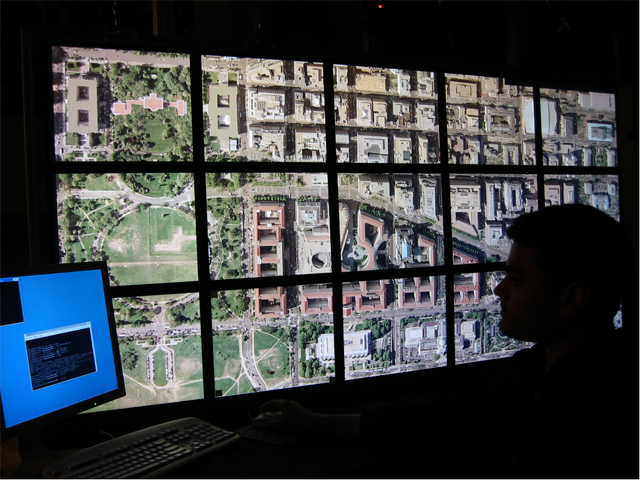
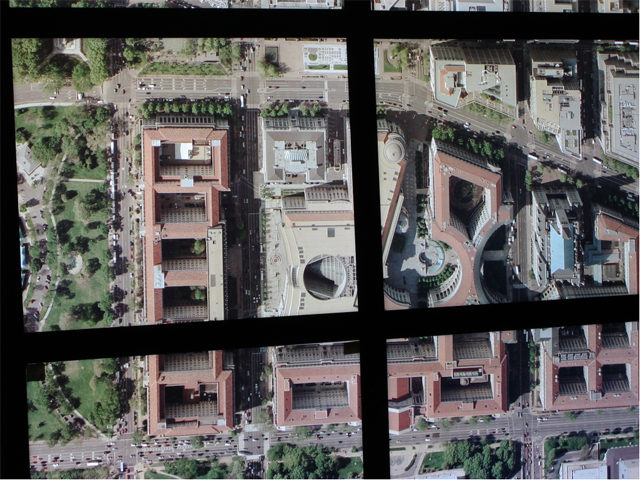
The US Geological survey has 51 terabytes of aerial photographs of 133 urban areas in the US at 1/3 of a meter resolution per pixel. This generates maps at resolutions such as 365,000 by 365,000 pixels.
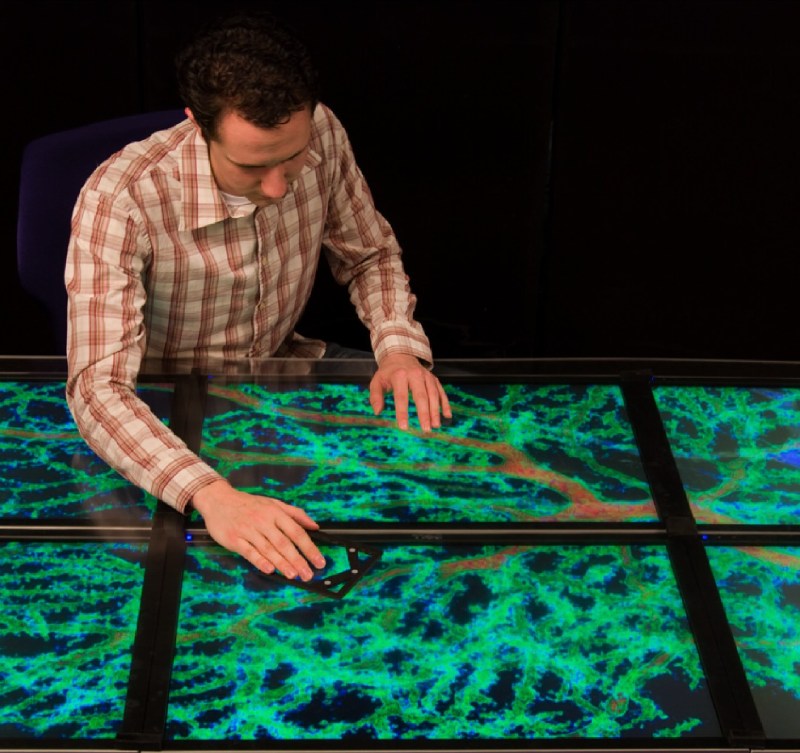
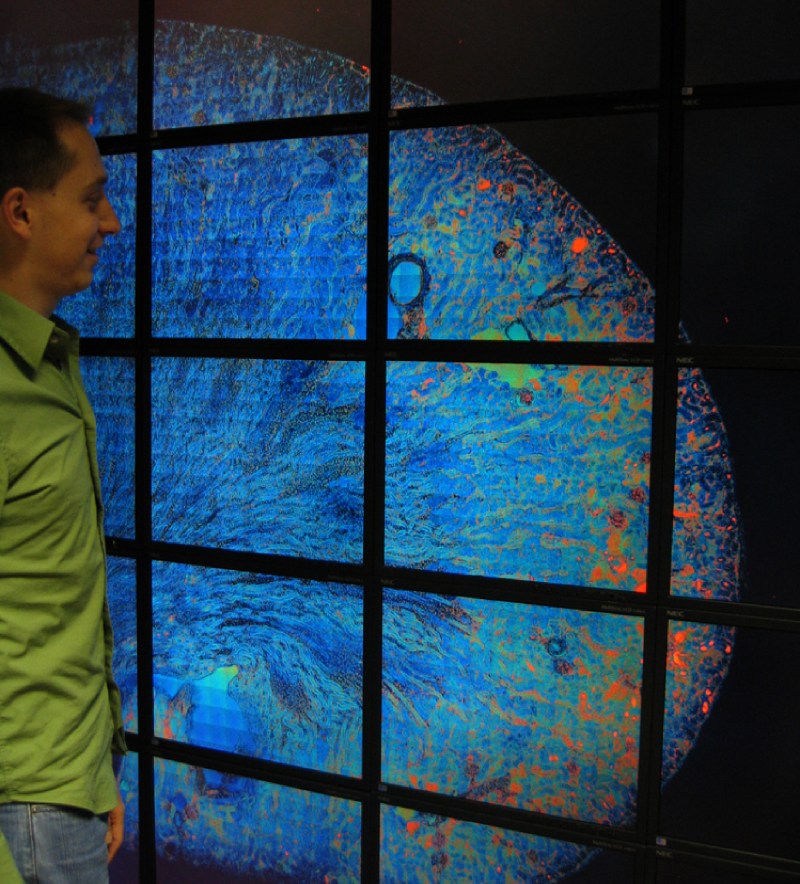
NCMIR studies rat brains with microscopes generating images of 4000 by 4000 pixels that are then put together to generate montages of 43,200 images.
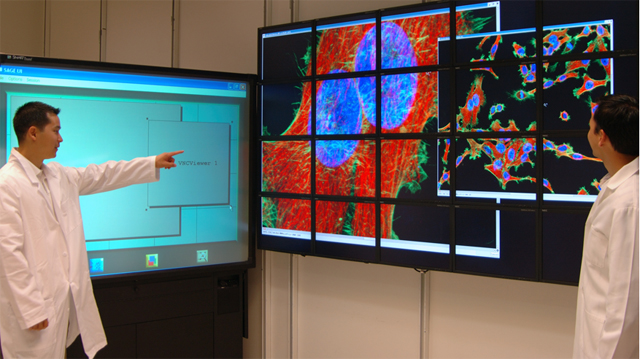
Or even larger montages of a rat kidney
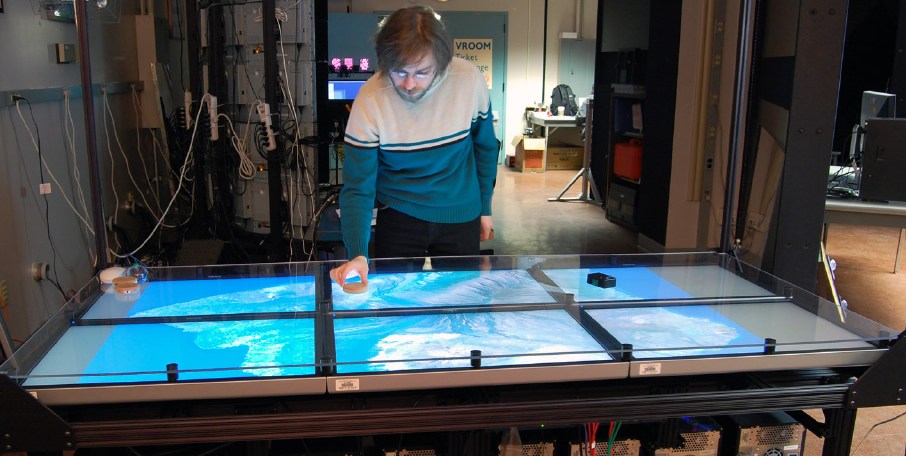
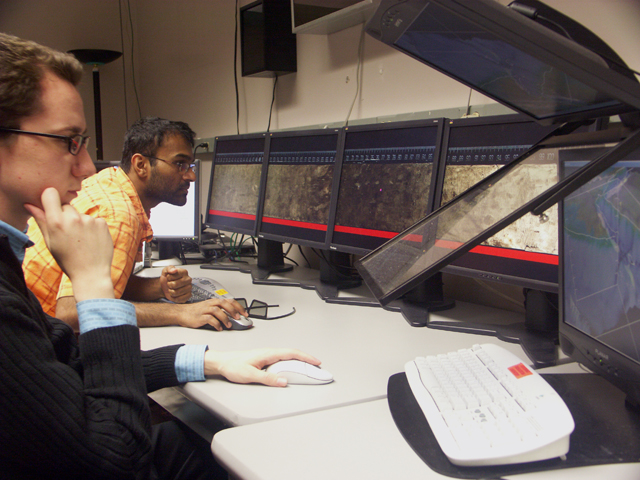
Core Labs take core samples from ice, lakes, and the
bottom of oceans ending up with over 300 km of core samples,
that are being scanned at 100 dpi. This technology was used in
Antarctica as part of the ANDRILL Project in 2006 and 2007.
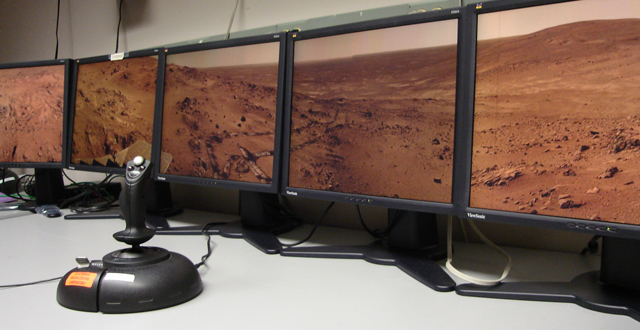
We are prototyping a similar setup for use at the Adler Planetarium for patrons to view the panoramic images from the recent Mars missions
Large high resolution displays
allow researchers in these disciplines to see both detail and
context at the same time. The high-speed high-bandwidth networks
allow the data or visualizations of the data to be moved from
storage locations to display locations quickly.
from techradar.com
Before next
class please read the following paper:
Project 2 Presentations