Electronic Visualization Laboratory (EVL),
Computer Science, University of Illinois at Chicago (UIC)
Embedded Phenomena for Inquiry Communities (EPIC)
Project work and subsequent dissertation work is positioned under a multi-year National Science Foundation (NSF) research program called Embedded Phenomena for Inquiry Communities (EPIC) . A primary emphasis of the EPIC research program is concerned with how to support a classroom learning community working together in creating, maintaining, accessing and applying a collective “knowledge base” (Moher et al., 2015; Slotta, 2013) in their investigation of simulated scientific “embedded” phenomena within their classrooms (Moher, 2006). Scaffolded by the use of tablet computers, large display applications, and “smart classroom” technology frameworks.
Citations
- Moher, T., Slotta, J. D., Acosta, A., Cober, R., Dasgupta, C., Fong, C., et al. (2015). Knowledge construction in the instrumented classroom: Supporting student investigations of their physical learning environment.
- Slotta, J. D., & Najafi, H. (2013). Supporting collaborative knowledge construction with Web 2.0 technologies. In Emerging technologies for the classroom (pp. 93-112). Springer, New York, NY.
Resources:
Knowledge Places | Dissertation
This research investigates a novel approach to supporting classroom learning communities. The idea is that it embeds community knowledge within the physical space of the classroom, with the aim of mediating opportunistic inter-group interactions, instigated through proximity and shared artifacts. Through ubiquitous computing, proxemic interaction, tangible computing, and ambient visualizations.
Knowledge Place “terminals” are located around fixed locations around the classroom making inquiry activities and emergent community knowledge salient. Each terminal represents all the aggregated knowledge for a particular theme or topic.
Associated Publications
- Perritano, A. (2018). Knowledge Places: Embedding Knowledge in the Space of the Classroom. International Society of the Learning Sciences, Inc.[ISLS]..
- Perritano, A., & Moher, T., (2019, June). Knowledge Places: Embedding Knowledge in the Space of the Classroom. In Proceedings of the 19th International Conference on Interaction Design and Children. ACM.
Resources:
- Disseration Work Knowledge Places Code GitHub
- Disseration Analysis Knowledge Places Analysis Code GitHub
Other EPIC Research Project Work
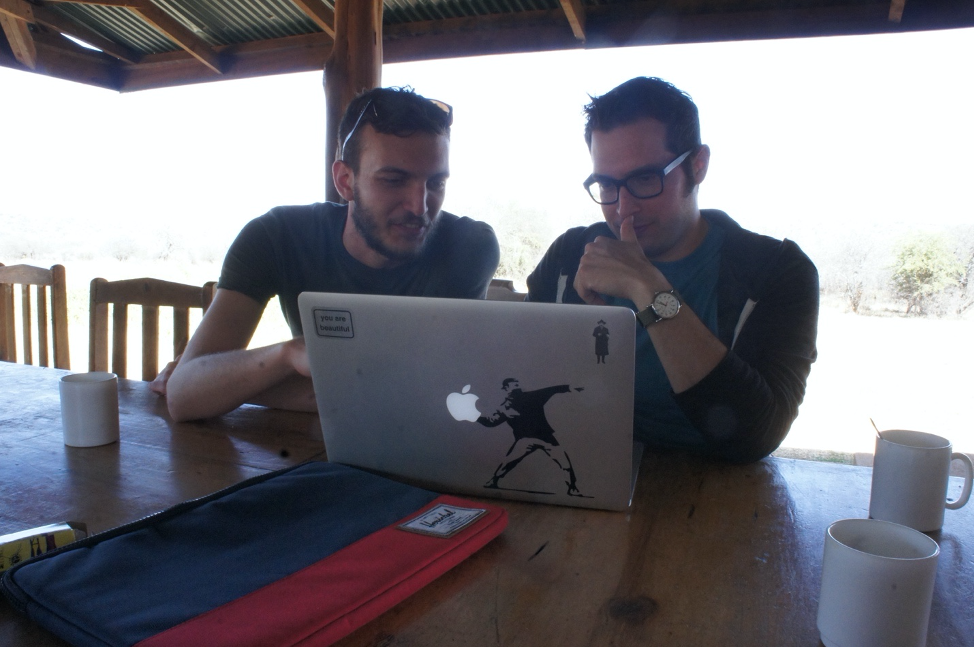
I was deeply involved at all levels of the EPIC research program from a co-designer of the curriculum units with teachers and other researchers, interaction designer and programmer (i.e., tablet-based and web applications, technology frameworks, and server-side architectures), facilitator of the research in the classroom for deployment, organization, and data collection from classrooms in two countries (Chicago, Illinois and Toronto, Canada), and presenter and co-writing to publications for both computer science and learning science conferences. The proceeding projects are a handful of the projects in which I played these roles.
WallCology (Advisors Work)
In Wallcology (Moher, 2006), students are told that there are ecosystems embedded within their classroom walls, including various habitats, species (predators and prey), and vegetation to create food webs. These ecosystems are invisible, except through special “Wallscopes” attached to the classroom walls, where students can see a kind of x-ray view revealing four or more distinct habitats (i.e., one for each wall). The habitats in each wall vary regarding: (1) the specific species and vegetation included, (2) the nature of the habitat, regarding some mixture of bricks and plaster, (3) temperature. Students are tasked, as a “scientific community” to investigate these habitats, developing a knowledge base concerning food web relations, habitat and temperature dependencies, and any other observations.
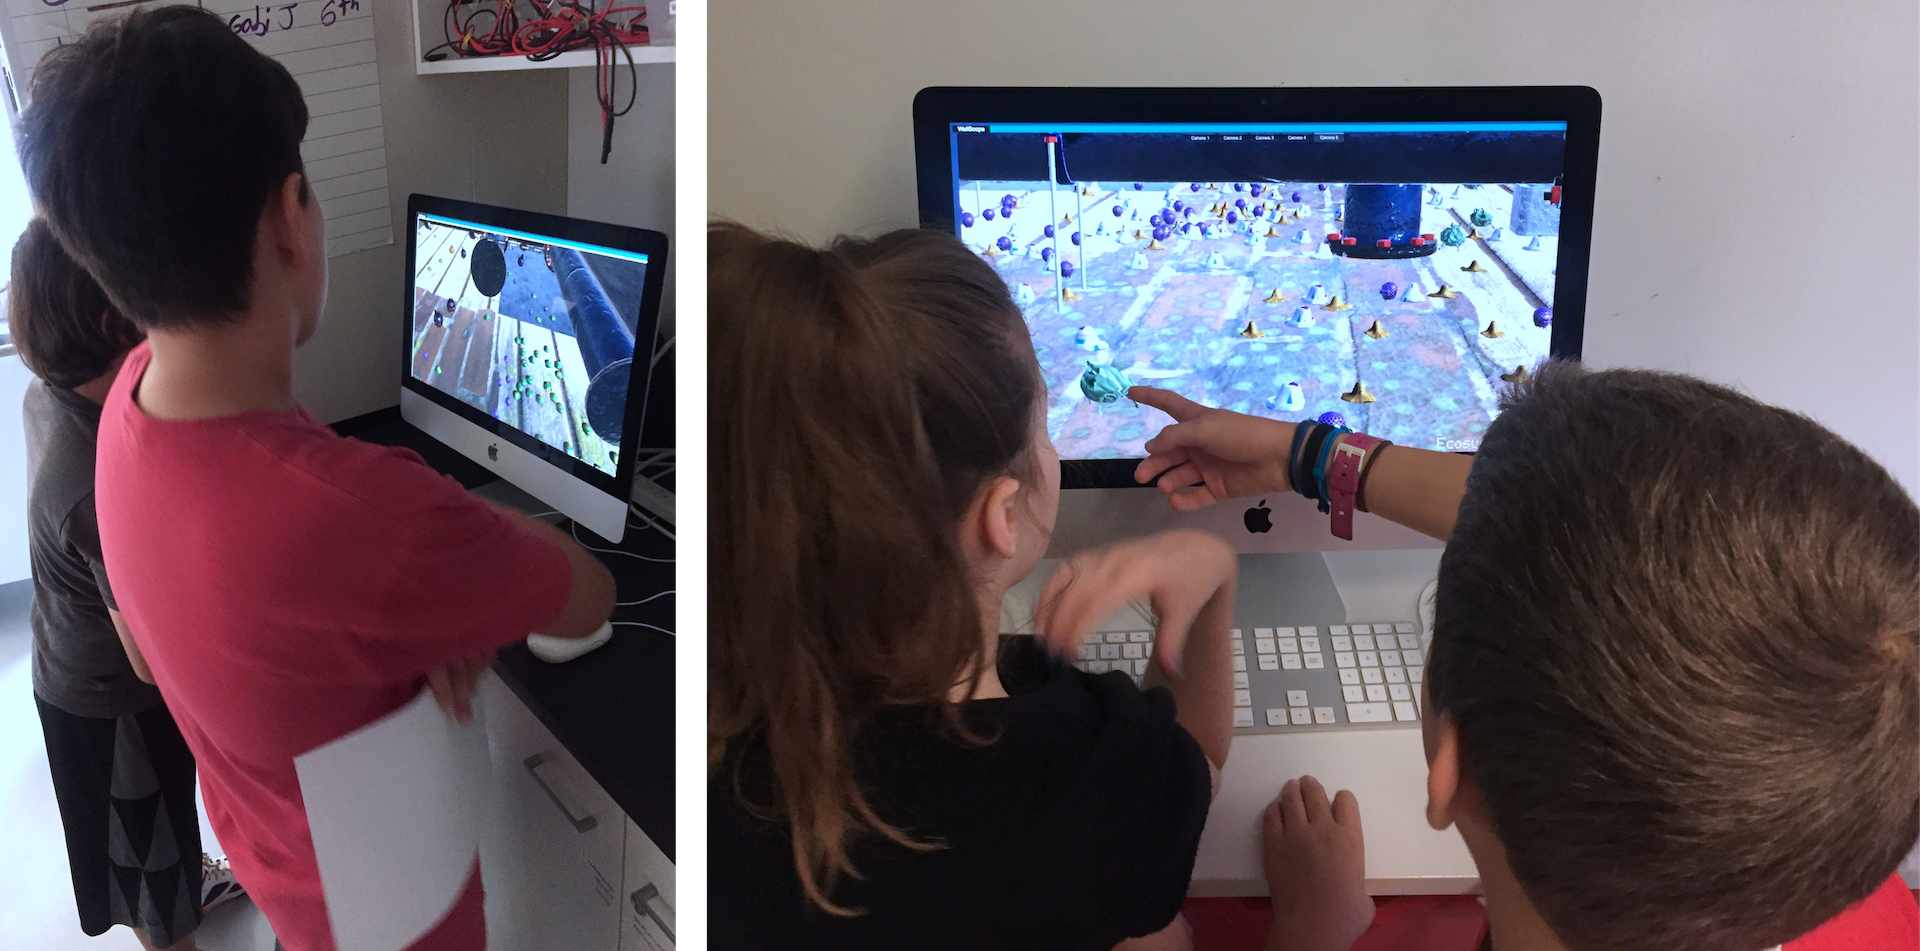
Students observe and investigate species behavior from dynamic ecosystem simulations through ‘Wallscopes’.
Citations
Hunger Games
Students learn game theory through enacting animal foraging behaviors.
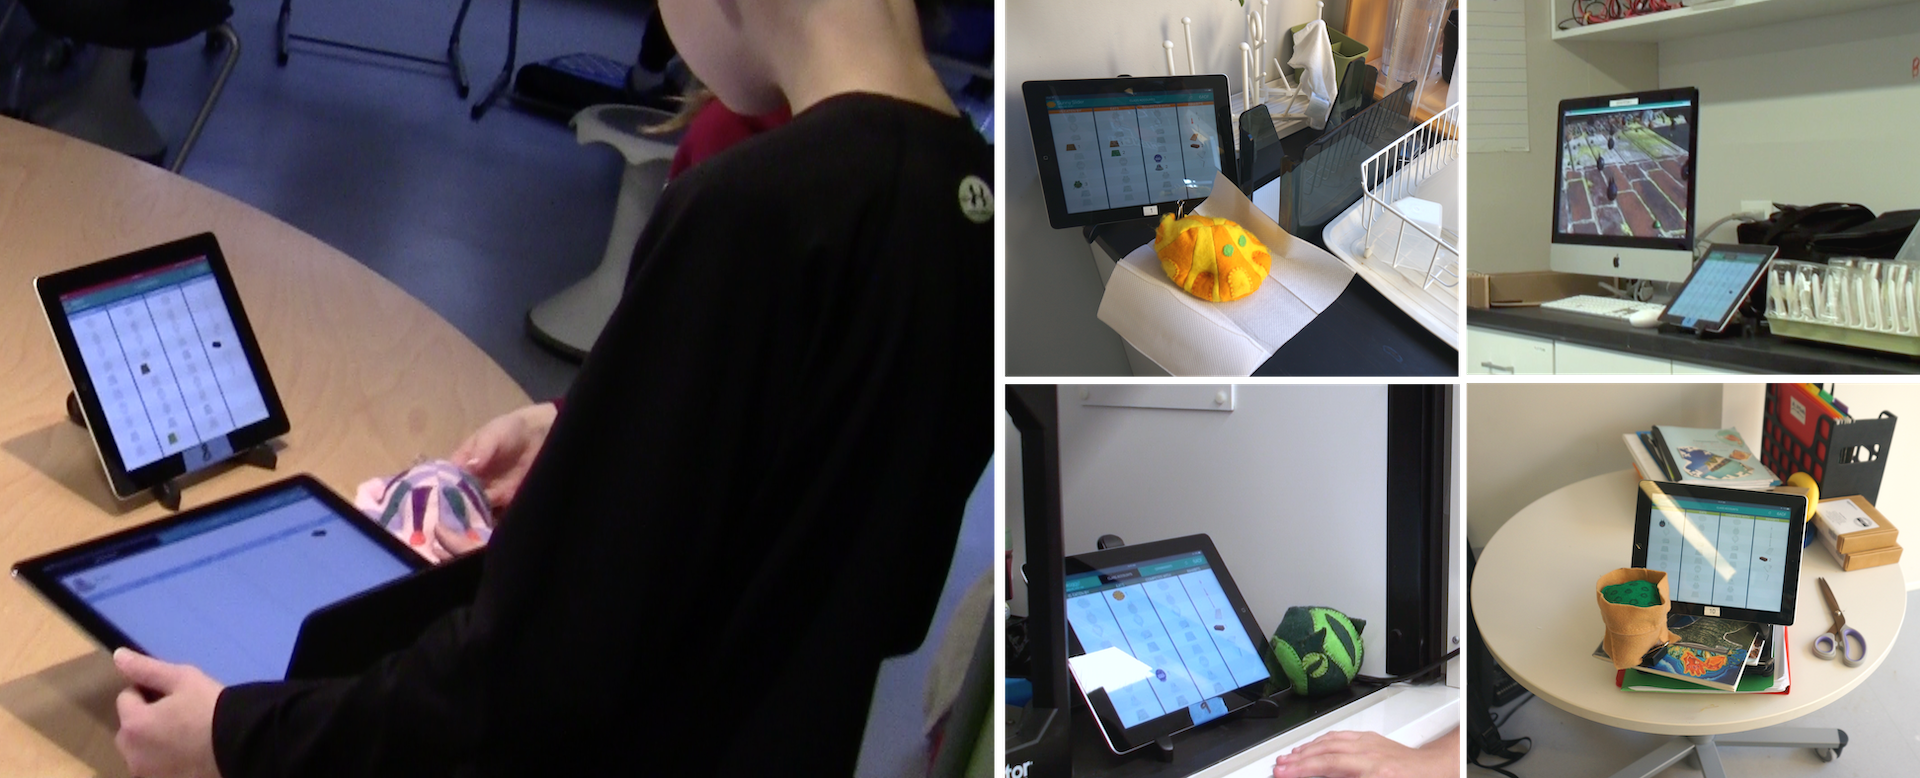
Hunger Games centered on the development of learner understandings of animal foraging behavior. Inspired by traditional teaching practices employing physical simulations, within the unit students engage in an embodied enactment of foraging using stuffed animals (with embedded RFID tags) as tangible avatars to represent their foraging among food patches (with camouflaged RFID readers) distributed around a classroom. Displays situated near the food patches provide students with information regarding the energy gain as they forage and enact instants of game theory within the environment.
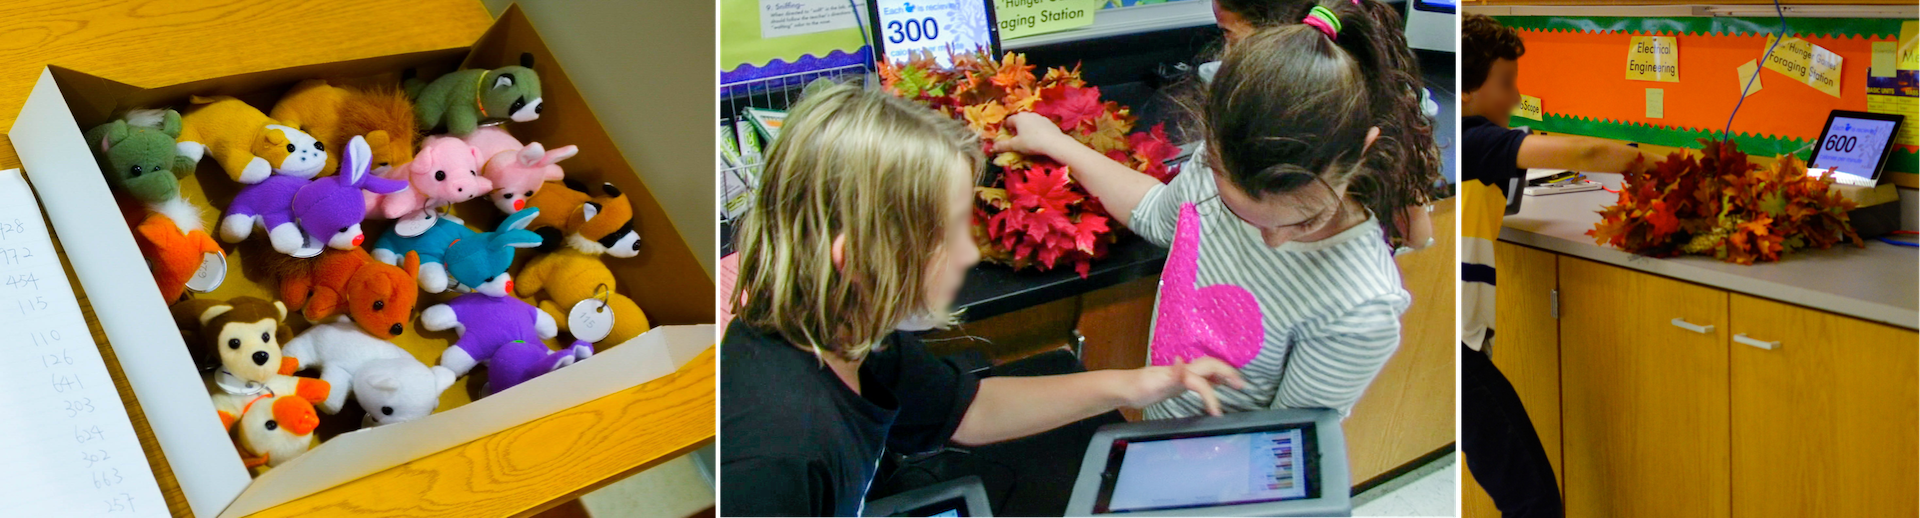
Students situating their avatars at patches to accumulate calories in Hunger Games.
Associated Publications
- Moher, T., Gnoli, A., Perritano, A., Guerra, P., Lopez, B., & Brown, J. (2013). Back to the future (pp. 275–282). Presented at the the 8th International Conference, New York, New York, USA: ACM Press.
- Moher, T., Slotta, J. D., Acosta, A., Cober, R., Dasgupta, C., Fong, C., Gnoli, A., Silva, A., Silva, B. L., Perritano, A., & Peppler, K. (2015). Knowledge Construction in the Instrumented Classroom: Supporting Student Investigations of Their Physical Learning Environment In Lindwall, O., Häkkinen, P., Koschman, T. Tchounikine, P. Ludvigsen, S. (Eds.) (2015). Exploring the Material Conditions of Learning: The Computer Supported Collaborative Learning (CSCL) Conference 2015, Volume 2. Gothenburg, Sweden: The International Society of the Learning Sciences.
Resources:
HelioRoom & SOLAR
Based on Astronomy, HelioRoom – an Embedded Phenomena (Moher, 2006) – digitally maps an orbital planetary system onto walls of a classroom. Students adopt a heliocentric perspective of the solar system and observe dynamic representations of the planets (equally sized, colored circles) though four ambient visualizations (i.e., monitors) during intermittent periods of the day. Students’ work collectively to observe planet occlusion patterns and relative orbital speeds from the phenomena while adding their observations to a collective knowledge base.
The SOLAR instance of HelioRoom ran in a Toronto classroom along with a large “digital poster”; a large vertical multi-touch application in which students were able to create poster-sized representations of their contributions.
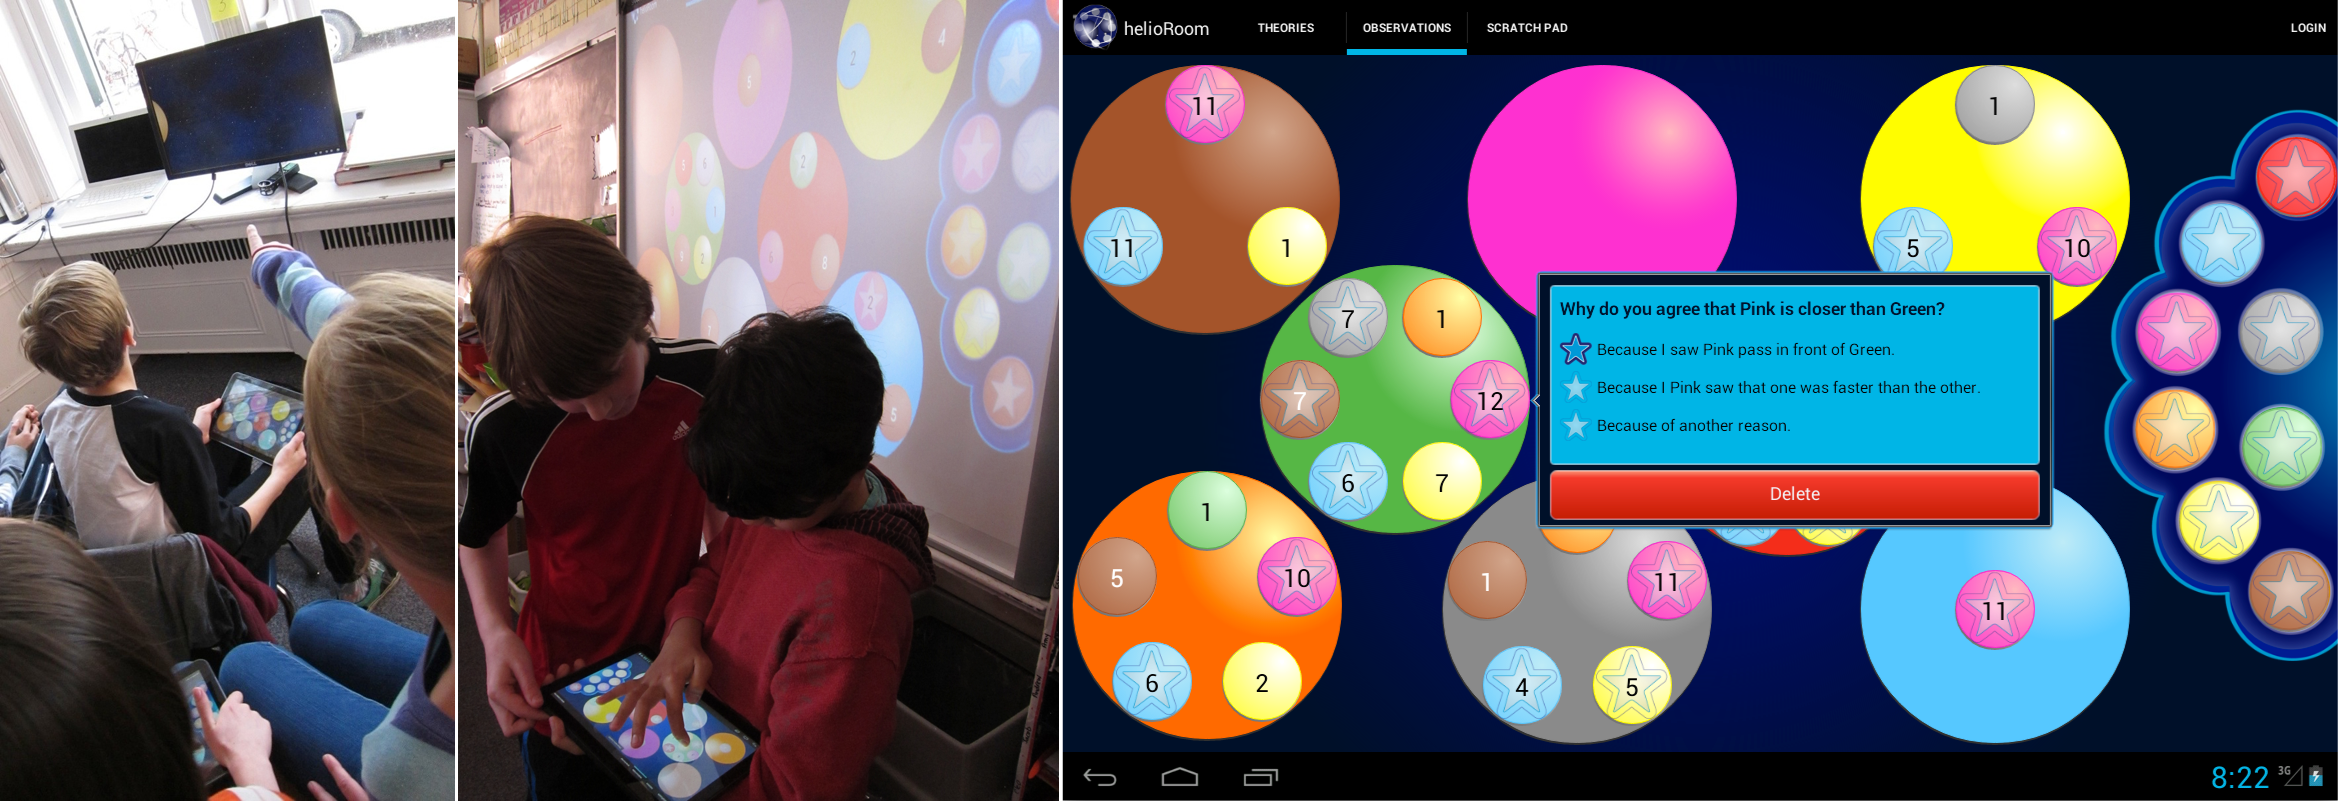
Using tablet based tools and large display smart boards, students create an emergent knowledge base of planet occlusion patterns.
Citations
- Moher, T. (2006). Embedded phenomena: supporting science learning with classroom-sized distributed simulations. the SIGCHI conference (pp. 691–700). New York, New York, USA
- Won the UIC “Best App” award.
Resources:
Neighborhood Safari
Can students enact machine learning algorithms? In Neighborhood Safari, students are loaned motion-detecting field cameras (“camera traps”), which they use to investigate the behavior of animals in their backyards. In our pilot study, students investigated self-generated questions related to food preferences, the presence of scarecrows, the presence of pets, differences between day and night foraging patterns, and others. Tablet (iPad) applications allowed students to filter, sort, and tag their photo sets, create note contributions to a common base in addition to providing aggregated representations of their data.
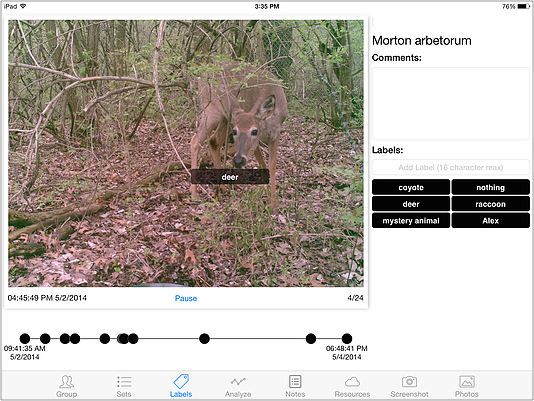
Using tablet based tools, students tag set of camera trap photos to identify patterns of animal forging.
Associated Publications
Resources:
Other Graduate Work
Visualizing sensor data and derived networks of mobile social individuals
Team: Anthony Perritano, Andrea Purgato Client: Dr. Tanya Berger-Wolf (tanyabw@uic.edu), Machine Learning and Computational Biology Faculty UIC
Recent technological advances in location tracking, video and photo capture, accelerometers, and other mobile sensors provide massive amounts of low-level data on the behavior of animals and humans. Analysis of this data can teach us much about individual and group behavior, but analytical techniques that lead to insight about that behavior are still in their infancy. Visualization approaches that allow meaningful representation and comparison of the raw data, derived annotations and classification of those data, as well as various networks extracted from an overlay on it would aid in developing methods for scaling the expert knowledge needed to interpret high-level behaviors from low-level sensor data.
A brief description:
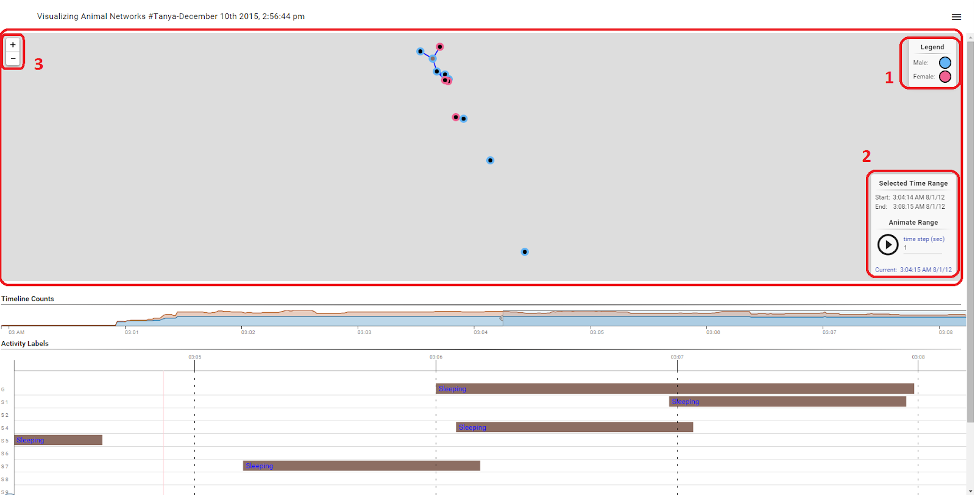
Screen capture of visualization animal networks, the circles represent connected baboon troops. The bottom half represents their behaviors.
- The circles on the map have a border color that represent the sex of the baboons.
- Time widget used to see the timestamp displayed and the time interval selected in the main timeline. Moreover, it has play/pause button that is used to start the animation of the baboons. The user can also choose the incremental interval of the animation (e.g. 1 second, 10 seconds, etc.). Basically, it shows the temporal information that are useful to understand the map.
- The Zoom button is used to adjust the detail of the network.
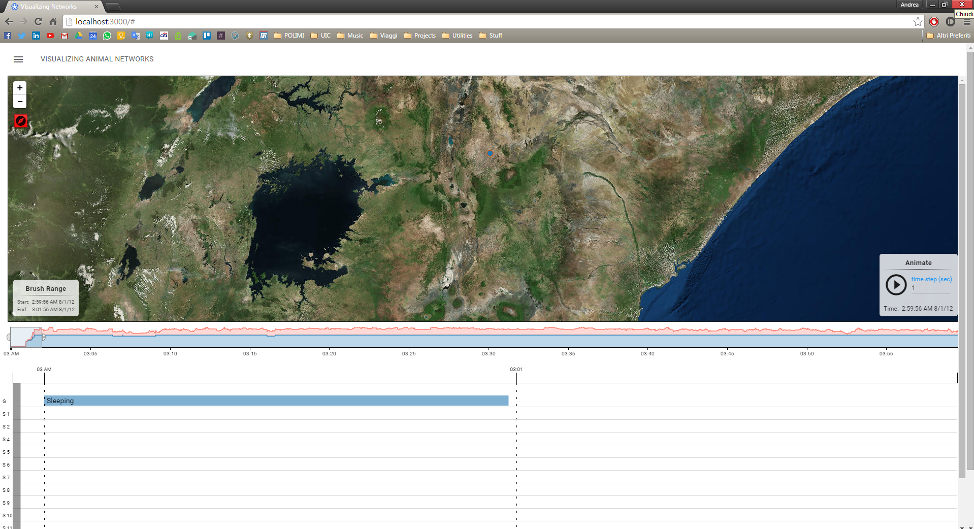
Detailed maps can be used as backgrounds when visualizing the network.
The activity viewer (bottom) shows animal behavior.
Related Coursework
Computational Ecology: Interdisciplinary course in which Computer Science graduate students and faculty from UIC collaborate with Ecology graduate students and faculty from Princeton University on joint research projects that combine Ecology research with computational methods.