Project 1, CS 526: Allan Spale (aspale@evl.uic.edu)
Background
This program was written
using Python 2.1, VTK 4.2, and Tkinter (a Python
module that supports GUI widgets). The
files for the project are simply project1.py. To run the program, type the following: python project1.py. Since Python is an interpreted language,
there is no need to compile; although there is an ability to compile a Python
script to decrease the startup time. The
program meets most of the basic requirements for displaying the requested
visualizations. Some additional
functionality was provided which will be described in the next section.
Sources
The sources of information
used to create this code include the following:
·
Python in a Nutshell, ISBN 0596001886 (used source as guideline to
construct GUI classes and for creating other widgets)
·
VTK Book,
ISBN 1930934076
·
Websites
o An
Introduction to Tkinter (very useful for figuring out how to use Tkinter)
o VTK Docs
o Python Docs
·
VTK Tk/Tcl example code (invaluable for figuring out usage of
VTK)
Usage
With the combination of Tkinter not being a very good GUI and my inexperience with Tkinter, the GUIs provided for the program are a bit
“rough” and spartan.
Nevertheless, the program still generally functions as one would expect
without too many surprises. One problem
is that I could not create modal dialogs.
This means that any dialog that appears will not require that the user
close it before returning to the main window.
Secondly, in order to update the visualization, it is necessary to click
in the rendering window. It is very important to make sure that
the user selects a visualization from the Visualization menu immediately after
opening a file because by default NOTHING appears. Once the user selects a
visualization, make sure to try to zoom in on the elevation and click a
few times in render window to make sure that the elevation appears. Third, the only way
to get contour lines alone is to choose that as the first visualization. Otherwise, the contour lines will appear on
whatever elevation map is currently displayed.
Finally, there is no serious error checking.
The only supported file
format is RAW. Any RAW grayscale or RGB
texture may be input as long as it is 2-D and its dimensions (i.e. width and
height) are known. Once the user has
finished looking at files, it is
strongly recommended that they exit and restart the program.
Menus
·
To open a file,
select Open. The only supported file type is RAW. Enter the file name, the image dimensions,
and whether or not the file is grayscale or RGB. This is done for both the texture and the
elevation map. To quit the program,
either close the main window or select Exit.
·
To visualize the
data, select one of the menus from the Visualization
menu. The available options are Colormap, Contour Lines, Grayscale, and Texture.
o Colormap uses a
predefined colormap that goes from dark colors to
light colors. Additionally, the lower
value elevation locations will be less opaque than higher value
elevations. However, this only seems to
work on early attempts before any other visualization modifications occur.
o Contour
Lines presents
a dialog box to configure each of four contour lines colored by default red,
blue, green, and yellow. By selecting a
radio button with the color name, the user can then change the height of the
contour in addition to the thickness of the contour line. For the changes to appear, it is necessary to
click in the rendering window. A side
effect is that the contour lines will appear on any other visualization chosen
after this one. To make the contour
lines go away, it is necessary to make another selection from the visualization
menu that is not Contour Lines. In order to display the contour lines alone,
make this the first selection.
o Grayscale will display the elevation map according to the
texture provided by the elevation file.
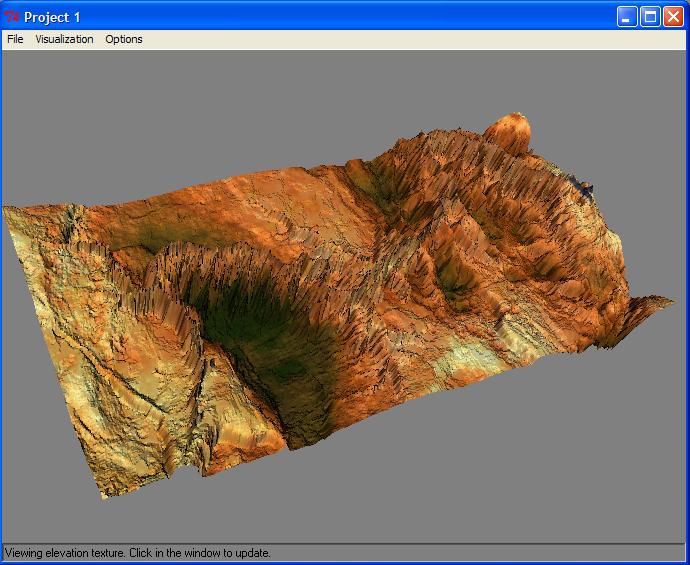
o Texture will display the elevation map according to the
texture provided by the texture file.
·
To change some
of the options of how the elevation appears, select the Options menu.
o Selecting the Landscape
menu brings up a dialog box that allows the user to change the warp factor of
the elevation between a range that is both negative and positive. Additionally, the user can reduce or increase
the subsampling factor of the data. A higher value will improve performance but
also lower the resolution. Once the user
makes a selection, it is necessary to click in the rendering window in order
for the changes to take effect.
Design
There is a class that takes
care of all of the rendering. In the
constructor part of this class, all of the visualization pipeline parts are
created, but not all of the attributes are set.
Below is a general overview of the pipelines…
readerTexture
(vtkImageReader2) -> shrinkTex (vtkImageShrink3D)
readerElev
(vtkImageReader2) -> shrinkElev (vtkImageShrink3D)
-> geometry (vtkImageDataGeometryFilter) ->
warp (vtkWarpScalar) -> merge (vtkMergeFilter)->
mapperStandard (vtkDataSetMapper)
colormap (vtkLookupTable) -> elevation (vtkElevationFilter)
-> colormapMapper (vtkPolyDataMapper)
-> actorColormap (vtkActor)
contour_X (vtkContourFilter) -> contour_X_mapper
(vtkPolyDataMapper) -> contour_X_actor
(vtkActor)
ren (vtkRenderer)
-> renWin (vtkRenderWindow)
-> rw (vtkTkRenderWindowInteractor)
Depending
on the circumstance, these pipelines will be connected as needed. One case is taking shrinkTex
and sending it to merge to apply the texture to the elevation map.
Bonus Features
- Contour lines may
appear on any elevation texture.
Choose Contour Lines after using another
visualization.
- Contour thickness can
be manipulated from 0 (hidden) to 5 pt thickness.
- Subsampling data is provided for better performance using
the Landscape dialog box.
- Colormap that uses alpha values to permit sight through
large surfaces.
Deficiencies
- Special case needed
to have contour lines appear on their own (i.e. must be first visualization
selected in a session).
- As the height map is
warped, the colormap changes.
- There is only support
for the RAW file format with known dimensions.
- The program can only
be started to view a single visualization.
Once the user has finished viewing the files, the user must restart
the program in order to open the new elevation and texture files.
Images
Opening
screenshot
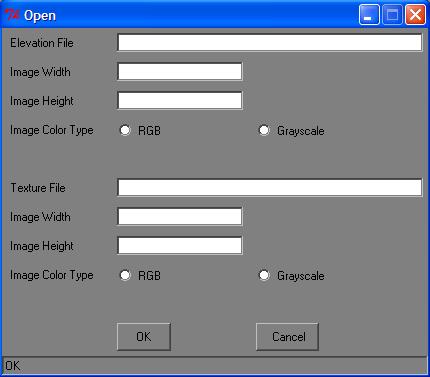
Open
dialog
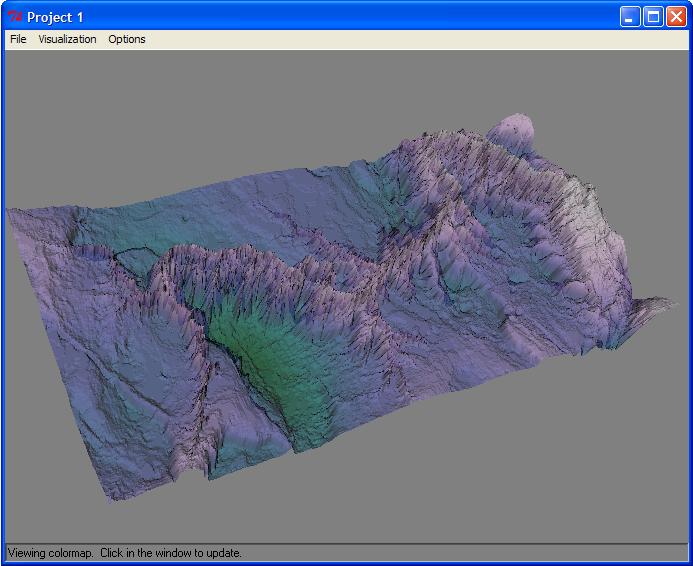
Colormap
visualization (dark/green=lower elevation, purple/white=higher elevation)
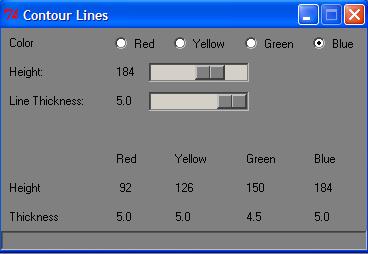
Contour
lines dialog box
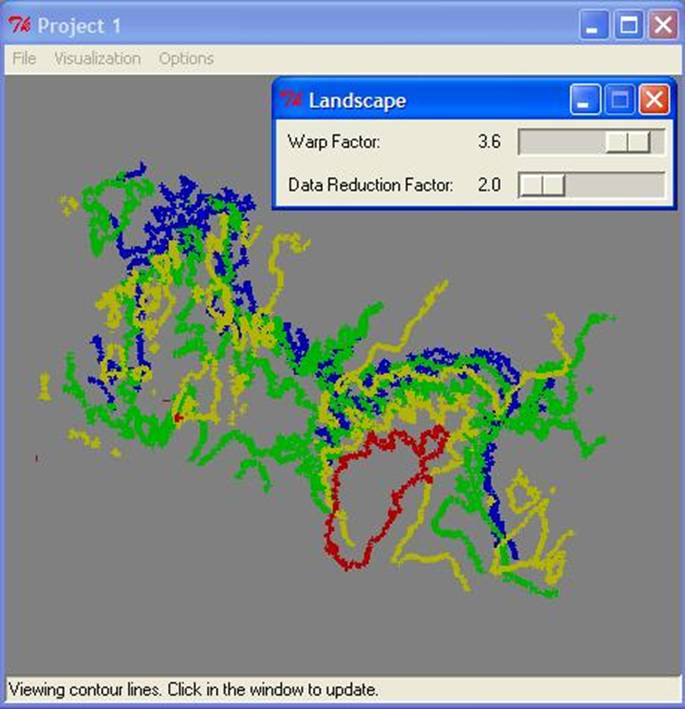
Contour
lines only…needed to display this as the first visualization.
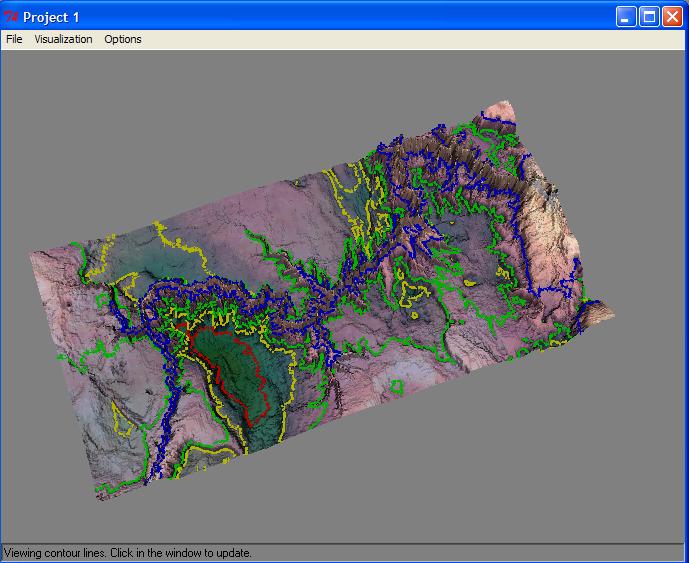
Contour
lines on a color map
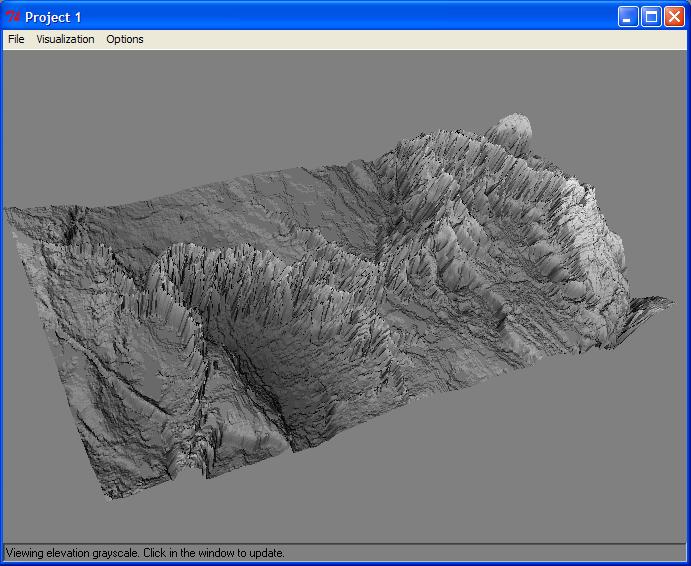
Grayscale
texture
RGB
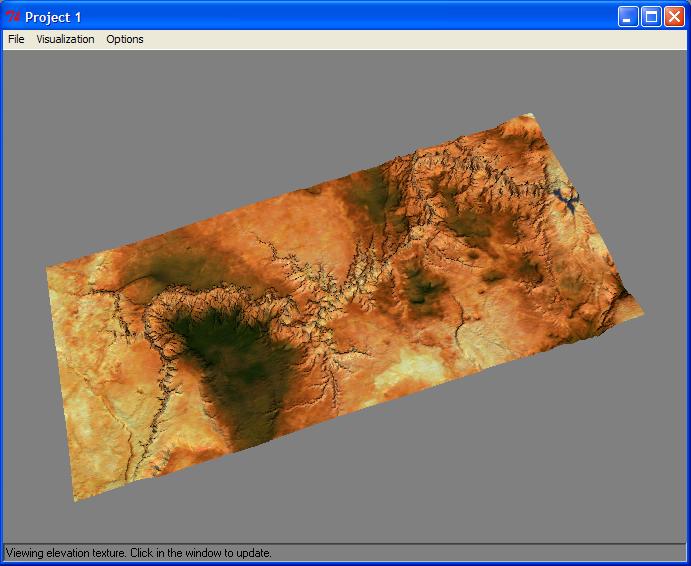
Texture map on elevation
Small
warp factor on RGB texture
Large
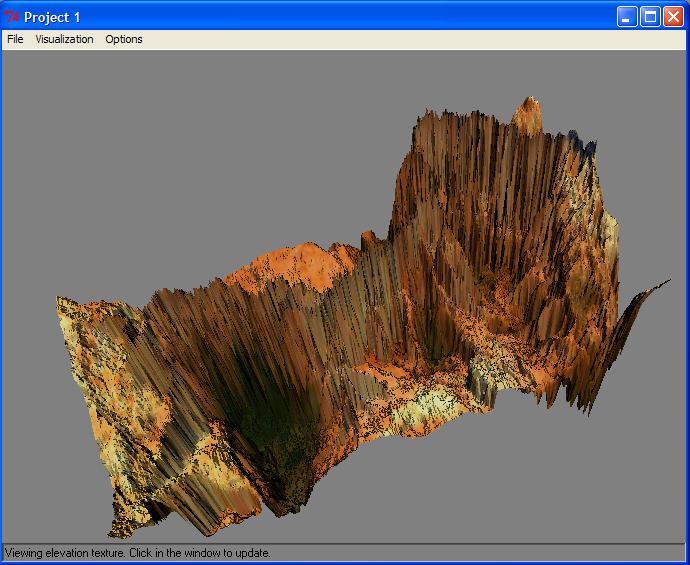
warp factor on RGB texture
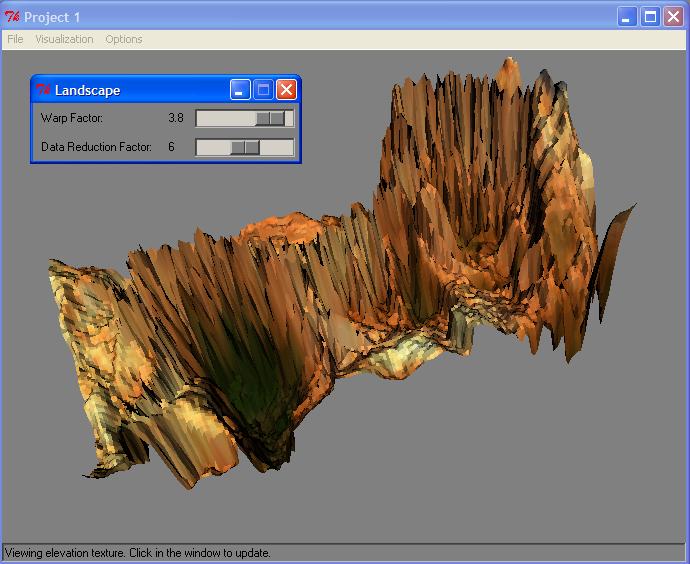
Subsampling of texture RGB with Landscape dialog for making adjustments
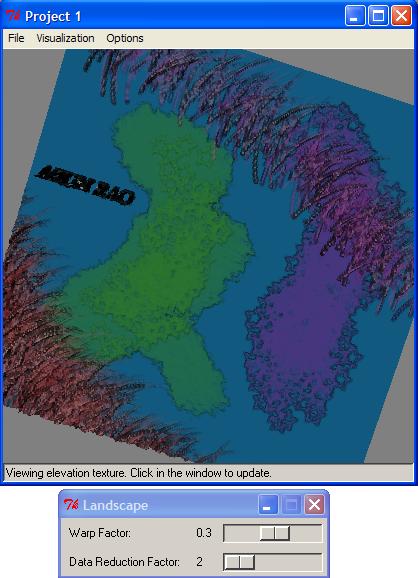
Viewing
of another elevation map with texture; image size 512x512 created in Photoshop
by Arun Rao