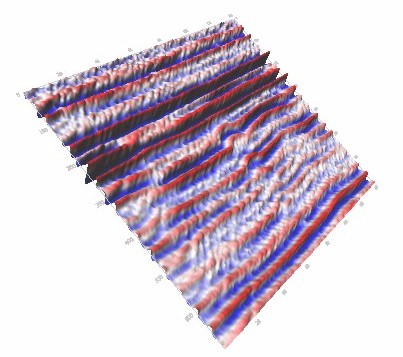
SeisScape displays seismic data as a true three-dimensional surface complete
with complex lighting and shading effects. This tool was developed by
Digi-Rule Inc. a Canadian software developer and also the manufacturer of a
unique, patented digitizer. They specialize in general mapping applications
and particularly (but not exclusively) in petroleum exploration software, both
geophysical and geological.
The traditional wiggle trace display communicates character and structural information very well. However it lacks compactness and the visual representation is only effective within a narrow range of amplitude. Once traces start to overlap our ability to discern character is dramatically reduced.
In addition, whereas our eyes can become well trained to read wiggle trace displays, they are not natural. A wiggle trace display does not look like anything we would normally see in nature.
With the advent of computer technology, color mapped or variable density displays have come to the forefront. These displays represent seismic using a color scale, with individual samples being colored according to their amplitude.
Although these displays are compact and ideally suited to the limited dimensions of a computer monitor they are not well suited for detecting subtle character changes and are often overlain with a wiggle trace display. In addition, because of their reliance on color mapping, they are not well suited to the large proportion of the population who suffer from any form of color deficiency.
What has been needed for a long time is a new type of display that shows both
structural and character information and yet is compact enough to be viewed
on a computer monitor. This is SeisScape.
In a SeisScape display:
Amplitude anomalies stand out better
Character changes are easier to spot
Faults are clearer
Complex structures are easier to follow
Read and display 2D seismic lines
Read and display 2D lines extracted from 3D volumes
Read SEGY data from UNIX or Windows systems
Extract rectangular regions of data for closer analysis
Illuminate the data with various types of light sources
Rotate, zoom and animate the display
A seismic interpretation system
A seismic processing system
SeisScape is meant to be run in conjunction with other programs such as interpretation
systems.
3D Viz of Seismic Activity associated with the Nazca and South American Plate Subduction Zone Along Southwestern Chile. You have to download earthquake epicenter data, satellite imagery and surface topography from the Internet.
Interactive Visualization of 3D Seismic Data: A Volumetric Method
High-amplitude seismic events, representing reflections from subterranean surfaces, are transformed to color pixels, and the resulting 3-D images reveal the structure of the geological layers. Such morphological features as hills, valleys, and faults are apparent indicating that the approach could prove useful for identifying potential oil reservoirs. The authors implement the technique on a personal computer to produce displays of similar quality, but they find that the construction of the 3-D images is too slow for reasonable interactivity. However, with the addition of a parallel-processing accelerator, a personal-computer-based workstation would be feasible for this kind of 3-D visualization and interpretation.
Visualization of Seismic Data in Geophysics and Astrophysics
Use seismic data to understand the structure of the earth with the help of analytical models.
A Combined Approach to 3D Seismic Data Segmentation and Rendering
Proposes an algorithm for visualization of stratigraphic features embedded in 3D data.
Visualization of Seismic Data in 3D for Interactive Realtime Interpretation
Methods for 3D seismic viz and automatic seismic tracking algorithms. Need to contact author.
VoxelGeo
Volume viz of seismic data.