Project 2 - EVL Wi-Fi Visualization
By Dmitri Svistula
Download
1. Visual Studio .NET Project
2. Executable
Building this project required Visual Studio .NET as well as proper integration
of VTK and FLTK
into the developing environment.
Visualization Pipeline
Three main pipelines are concentrated around the three types of
visualizations used in this project. The three represenations are glyphs,
isosurfaces, and the cutting plane.
Glyphs
The glyphs are generated using .vtk data files.
vtkPolyDataReader
|
vtkShepardMethod (optional)
|
vtkGlyph3D (vtkSphereSource)
|
vtkPolyDataMapper
|
vtkActor
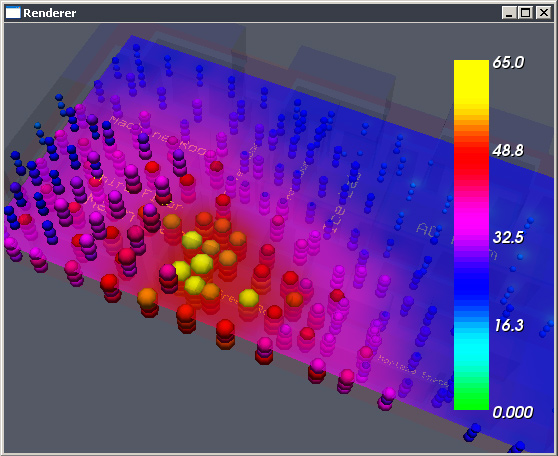
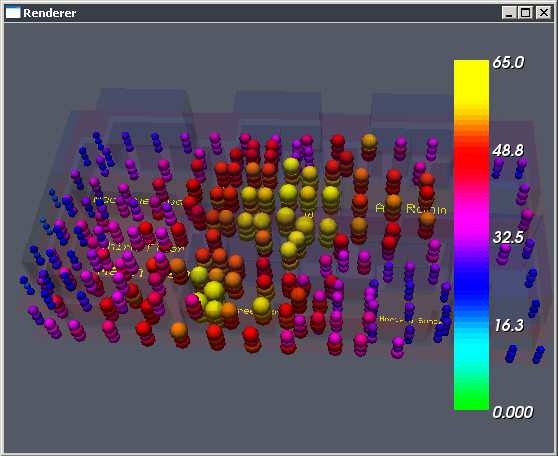
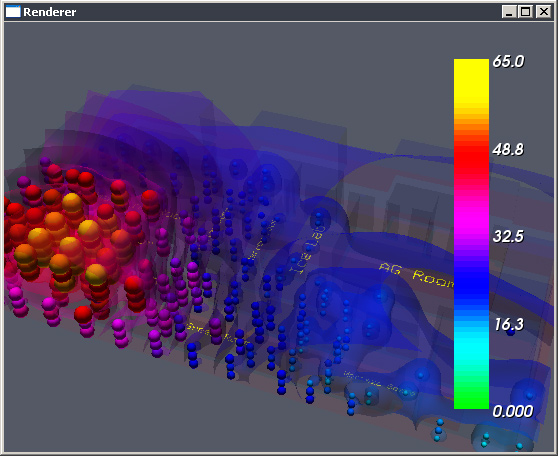
Here, the strength of the signals is represented by the size of a sphere, and,
depending on user preference, by color. The glyphs can be either colord by
network or according to the lookup table for signal strengths.
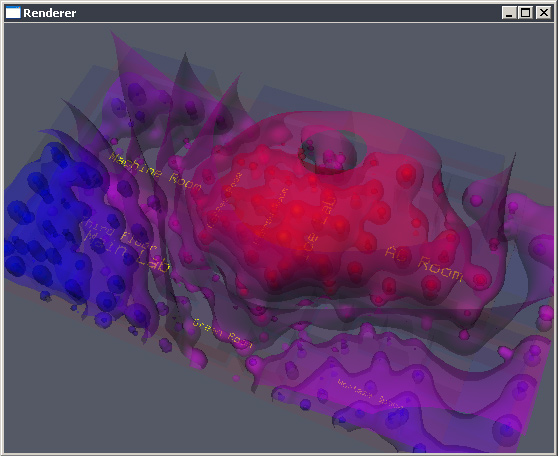
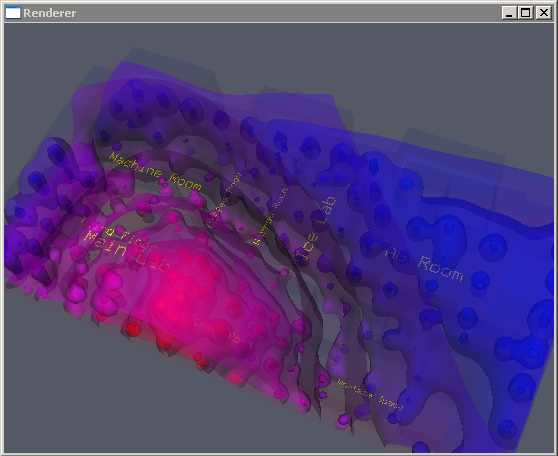
Isosurfaces
The isosurfaces are generated using .raw data files.
vtkImageReader2
|
vtkMarchingCubes
|
vtkDataSetMapper
|
vtkActor
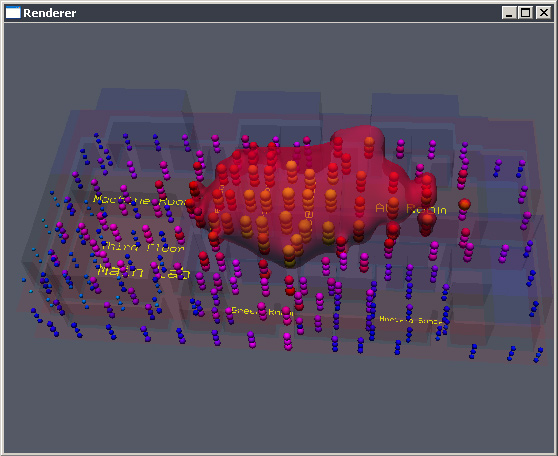
The strengths are represented by isosurfaces that cut through the data.
Isosurfaces give the user a good idea about location of selected strength values.
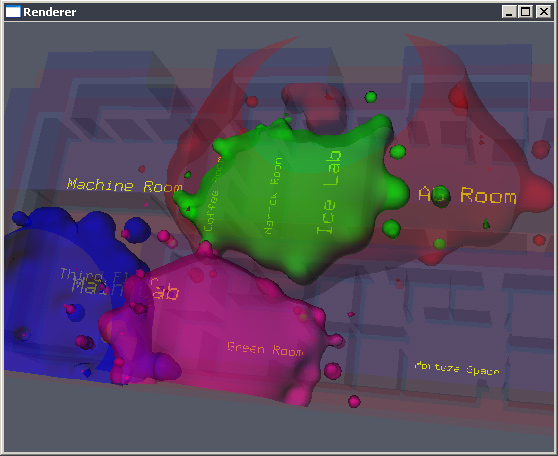
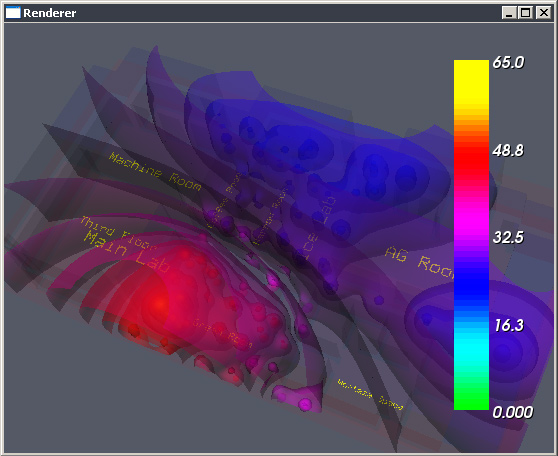
It is also possible to generate multiple contors, where a set number of contours
is generated for the same data. Similarly, the contours can be either colord by network
network or according to the lookup table for signal strengths.
Cutting Plane
The cutting plane is generated using .raw data files.
vtkImageReader2
|
vtkCutter (vtkPlane)
|
vtkPolyDataMapper
|
vtkActor
The cutting plane shows strength distribution for different heights. The
strenghts here are respresented by color from the lookup table for signal
strengths. Note that the color table is persistent across the networks, but
it is possible to change the colors of the table by varying its hue range.
User Interface
The current user interface is rather flexible and compact.
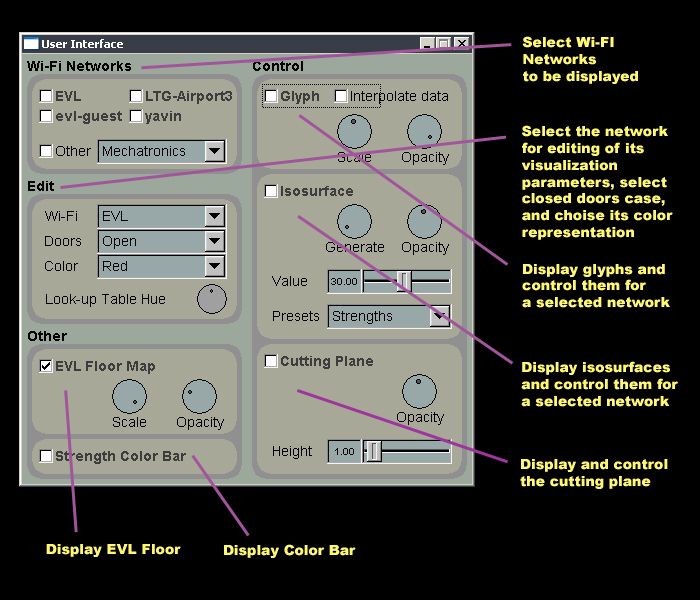 Features
- View of multiple networks at a time
- View several visualization types at a time
- Look at other networks outside of EVL
- Color code networks selectively
- Edit one or edit all networks
- Maintain a states of editable parameters
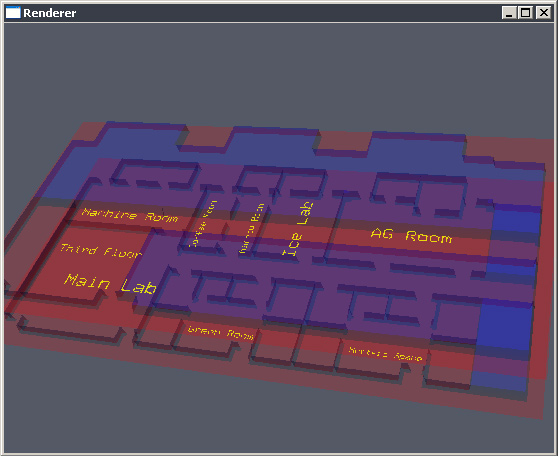
- Labeled EVL floor map
- Scalar value bar corresponding to network strengths
- Strength presets
poor (20/65),
fair (30/65),
good (40/65),
excellent (50/65)
Screenshots
Labeled floor map

Scaled down floor map with increased opacity
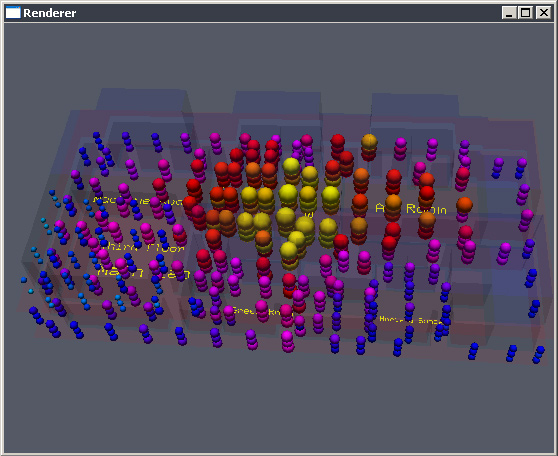
Glyph representation for all color coded networks

Strength colored glyphs for EVL(open)
Strength colored glyphs for EVL(open) and yavin(open) with strength bar
Isosurface for EVL(open) at strength = 43/65 and glyphs
Isosurfaces for all EVL networks at good signal preset with open doors
Isosurfaces for all EVL networks at good signal preset with closed doors
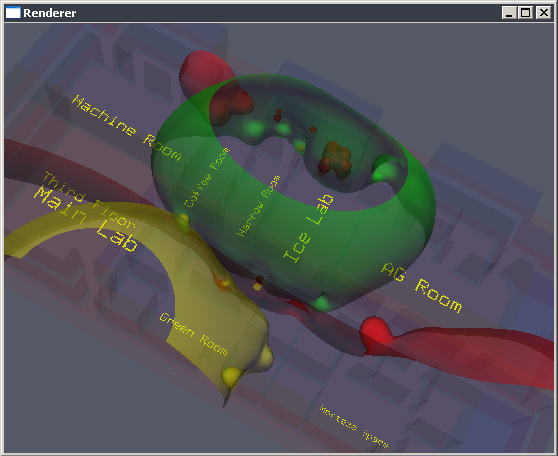
Generating multiple isosurfaces for the EVL(open) open doors data
Multiple isosurfaces for yavin(open) data
Multiple isosurfaces for yavin(closed) data with scalar bar
Multiple isosurfaces for LTG-Airport3(open) with glyphs and scalar bar
Plane cut for yavin(open) at 4 feet with scalar bar

Glyphs with plane cut at 7 feet with scalar bar for yavin(open)