
Collaborative Visualization using High-Resolution Tiled Displays
April 22nd, 2006
Categories: Applications, Devices, Software, Visualization
Authors
Renambot, L., Jeong, B., Jagodic, R., Johnson, A., Leigh, J., Aguilera, J.About
We envision situation-rooms and research laboratories in which all the walls are made from seamless ultra-high-resolution displays fed by data streamed over ultra-high-speed networks from distantly located visualization, storage servers, and high definition video cameras [1,6]. It will allow local and distributed groups of researchers to work together on large amounts of distributed heterogeneous datasets. From working with our collaborators at the US Geological Survey and the National Center for Microscopy and Imaging Research, we have seen how high resolution displays can be used to show detail and context simultaneously. Homeland security applications and emergency response management in particular, and the whole domain of visual analytics in general would largely benefit from the same features.
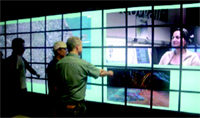
We are taking the next steps toward this vision by building and using LambdaVision - an 11x5 tiled display with a total resolution of 100 megapixels and developing SAGE, the Scalable Adaptive Graphics Environment. The goal is to enable scientists to explore datasets and share applications at the highest resolution available. SAGE allows the seamless display of various networked applications over the high-resolution displays. Each visualization application (such as 3D rendering, remote desktop, video streams, very large 2D maps, see Figure 1) streams its rendered pixels (or graphics primitives) to SAGE, allowing for any given ayout onto the displays (e.g. the output of arbitrary M by N pixel rendering cluster nodes can be streamed to X by Y pixel display screens).
The graphics streaming architecture of SAGE addresses two non-trivial problems in scientific visualization. One is heterogeneity: since most visualization applications are closely tied to their graphics environment, it is difficult to integrate various visualization applications into a unified graphics environment. The other is scalability: the ability of visualization software and systems to scale in terms of the amount of data they can visualize and the resolution of the desired visualization [5]. SAGE addresses the heterogeneity problem by decoupling graphics rendering from graphics display so that visualization applications developed on various environments can easily migrate into SAGE by streaming their pixels into the virtual frame buffer. Also, SAGE provides scalability by supporting any number of resolution, and the SAGE visualization applications have extremely fast access to huge databases at remote or local sites taking advantage of affordable ultra-high-bandwidth networks.
Resources
Citation
Renambot, L., Jeong, B., Jagodic, R., Johnson, A., Leigh, J., Aguilera, J., Collaborative Visualization using High-Resolution Tiled Displays, CHI 06 Workshop on Information Visualization and Interaction Techniques for Collaboration Across Multiple Displays, Montreal, Canada, April 22nd, 2006.