
Rain Table: Scalable Architecture for Group-Oriented Visualization of Real-Time Geoscience Phenomena
May 1st, 2008
Categories: Applications, Education, MS / PhD Thesis, Museums, Software, Visualization
Authors
Svistula, D. N.About
Rain Table is an application for large-scale interactive 2D particle-based simulation and visualization on scalable high-resolution tiled displays for group-oriented interaction with geoscience content. The goal of this research project is to apply high resolution visualization technology to geoscience education in museums or classrooms to provide educators with new means of visualizing and simplifying the understanding of complex scientific phenomena. The work in this project is aimed at informal education in science museums, however it may potentially be of use to real scientists. This project implements software that allows users to interact with visualizations by taking advantage of novel scalable tracking technology for tiled displays, developed at EVL. Rain Table implements an out-of-core image rendering framework that uses tiling, on-demand texture paging, multi-level caching, compression, and threading techniques to minimize latencies and maintain system interactivity. The core of Rain Table is a decentralized particle-based simulation and visualization model that runs alongside the rendering nodes of tiled displays. The first goal of this project is to design and implement the architecture to run and display simulations of rainfall runoff and the context for these simulations, such as aerial photography in high detail. The second goal is to prepare this architecture for other types of simulations and assess its scalability in terms of data size, output resolution, communication, computation, and interaction space.
On the application side, the original idea and foundation for this work revolve around watershed education and various outreach projects conducted by the National Center for Earth-Surface Dynamics (NCED) at the University of Minnesota. One method used to visualize water paths through watersheds and how it connects different sub-regions is to sprinkle
water on top of a physical model of a region. This is a great way to visualize the paths water takes; however, it is a poor substitute for the complexities of water flow in the real world. It is also very hard for students to think about the phenomena on a more global scale, because physical models are usually meant to represent very small regions. Physical models are not flexible enough because a separate model has to be built for different types of terrains. This process is time consuming and the resulting models take up a lot of space. A solution that is more modular and versatile can help in solving these problems.
The ideal solution is a large table surface that resembles a physical water table, but also enables students to:
- Quickly experiment over any terrain map and switch between them.
- Take advantage of very high resolution observatory data such as satellite topography and aerial photography.
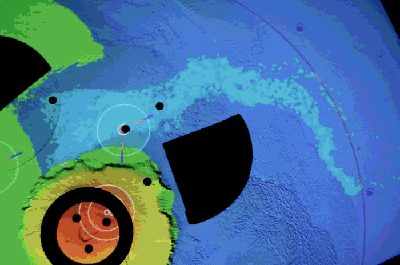
The rainfall runoff simulation in Rain Table allows users to interactively explore the flow of water across maps and discover the concepts of watersheds, floods, and the interconnectivity of river systems. Multiple users can generate water flow independently of one another, so small groups work together interactively, eliminating passive viewing and equalizing user’s control of the visualization model.
Resources
Citation
Svistula, D. N., Rain Table: Scalable Architecture for Group-Oriented Visualization of Real-Time Geoscience Phenomena, Submitted as partial fulfillment of the requirements for the degree of Master of Computer Science, Graduate College, University of Illinois, Chicago, IL, May 1st, 2008.