
Visualization of Large-Scale Distributed Data
January 1st, 2012
Categories: Visualization
Authors
Leigh, J., Johnson, A., Renambot, L., Vishwanath, V., Peterka, T., Schwarz, N.About
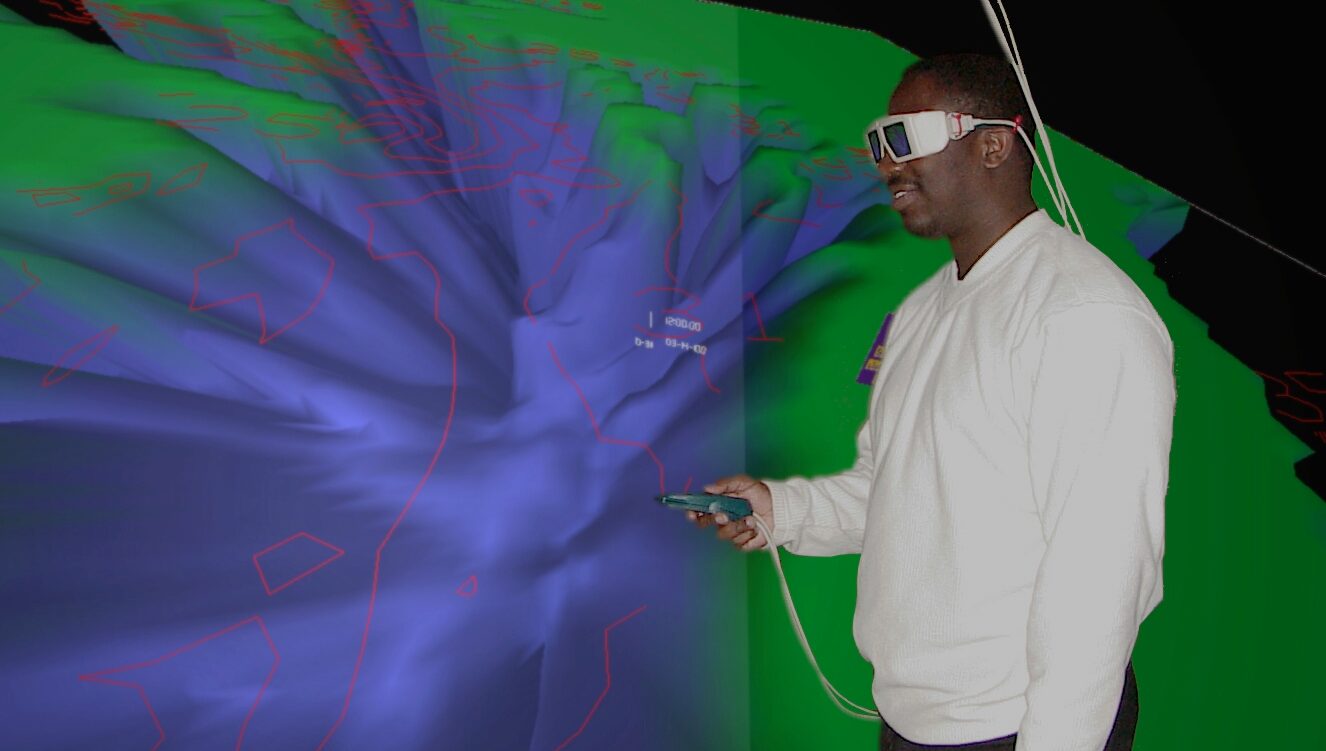
The primary goal of visualization is insight. An effective visualization is best achieved through the creation of a proper representation of data and the interactive manipulation and querying of the visualization. Large-scale data visualization is particularly challenging because the size of the data is several orders of magnitude larger than what can be managed on an average desktop computer. Data sizes range from terabytes to petabytes (and soon exabytes) rather than a few megabytes to gigabytes. Large-scale data can also be of much greater dimensionality, and there is often a need to correlate it with other types of similarly large and complex data. Furthermore the need to query data at the level of individual data samples is superseded by the need to search for larger trends in the data. Lastly, while interactive manipulation of a derived visualization is important, it is much more difficult to achieve because each new visualization requires either re-traversing the entire dataset, or compromising by only viewing a small subset of the whole. Large-scale data visualization therefore requires the use of distributed computing. The individual components of a data visualization pipeline can be abstracted as:
Data Retrieval -> Filter / Mine -> Render -> Display
The degree to which these individual components are distributed or collocated has historically been driven by the cost to deploy and maintain infrastructure and services. Early in the history of scientific computing, networking bandwidth was expensive and therefore scarce. Consequently early visualization pipelines tended to minimize the movement of data over networks in favor of collocating data storage with data processing. However, as the amount and variety of data continued to grow at an exponential pace, it became too costly to maintain full replicas of the data for each individual that needed to use it. Instead, by leveraging the widespread expansion of the Internet and other national and international high-speed network infrastructure such as the National LambdaRail, Internet-2, and the Global Lambda Integrated Facility, data and service providers began to migrate toward a model of widespread distribution of resources.
In this chapter we will first introduce the various instantiations of the visualization pipeline and the historic motivation for their creation. We will then examine individual components of the pipeline in detail to understand the technical challenges that must be solved in order to ensure continued scalability. We will discuss distributed data management issues that are specifically relevant to large-scale visualization. We will also introduce key data rendering techniques and explain through case studies approaches for scaling them by leveraging distributed computing. Lastly we will describe advanced display technologies that are now considered the “lenses” for examining large-scale data.
Resources
Citation
Leigh, J., Johnson, A., Renambot, L., Vishwanath, V., Peterka, T., Schwarz, N., Visualization of Large-Scale Distributed Data, Data Intensive Distributed Computing: Challenges and Solutions for Large-Scale Information Management (2012), no 1, pp. 242-274, IGI Global, January 1st, 2012.