A two-tiered collaborative design for observational science activities in simulated environments
Tom Moher
Janet Kim
David Haas
Electronic
Visualization Laboratory
University of Illinois at
Chicago
moher@uic.edu
ABSTRACT
Elementary school science focuses on the early phases of science inquiry: observation, description, data collection, reflection, and reporting. Technologies afford opportunities to scaffold and extend the domains of inquiry, but successful adoption depends on their integration with classroom organization and practice. In elementary schools, small group and whole class activities dominate over solitary activity, and the effective use of traditional desktop computer systems has proven to be a difficult challenge for classroom teachers. Increasingly affordable large-format displays more naturally support small-group collaboration, but require careful activity design to maximize utility. We describe an activity design employing large displays that accommodates both the constraints of the classroom and the play experiences of children in support of observational science learning.
Keywords
Collaboration, science inquiry, large-format displays, elementary school
THE SNOOKERPUSS ADVENTURE
In Mr. Baez's fourth grade classroom, the talk was of the Snookerpuss, and whether there would be enough mushrooms—the Snookerpuss's favorite cuisine—to satisfy his ravenous appetite when he came out of hibernation[1]. In order to make their prediction, small groups of Mr. Baez's students had been conducting crop surveys in a large field and counting mushrooms during successive months of the growing season. Plotting their collective data on a graph and visually introducing a best-fit line, they developed a prediction of the number of mushrooms that would be available at the end of his hibernation. They confirmed their favorable prediction by sneaking into the field for a final count just before the hungry Snookerpuss awoke.
When they did their surveys, the children noticed that the field they were exploring contained different types of terrain (rock, sand, and grass). As they inventoried the mushrooms, the children took note of the underlying terrain, and later developed separate graph lines for each type. Concluding that the mushrooms grew most rapidly in the grass, they recommended that next year the mushroom spores be distributed in grassy areas to maximize yield.
In follow-up individual activities, the children described their surveying strategies, and developed new Snookerpuss predictions based on hypothetical data. Although the children had not previously been introduced to linear extrapolation, 75% of the students were able to construct a supported prediction. The next month, when the kids were formally introduced to the concepts of linear interpolation and extrapolation in their math textbooks, they repeatedly cited the Snookerpuss adventure.
The Snookerpuss Adventure took place over two rainy days in November 2000. The children were working in a simulated environment called "the Field," presented on a large-format multi-user display located in a resource room at their school. Kids “walked around” in small groups, navigating the simulated space and recording tallies, conditioned by terrain type. In a whole-class setting prior to the exploration, they had been introduced to the Snookerpuss's needs, and had discussed how they might be able to make predictions of future events based on historical data. The aggregation and plotting of the data, and the ensuing curve fitting and extrapolated prediction, was likewise a whole-class exercise. Overall, each child spent about 30 minutes using the display technology, and about two hours in small group and whole-class activities.
VIRTUAl ambients
The field used in the Snookerpuss Adventure is an example of a virtual ambient (Moher, et. al., 2000, 2001) —a configurable simulated environment used as the locus for children's scientific exploration. Virtual ambients are three-dimensional "first person" spaces within which users may navigate in space, scale, and time. Virtual ambients may be static or dynamic, but unlike traditional simulations, virtual ambients offer users no direct control over independent variables; they are designed to support observational, rather than experimental, sciences (AAAS, 1993; NCTM, 1998; NRC, 1996). Nothing that the user may do within a virtual ambient can affect the course of the underlying simulation. This constraint is designed to reduce the cognitive burden of exploring complex input spaces (de Jong et. al, 1998; Friedler et. al, 1990; Jackson, et. al, 1994) by limiting young learners to familiar concepts and activities: moving around, seeing things at different scales, and imagining the past and future. It does not preclude the articulation and investigation of causal hypotheses; it simply shifts the burden from artificially manipulating preconditions to finding instances of varying preconditions in space or time.
Virtual ambients are intended as complements to, rather than substitutes for, accessible physical phenomena. Teachers often rely on accessible local environments to stimulate young learners' questions and to provide direct access to observable and measurable phenomena. Local environments have the advantages of convenience and salience, but they also have important limitations: they may emphasize activity over learning (Dewey, 1910), they may limit the domain of inquiry, and, at least in natural environments, they may constrain teachers' ability to scaffold learning by reducing complexity.
Activities employing virtual ambients typically address complementary learning goals. In the case of the Snookerpuss adventure, one goal was to help the children develop their understanding of transforming between numeric and graphical representations of data, linear best-fit, interpolation, and extrapolation. The other goal was to develop students’ skills for conducting scientific inquiry, including planful investigation, navigational strategies within a survey space, observation of phenomena and recording of data, distribution of effort within an investigational team, reporting of their results, and the aggregation of data across teams in a large-scale project.
Virtual ambients share a motivational base with field- and video-based classroom investigation technologies in their focus on children's direct observations of phenomena (Smith & Reiser, 1998; Soloway et. al, 1999). Like video, virtual ambients benefit from their ability to focus attention to a manageable data domain; like field-based activities, they allow learners latitude in observational choices and practices.
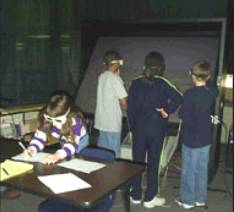
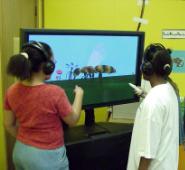
In our work to date, we have deployed our virtual ambients on large-format
displays (Figure 1). In the case of the Snookerpuss Adventure, students used an
ImmersaDesk®, a 1.27m by 1.7m
rear-projected video system with head- and hand-tracking employing lightweight
shutter glasses to present a stereoscopic display, situated in a resource room
at a local elementary school.
Figure 1. Children using virtual ambients deployed
on an ImmersaDesk in school resource room
ACTIVITY DESIGN
The use of large format displays for presenting virtual ambients has facilitated activity designs involving groups of children engaged in collaborative investigations. Our motivation for these designs draws from several sources:
· The organization of activity—and even the physical layout of classrooms—in elementary schools is most frequently designed to support small group interaction. Moreover, from both logistic and economic perspectives, it is simply impractical to effectively schedule individual access to very scarce technological resources.
· Many children have substantial experience outside of school in collaborative virtual environments presented on large displays; the image of several children sitting cross-legged in front of a 32" television exploring complex video-game worlds for hours on end has become a cultural touch point for parents.
· Finally, we share the perspective that learning in a social context affords opportunities simply unavailable to the solitary learner.
· The large display enhances the children's sense of "immersion" in the virtual environment, and provides a closer approximation to the wide field-of-view available to learners in the natural world.
· Prior research supports the conjecture that peer collaboration plays a significant role with respect to the level of student engagement within virtual learning environments (Jackson, et. al., 1999).
A commitment to collaborative organization still leaves considerable latitude in the design of learning activities. Working with teachers at a local elementary school over the course of the past two academic years, we have developed a two-tiered approach that interleaves whole class and small group collaborative activities. A typical lesson trajectory, normally enacted over the course of a few days or weeks, includes the following components.
Reconnaissance. In order to enhance the students' ownership in the virtual environment, units typically begin with the selection of a small group "scouting party" whose responsibility is to make a brief visit to the environment, make initial observations and take some notes on what they saw, take some simulated "snapshots" of scenes in the environment, and then report what they found back to the whole class.
Establishing challenge/task/question. After the scouts describe what they saw, a research question is established in a whole class setting. The setting of the research question is a delicate balance between curricular goals and self-motivated children's inquiry. In some cases, features of the environment may lead children to raise questions consistent with the curricular goals; in other cases, the teacher may lead the children to a question by referencing environmental features that the scouts reported.
Operational planning. Once a research question is established, the teacher and students, again in a whole class setting, engage in an extended planning discussion in preparation for exploration in the virtual environment. Among the issued discussed are what data need to be collected in order to address the question (and the design of the data collection forms), how labor will be divided among the class to accomplish data collection, how accuracy in data collection can be enhanced, and the roles of individual team members during the exploration process. Data attributes in our studies have included such features as cardinality, shape, size, color, location (both coordinate data using a handheld device as a simulated GPS display, and categorically with respect to environmental attributes), and motion/gesture of animate characters in the environment.
Data collection. As the simulation environment is a single resource, data collection is accomplished serially, with individual exploration groups collecting the data assigned to them during operational planning. Depending on the technology, this may be achieved either through pull-outs (to access the ImmersaDesk in the resource room), or opportunistically planned by the teacher directly in the classroom (in the case of the plasma display).
Data investigation. Once all of the exploration groups have collected their data, the data are explored in small-group and whole class settings. Individual groups may initially work with their own data, but the data are compared among groups or aggregated across groups. In our studies, students have identified location- and time-based patterns, performed best-fit regression on time series data, developed conditional co-occurrence rules, and constructed and compared categorical distributions, among other activities.
Reporting. The unit is concluded by a reporting activity in which the students, either individually or in small groups, or as a whole class, develop an intellectual product that reflects both the process they undertook and the conclusions that they reached as a result of the investigation. This has taken the form of individual reports, group enactments, and whole class posters in our studies.
While the lesson trajectory is presented as linear, in practice it is often the case that activities undertaken at one phase may require backtracking to earlier phases of the investigation, in some cases to correct errors or resolve discrepancies, but also to undertake entirely new investigations based on accumulated experience.
collaboration in the snookerpuss adventurE
The Field
In the Field (Figure 2), students collaboratively explore a large (3000m x
3000m) "natural" terrain populated by up to eight different plant
types. A standalone Java application allows the Field to be configured by
selecting a plant type and clicking on the desired location. The Field itself
has limited affordances: navigation, the ability to take "snapshots"
automatically posted to a class web page, and the ability to plant an unlimited
number of (biodegradable) "flags" in the ground. In the Field, the
land mass is statically divided into regions in two independent ways: by the
3x3 orthogonal arrangement imposed by the picket fences ("sectors"),
and by the differential texture maps (grass, gravel, sand) used on the ground
("terrain"). A standalone Java application allows the Field to be
configured by selecting plant types and clicking on the desired locations,
supporting learning objectives across a range of grade levels without requiring
additional software development.
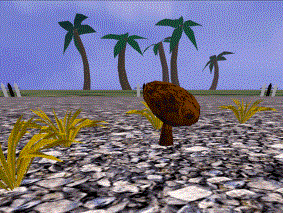
Figure 2. A mushroom in a rocky region of the Field.
In the Snookerpuss Adventure, we used only one of the nine regions, and created eight different configurations populated by varying numbers of mushrooms reflecting a time series over eight simulated months during the growing season. In the rocky portion of the field, the number of plants was held constant over the time series. In the sandy and grassy portions of the field, the number of plants grew as a linear function of time (Figure 3). The simulation for the month of June was intentionally excluded in order to create an opportunity to discuss linear interpolation.
|
Month |
Rock |
Sand |
Grass |
Total |
|
March |
5 |
5 |
5 |
15 |
|
April |
5 |
6 |
7 |
18 |
|
May |
5 |
7 |
9 |
21 |
|
July |
5 |
9 |
13 |
27 |
|
August |
5 |
10 |
15 |
30 |
|
September |
5 |
11 |
17 |
33 |
|
October |
5 |
12 |
19 |
36 |
Figure 3: Actual configuration of mushrooms by terrain type per month.
(The decision to use "perfect" data values in configuring the field drew from our experience with virtual ambient activities at other grade levels (Moher et. al, 2000). In prior activities, we had intentionally introduced noise into the data in an effort to move children away from the expectation that everything always comes out "right" in elementary school math and science. However, we found that the counting tasks in the virtual ambients were of sufficient difficulty that exploration groups almost never counted completely accurately; we also found that their errors included both undercounting and overcounting. Rather than introduce arbitrary "noise" into the data and risk further aggravating the children's own counting errors, we have settled on a strategy of using model values.)
Tier 1: Small-group collaboration
In the Snookerpuss Adventure, there were two types of small-group activities: scouting (open-ended reconnaissance enacted by a group of four students at the outset of the unit) and data collection (mushroom counting enacted by seven groups of two or three students during different simulated months).
The charge for the scouts was simply to explore the field and report back to their classmates; scouting was done prior to establishing the Snookerpuss scenario. The children took notes (Figure 4), and also took simulated photographs of scenes in the field that were assembled into a slide-show presentation that the children showed to the whole class using a video projector. Scouting took approximately 40 minutes.
The scouts collected information describing both the environment and the interface affordances (and limitations) of the system. They noted the different terrain types and the presence of the mushrooms and some ancillary plants. They also discovered that pushing one of the buttons on the controller caused a flag to be planted in the proximity of their position. They were intrigued by a software fault that caused them to get "stuck" in one portion of the field.
The students negotiated their own roles during the scouting activity. One student was the "driver," operating the controller that moved them around the field. A second student was the "photographer," deciding when to take snapshots and pushing the "shutter" button (actually, a key on a computer keyboard). The remaining two students were the note-takers.
Because the roles were viewed as differentially desirable, the children spontaneously (and quite smoothly) settled on a turn-taking regimen that allowed each student to serve in each role over the course of the activity. This worked well in terms of learner engagement, with the exception of the note-taking activity, where one student typically was temporarily resigned to watching another student write notes while offering suggestions (which were sometimes ignored by the scribe).
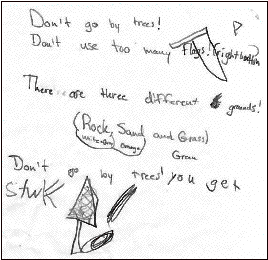
Figure 4. Notes taken by children during scouting activity.
Once the Snookerpuss research problem had been established in a whole-class session, six of the individual data collection groups took turns visiting the field. (The final data collection group served as "checkers" to test the predicted mushroom count developed from linear interpolation, but their activity was identical.) In class, the children had discussed the kind of data to be collected, and had developed a data table consisting of three labeled cells (one each for rocks, grass, and sand) within which they would make tally marks as they encountered mushrooms.
Drawing on the scouting experience, these groups were limited to two children apiece, as this would allow each child to have an active responsible role during data collection, with one child serving as driver and the other as data recorder. As with the scouts, turn-taking was unproblematic, with the children spontaneously sharing the two roles.
Accuracy of counting dominated discussion during the small group explorations. In the whole class setting, the children had discussed traversal algorithms for ensuring a complete count (see next section), and had decided to use the flags as a means of ensuring that individual mushrooms were not accidentally recorded more than once. Once they arrived in the virtual environment, however, they discovered that the traversal algorithms they had discussed were difficult to implement, and they began to explore alternatives.
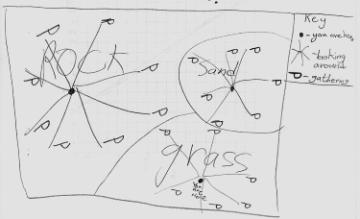
It was interesting to note that five of the seven exploration groups settled on a similar traversal strategy that had not been raised during the whole-class discussion. Rather than treating the whole field as a homogeneous space to be covered, they used the "natural" terrain to break the region into smaller areas. While the field as a whole was too large to use "naked eye" observations to spot the mushrooms, this strategy was more effective in the smaller regions. Figure 5 shows one group's depiction of a "radial scan" strategy that they had used during their exploration.
Figure 5. Terrain-based surveying developed by
exploration group.
Tier 2: Whole-class collaboration
Whole-class collaboration was situated at two points during the unit, first in the setting the research question and planning of the exploration, and later in the aggregation and analysis of data leading to a prediction of mushroom count based on linear interpolation.
Following the scouts' report, the teacher built on their observations and told them about the Snookerpuss, a mythical creature who was not represented in the application. The absence of the Snookerpuss drew a mixed response; some were relieved at not having to face what was portrayed as a potentially dangerous creature, while others were interested in talking about his physical characteristics. (Later in the school year, when the children told a visiting member of the school board about the Snookerpuss, they imbued him with all sorts of interesting physical characteristics. "He's about 12 feet tall and brownish-green and he's really mean and he has really sharp teeth".)
The fourth graders enthusiastically accepted the story line, and understood that they would have access to a (simulated) time series of the field. Based on their prior knowledge, the children readily volunteered hypotheses about which growing medium they believed would be best for the mushrooms. While the students had been introduced to categorical bar graphs, they had not yet worked with quantitative line graphs, but the class did reach consensus that if they knew the history of the mushroom population, they might be in a position to make an estimate of future populations. ("If there was like 10 mushrooms the first month, and like 20 mushrooms the second month, there should be like 30 mushrooms the third month, and like that.")
Using an overhead projector, volunteers presented suggestions for the design of a data table that could be used for data collection. Some students suggested maintaining a list, with each item in the list being the type of terrain in which mushrooms were found, but that we later rejected in favor of the tally system with labeled cells.
A considerable amount of time was spent dealing with the accuracy of counting. The scouts had reported that the field was too large for them to simply look around and see all the mushrooms, and the children recognized they would need to develop a traversal strategy. The teacher prompted discussion by asking whether any of the kids mowed lawns, and if so, how did they make sure that they had cut all of the grass. The students responded by drawing a variety of traversal algorithms (back-and-forth with offset, diagonal, spiraling inward) that they thought might be effective. No consensus was reached on a single strategy; this was left to the individual exploration groups.
Following the exploration of the field by the data collection groups, the children returned to the whole class setting prepared to present their data. In what turned out to be one of the most engaging activities of the whole unit, the children came forward, group by group, to fill in their month's population counts on a transparency projected to the whole class (Figure 6). Initially, the teacher had asked that one representative from each group come forward; this was quickly rejected by the children, who insisted that the whole group come forward, and that each member of the group be allowed to enter some of the data on the form. (Note that the October data was not yet entered at this point in the unit; these data were added later after the children had developed predictions for the October mushroom population and the "checking group" had gone back to test those predictions.)
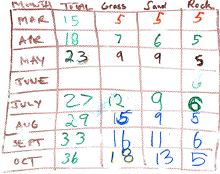
Figure 6. Aggregated data entered by children on overhead projector.
After the aggregate data had been entered, the each group proceeded to enter their point data onto a line graph, again at the overhead projector on a transparency sheet (Figure 7). For many of the students in the class, this was the first time that they had been asked to represent two-dimensional coordinate data, and the addition of a third variable (terrain type) depicted as multiple color-coded points on the same graph made the task even more complex. (As one child noted, "it looked like a bunch of stars".) Notwithstanding the lack of prior experience, the class collectively negotiated the process of representing the data on the graph. This period of the activity was characterized by a great deal of spontaneous interaction in the form of suggestions and constructive criticism. ("No, you're on the wrong line. Move it over to the right", "You've gotta use the red marker for that one", "You're reading your numbers wrong from the table.")
Once all of the groups had transcribed their tabular data onto the graph, the students were ready to draw in best-fit regression lines on which to base their predictions. Initially, the children suggested drawing line segments to connect the points. After some discussion, the students came to the realization that while this might be good for finding interpolated data (e.g., the missing June information), it would not provide them with a basis for extrapolation. With the teacher's guidance, they agreed that a single line which was "kind of in the middle of all the points" (in the words of one student) would let them predict mushroom populations into the future. With the help of many strongly vocalized suggestions, students drew best-fit lines on the graph.
Finally, the students discussed the meaning of the graph in relation to their research problem. They first concentrated on the critical question of whether the Snookerpuss's appetite would be satisfied. While there appeared to be universal consensus on the interpretation of the graph, there remained some debate on the Y-coordinate of the regression line. A tally of the student estimates is noted in the upper-right-hand corner of Figure 7. The Snookerpuss needed exactly 34 mushrooms to satisfy his appetite, so in spite of the individual differences, the class remained confident that there would be enough mushrooms when he awoke. The students also noted the differences in the growth rates by terrain; several of them talked about how some of the lines were "steeper" than the others ("like on a hill"), and there was strong agreement that the grass was the best place for mushrooms to grow ("and if you ran out of room on the grass, then you should plant them in the sand.") When the checking group returned with an actual count of 36 mushrooms in October (Figure 6), a cheer arose from the class.
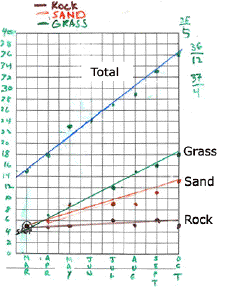
Figure 7. Student-drawn best-fit regression lines for
mushroom populations
DISCUSSION
At both the whole-class and small-group tiers, the Snookerpuss adventure was designed to promote positive interdependence among learners. At the classroom tier, it was impossible for any individual group to predict the outcome (the October mushroom count) without the information provided by other groups. At the small-group exploration tier, the self-assignment of roles made it impossible for an individual student to gather the necessary data without the cooperation of their group mates.
In related research involving Shared Display Groupware (Stewart, et. al, 1999), Inkpen and her colleagues found that the presence of multiple input device had a significant impact on students' sense of engagement, as measured by off-task behavior and level of activity (Inkpen, et. al, 1999). Our qualitative experience mirrors the results in her study, with the difference that in the case of the Snookerpuss adventure, engagement increased as a function of children having a critical role, rather than necessarily having their hands on an input device. The responsibility for manual data recording appeared to compensate for the absence of a widget.
(Recently, we have begun to augment our virtual ambient systems with handheld devices directly supporting data collection; a test of manual vs. handheld data collection modalities might shed light on their relative merits. However, the availability of an electronic input device, even if more engaging, might not be warranted from a learning perspective; Holst (1996), for example, reported on a study in which the use of interactive computer graphics was associated with lowered mastery of content materials.)
How did children make sense of this activity: was it a game, or was it a math lesson, or was it a field? The fourth graders in this class were happy to suspend disbelief, and the language of both the small groups and the classrooms was of fields, mushrooms, and the Snookerpuss, and not of glasses, keyboards, or screens. In discussing the data in the whole class, the children never questioned whether their counts were "wrong," in spite of the fact that their data was not collinear. To the students, this was just a field, and this was just the way things were in this field.
What did the kids learn? As mentioned earlier, 75% of the children were able to use a data table to construct a graph, draw a best-fit line, and make extrapolated predictions in a post-test applied several days after the unit. On average, they were also able to articulate 3-4 distinct strategies for ensuring accurate counting. (In follow-up discussions with the children, they were very interested to know how accurately they had counted. The teacher related the importance of counting to recent events in the U.S. presidential election, which had taken place only a few weeks earlier.) More importantly, as reported by their teacher, the students continued to cite the Snookerpuss Adventure in subsequent lessons in mathematics and science through the remainder of the school year. While anecdotal, this evidence supports the conjecture that the activity was both memorable and meaningful to the students. Perhaps the most important outcome of the activity was the adoption among the students of an attitude of competence in the conduct of scientific investigations; in the words of one girl, "We're little scientists."
The activity structure exemplified in the Snookerpuss adventure has now been employed on a half-dozen units conducted at grades two, four, and six using different configurations of the Field to support different mathematics learning goals. It has proven to be a workable model for providing shared access to a scarce resource within a conventional school setting, and teachers have been able to easily integrate the small-group activities into their regular educational program. Innovative technologies embody potential that may only be realized by a deep sensitivity to the context of their deployment (Brown & Edelson, 1999), and the activity structure described here is intended as a small advance in that evolution.
We expect that technology advances will relatively render the marginal cost of
using large displays—and even virtual reality systems—insignificant
over the next decade. However, continuing personnel costs cannot be expected to
decrease, so that a model based on adult-supervised pullouts is not sustainable
in the long run. In our most recent projects, we have begun to explore the use
of large-format displays (plasma panels) deployed directly in the classroom,
under varying models of guided inquiry.
Figure 8. Children using virtual ambient deployed on a
plasma panel in a sixth grade room
ACKNOWLEDGMENTS
The authors wish to express their gratitude to Victor Baez and his fourth grade students. We also wish to acknowledge the help of Andy Johnson, Yalu Lin, and Yongjoo Cho in the development of the Field application, the advice of Josh Radinsky and Marlynne Nishimura in the design of the unit, and the suggestions of the anonymous referees. This work was supported, in part, by the National Science Foundation's Graduate Students in K-12 Education (DUE-9979537) and Information Technology Research (EIA-0085946) programs.
References
American Association for the Advancement of Science (1993) Benchmarks for Science Literacy: Project 2061. Oxford University Press, New York, NY.
Brown, M., and Edelson, D. (1999) A Lab
by Any Other Name: Integrating Traditional Labs and Computer-Supported
Collaborative Investigations in Science Classrooms. Proceedings of CSCL ’99 (Palo Alto, CA, Dec.
1999), 73-80.
de Jong, T., van Joolingen, W.R., Swaak, J., Veermans, K., Limbach, R., King, S., and Gureghian, D. (1998) Self-directed learning in simulation-based discovery environments. Journal of Computer Assisted Learning, 14, 235-246.
Dewey, J. (1910) Science as subject-matter and as method. Science, 31, 121-127.
Friedler, Y., Nachmia, R, and Linn, M. (1990) Learning scientific reasoning skills in microcomputer-based laboratories. Journal of Research in Science Teaching, 27, 173-191.
Holst, S. (1996) Directing learner
attention with manipulation styles. CHI '96 Conference Companion (Vancouver, Canada,
April 1996), 43-44.
Inkpen, K., Ho-Ching, W., Kuederle, O.,
Scott, S. and Shoemaker, G. (1999) "This is Fun! We’re All Best
Friends and We’re All Playing.”: Supporting Children’s
Synchronous Collaboration. Proceedings of CSCL ’99 (Palo Alto, CA, Dec.
1999), 252-259.
Jackson, R., and Winn, W. (1999) Collaboration and Learning in Immersive Virtual Environments. Proceedings of CSCL ’99 (Palo Alto, CA, Dec. 1999), 260-264.
Jackson, S., Stratford, S., Krajcik, J., and Soloway, E. (1994) Making dynamic modeling accessible to pre-college science students. Interactive Learning Environments, 4, 3, 233-257.
Moher, T.,
Johnson, A., Cho, Y., and Lin, Y. (2000) Observation-Based Inquiry in a Virtual
Ambient Environment. In B. Fishman & S. O'Connor-Divelbiss (Eds.), Fourth
International Conference of the Learning Sciences (Ann Arbor , MI, June 2000), Erlbaum,
Mahwah NJ, 238-245.
Moher, T., Johnson, A., and Cho, Y. (2001) First-Person Science Inquiry in Virtual Ambient Environments. CHI 2001 Extended Abstracts (Seattle, WA, March/April 2001), 261-262.
National Council of Teachers of Mathematics (NCTM) (1998) Principles and Standards for School Mathematics Electronic Version: Discussion Draft (http://standards-e.nctm.org/1.0/normal/index.html).
National Research Council. (1996) National science education standards. National Research Council, Washington DC.
Smith, B. and Reiser, B. (1998) National Geographic unplugged: Classroom-centered design of interactive nature films. Proceedings of CHI '98 (Los Angeles, CA, May 1998), 424-431.
Soloway, E., Grant, W., Tinker, R., Roschelle, J., Mills, M., Resnick, M., Berg, R., and Eisenberg, M. (1999) Science in the Palms of Their Hands. Communications of the ACM, 42, 21-26.
Stewart, J., Bederson, B., and Druin, A.
(1999) Single display groupware: A
model for co-present collaboration. Proceedings of CHI '99 (Pittsburg, PA, May
1999), 286-293.