
Visual Analysis of a Smart City’s Energy Consumption
May 2nd, 2019
Categories: Applications, User Groups, Visualization, Visual Analytics, Visual Informatics
Authors
Trabucco, J., Lee, D., Derrible, S., Marai, G.E.About
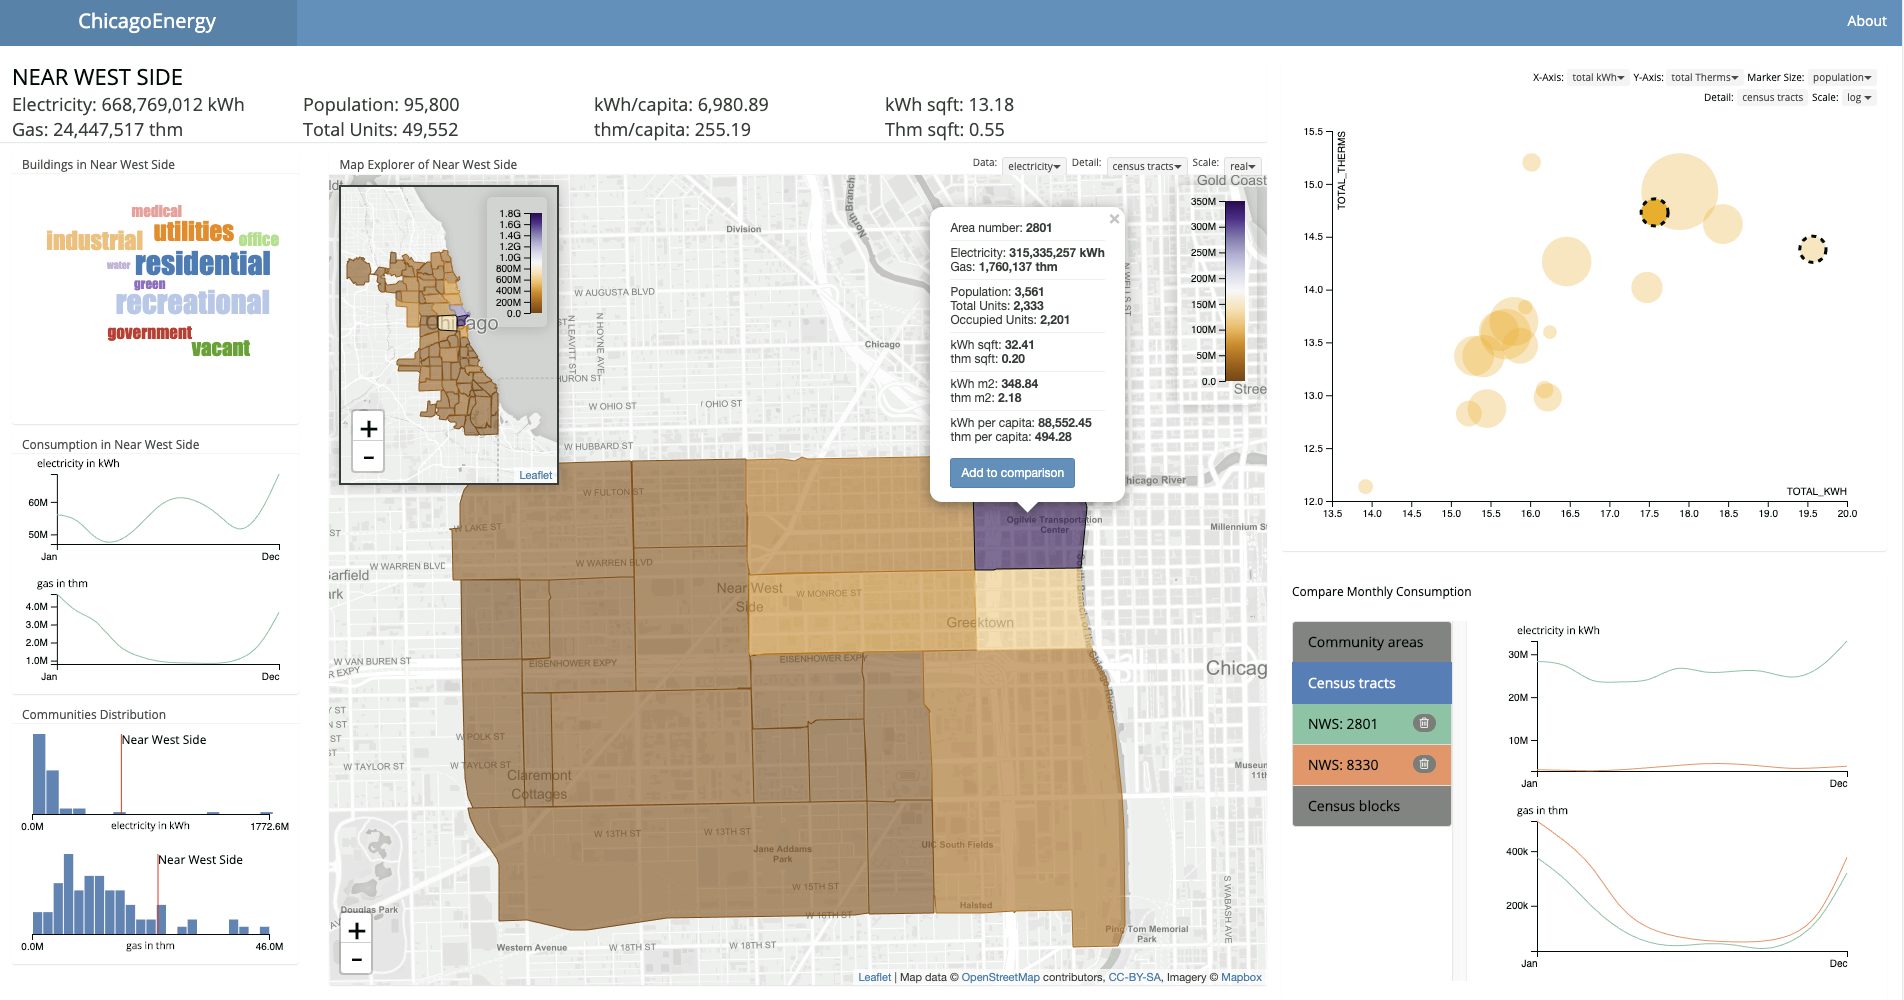
Through the use of open data portals, cities, districts and countries are increasingly making available energy consumption data. These data have the potential to inform both policymakers and local communities. At the same time, however, these datasets are large and complicated to analyze. We present the activity-centered-design, from requirements to evaluation, of a web-based visual
analysis tool to explore energy consumption in Chicago. The resulting application integrates energy consumption data and census data, making it possible for both amateurs and experts to analyze disaggregated datasets at multiple levels of spatial aggregation and to compare temporal and spatial differences. An evaluation through case studies and qualitative feedback demonstrates that this visual analysis application successfully meets the goals of integrating large, disaggregated urban energy consumption datasets and of supporting analysis by both lay users and experts.
Keywords: Interactive Visualization; Visual Design; Sustainability
Resources
Citation
Trabucco, J., Lee, D., Derrible, S., Marai, G.E., Visual Analysis of a Smart City’s Energy Consumption, Multimodal Technologies and Interaction Special Issue on Interactive Visualizations for Sustainability, pp. 1-13, May 2nd, 2019.