Piazza
Gallery
Final Projects Fall 2023
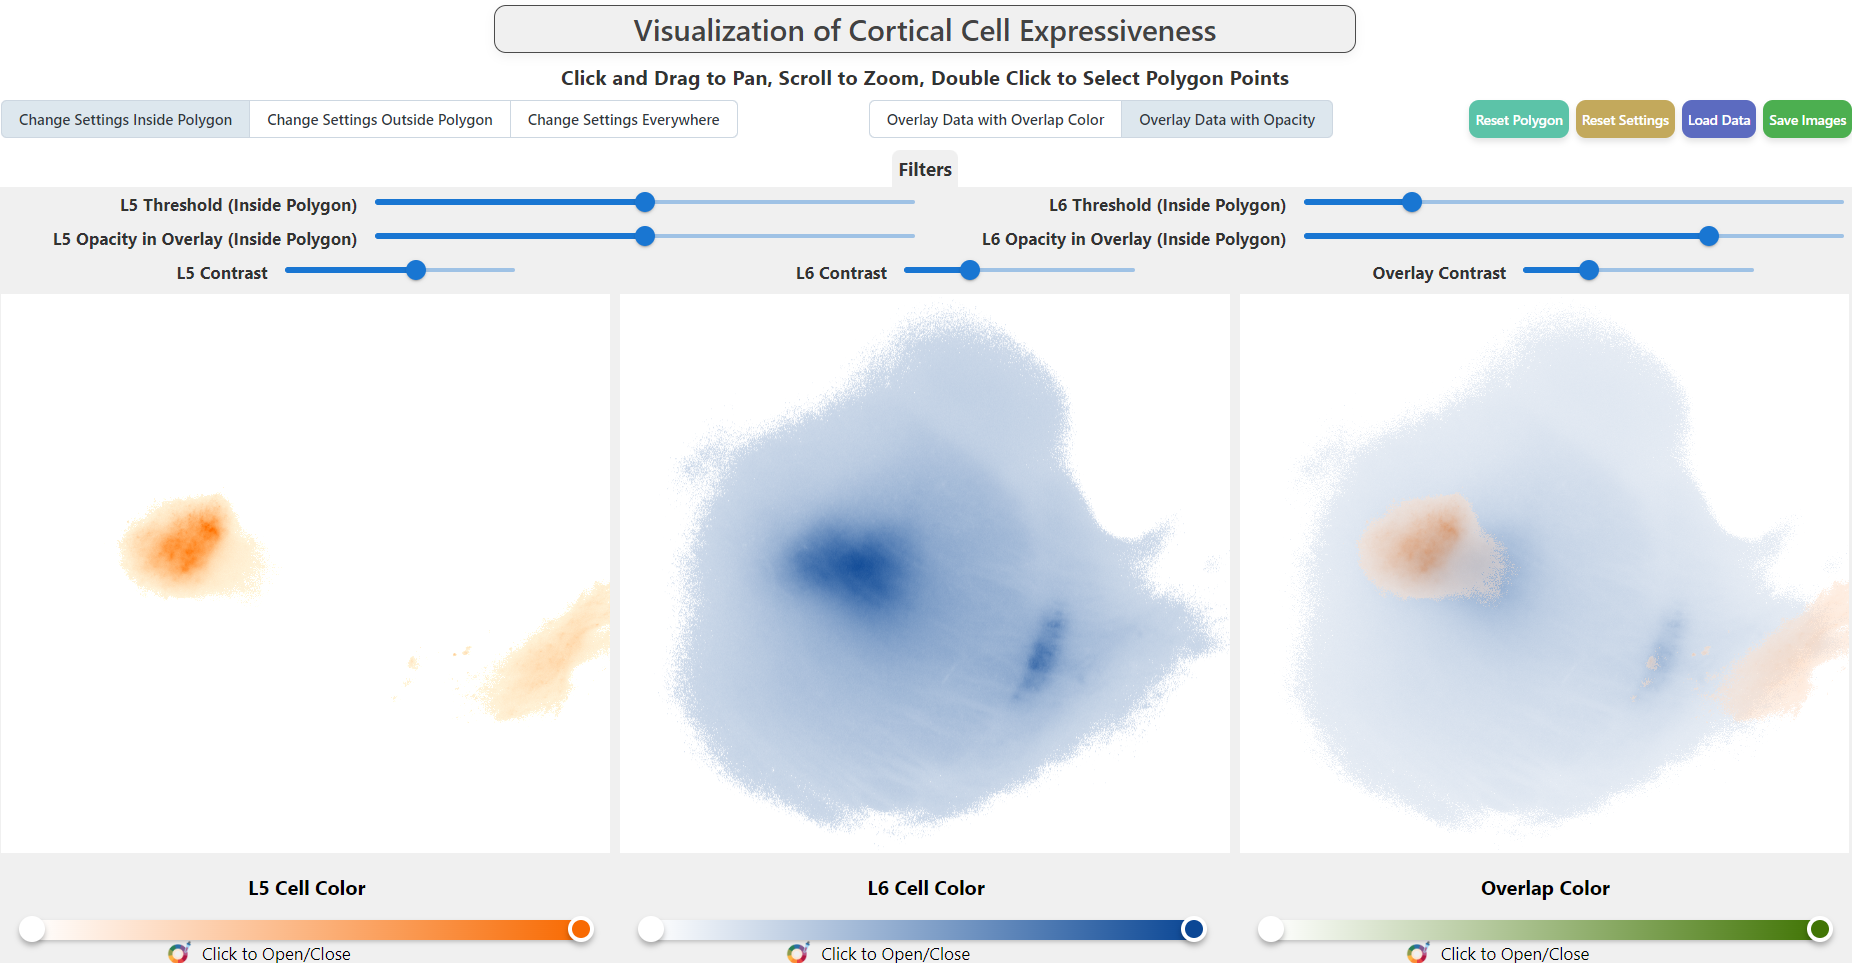
Visual Exploration of Cortical Cell Expressiveness in Neural Pathways
Group: Landon Dyken, Rajasharathchandra Reddy Kandadi, and Farah Kamleh
We propose a system for visually comparing differences in cortical
cell expressiveness within neural pathways, specifically looking at
the pathway between the reticular thalamus and sensory cortex.
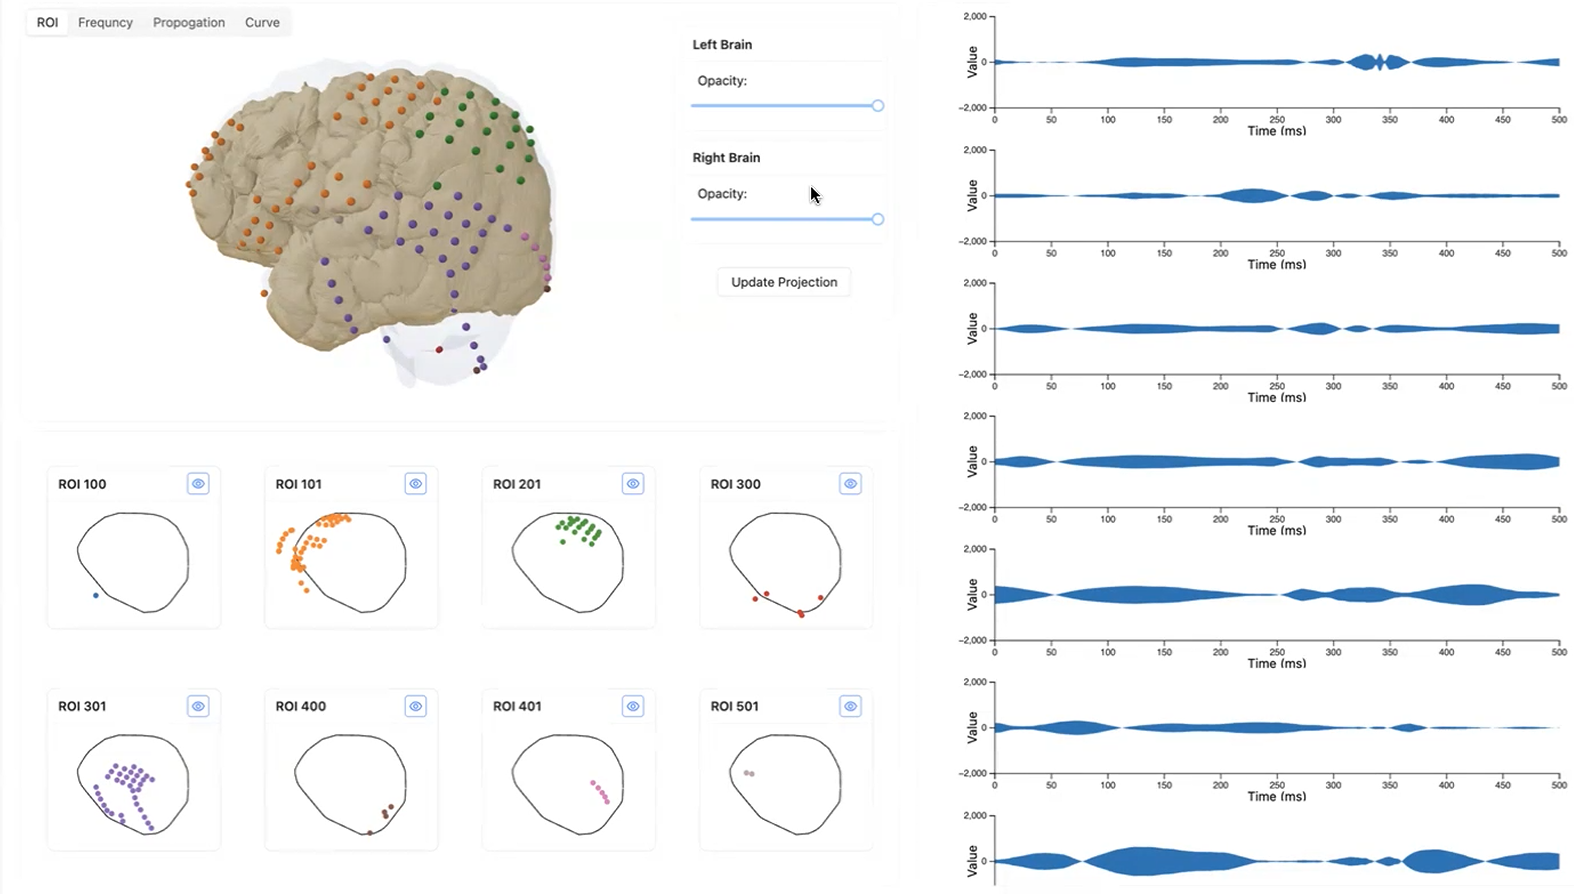
Electrical activity visualization analysis tool for diagnosing epileptic seizures and propagation
Group: Siyuan Zhao, Nasibeh Heshmati, Hamed Khaleghi
To enhance the diagnosis and management of patients with severe
epilepsy, it's imperative to detect epileptic seizures using EEG
signals from multiple electrodes accurately. Current challenges stem
from inadequate time series analyses and difficulties pinpointing
the precise etiology of the seizures. To address this, our project
endeavors to introduce a sophisticated visual analysis tool. This
will empower physicians to more accurately determine the origin and
the intracranial propagation pathways of epileptic activity.
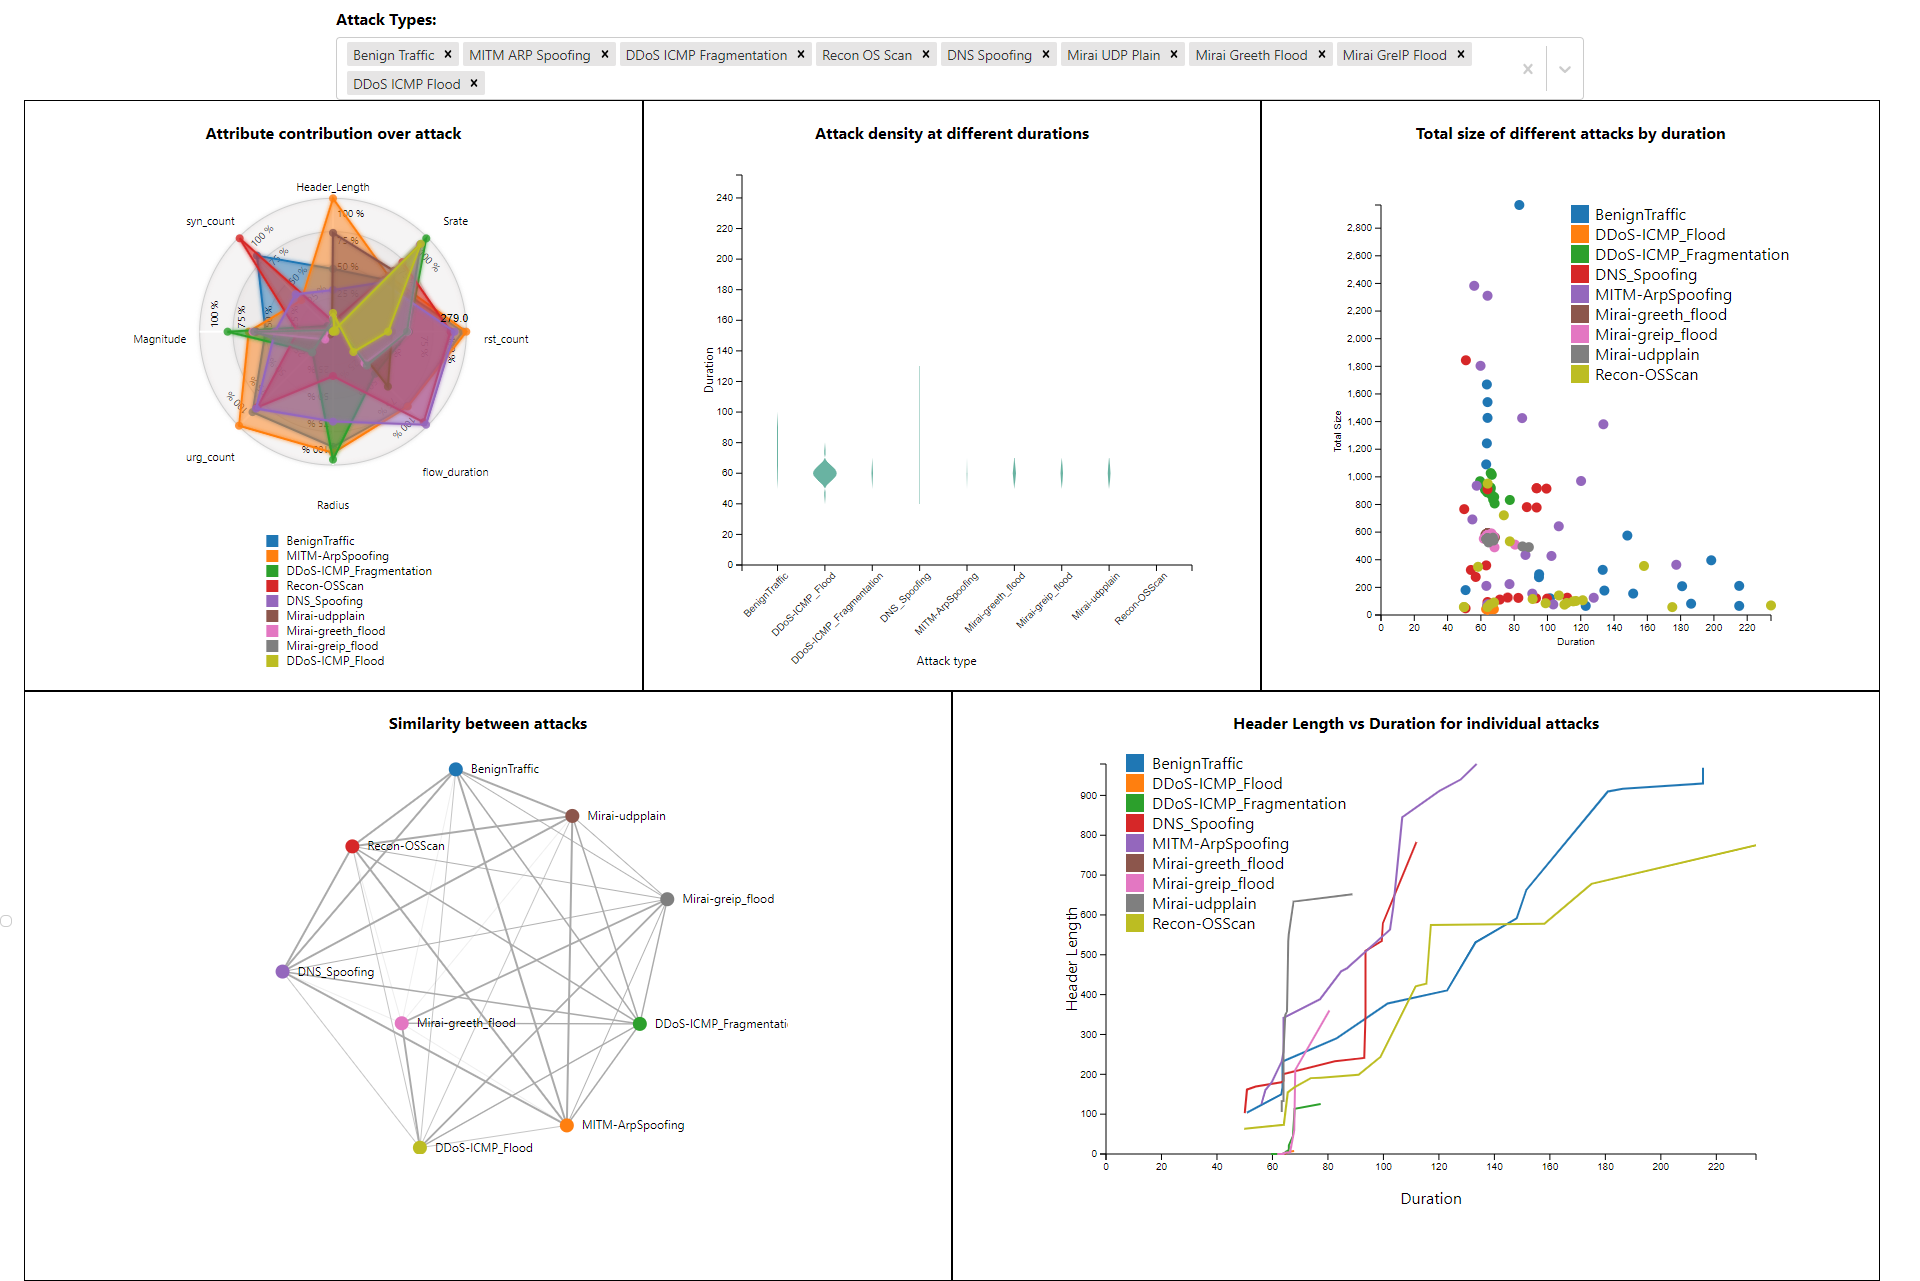
Visualization of Trends in Multiple Network Attacks on IoT Devices
Group: Arka Pal, Chintan Dobariya, Sudhanshu Basuroy
In this project, we look to analyze trends between different types
of attacks and their effect on IOT devices, keeping in mind their
specializations and causes.
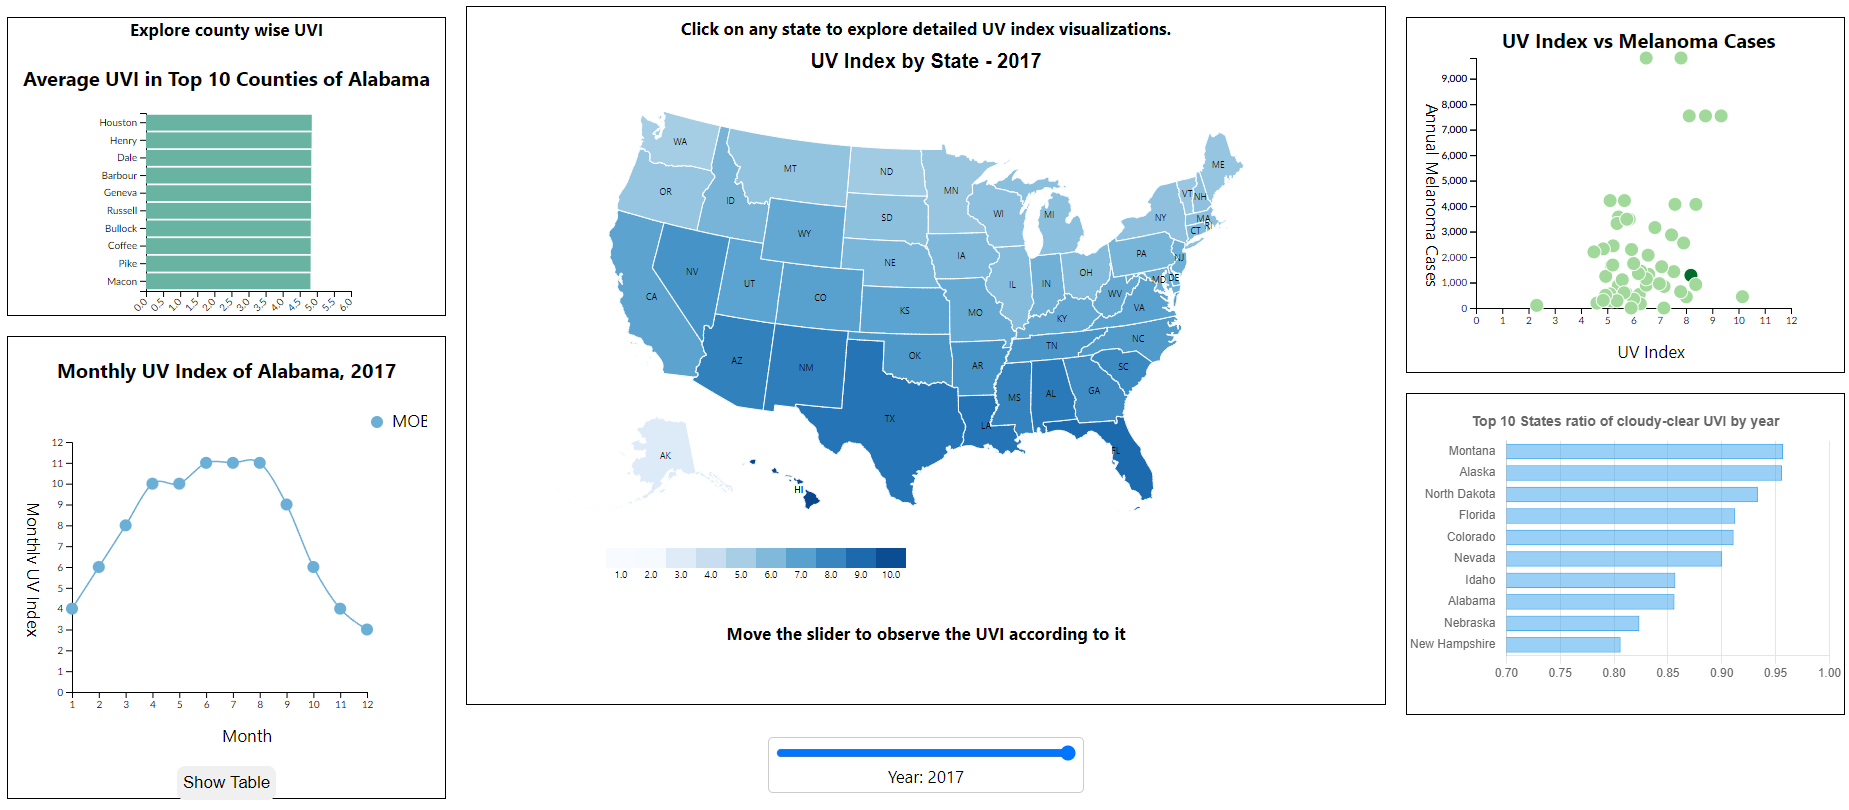
Understanding the Impact of Ultraviolet Radiation on Skin Diseases
Group: Teresa Pham, Akkala Thanmayi, Subba Rao Revanth Varanasi
This project aims to explore the complex relationship between UV
radiation and people by visualizing the US regions more prone to
ultraviolet radiation and the specific diseases associated with UV
radiation.
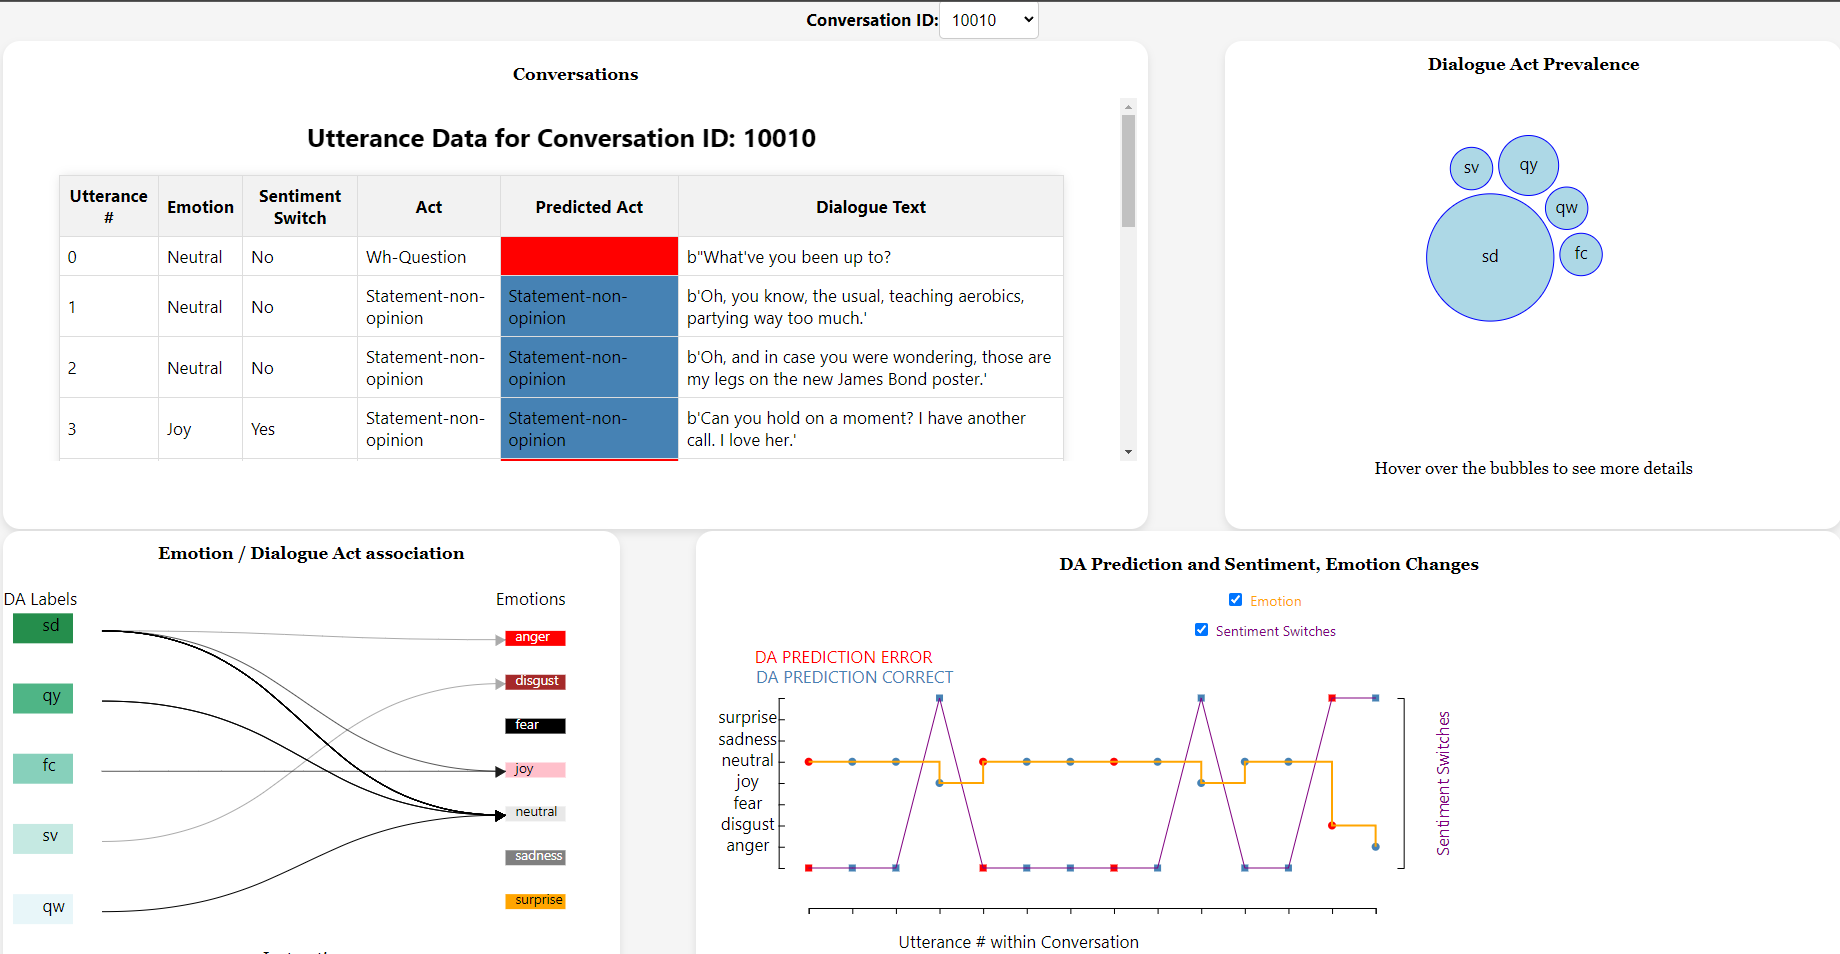
Dialogue Act Prediction Visualization
Group: Sajal Chandra, Paul Dougherty, Karthik Vedaraju
We propose a visualization tool that will show relationships of
dialogue act label and candidate predictive factors like emotion and
turn-taking, as well as experiment with visuals that will display
more structural effects of the neural network classifier.
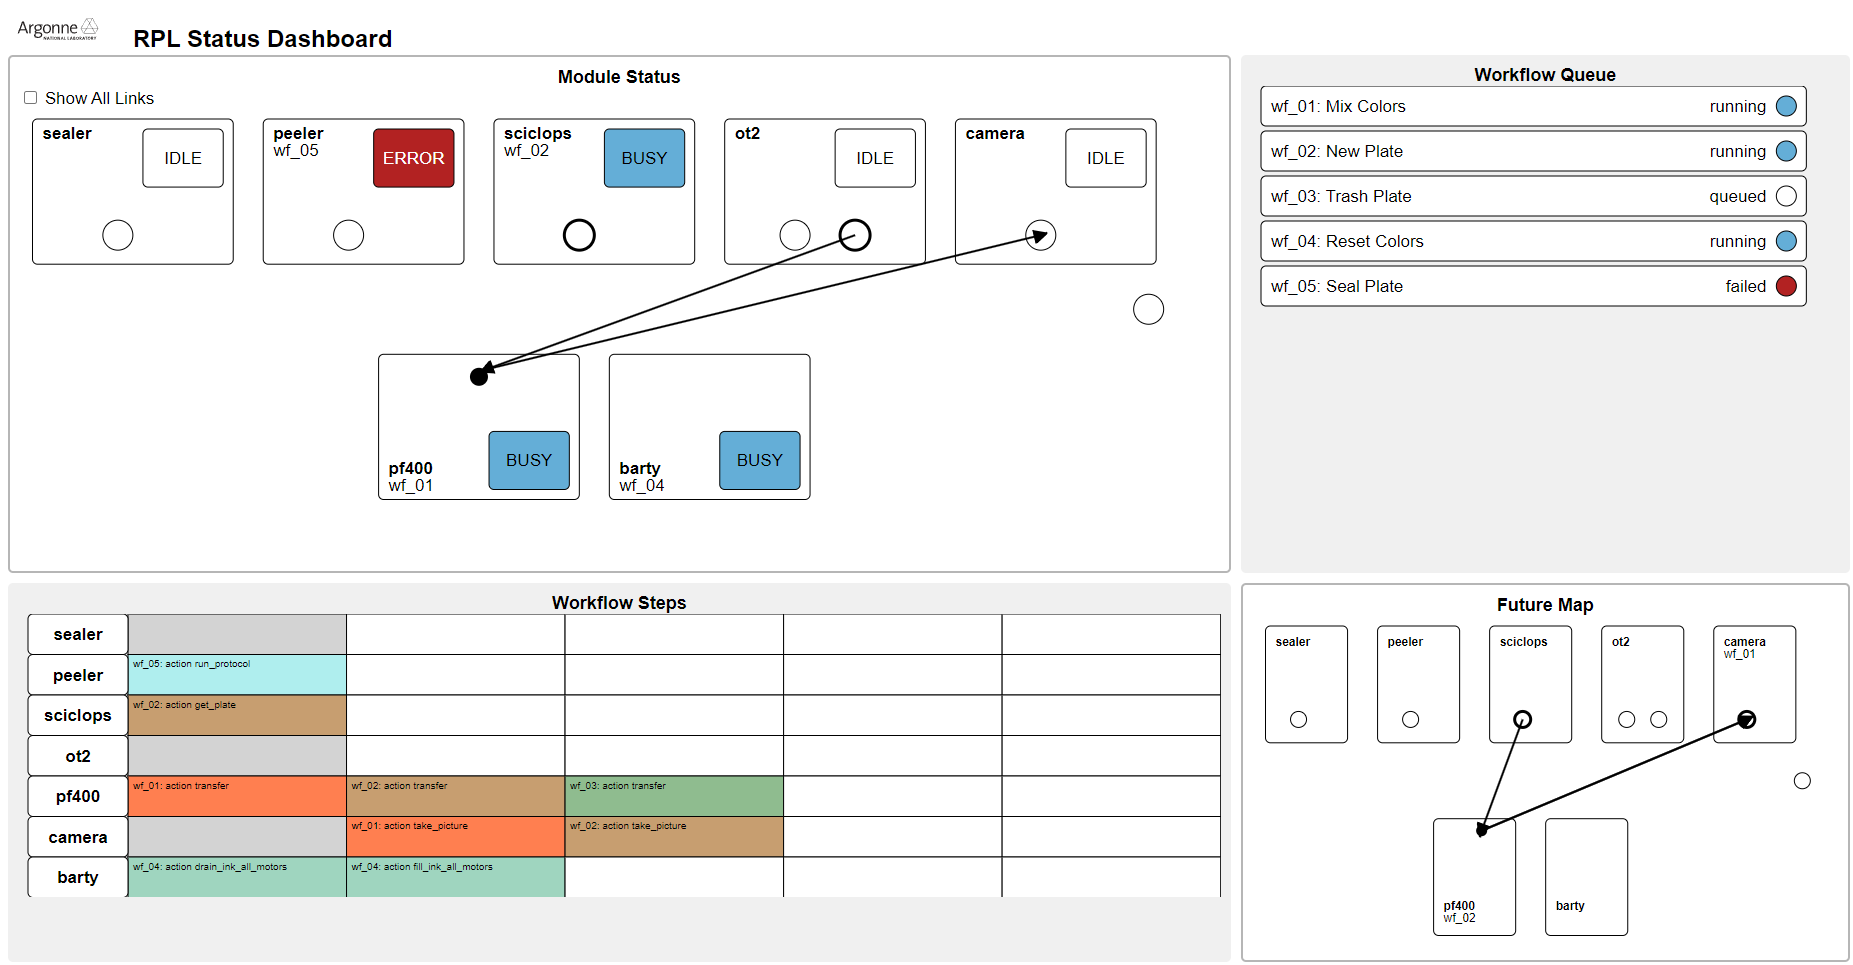
System Status Visualization For Argonne's Rapid Prototyping
Lab
Group: Dheeraj Kumar Buchala, Hal Brynteson
We will create a web-based visualization to allow Rapid Prototyping
Laboratory developers and users to see the status of the system with
respect to submitted experiments and physical modules.
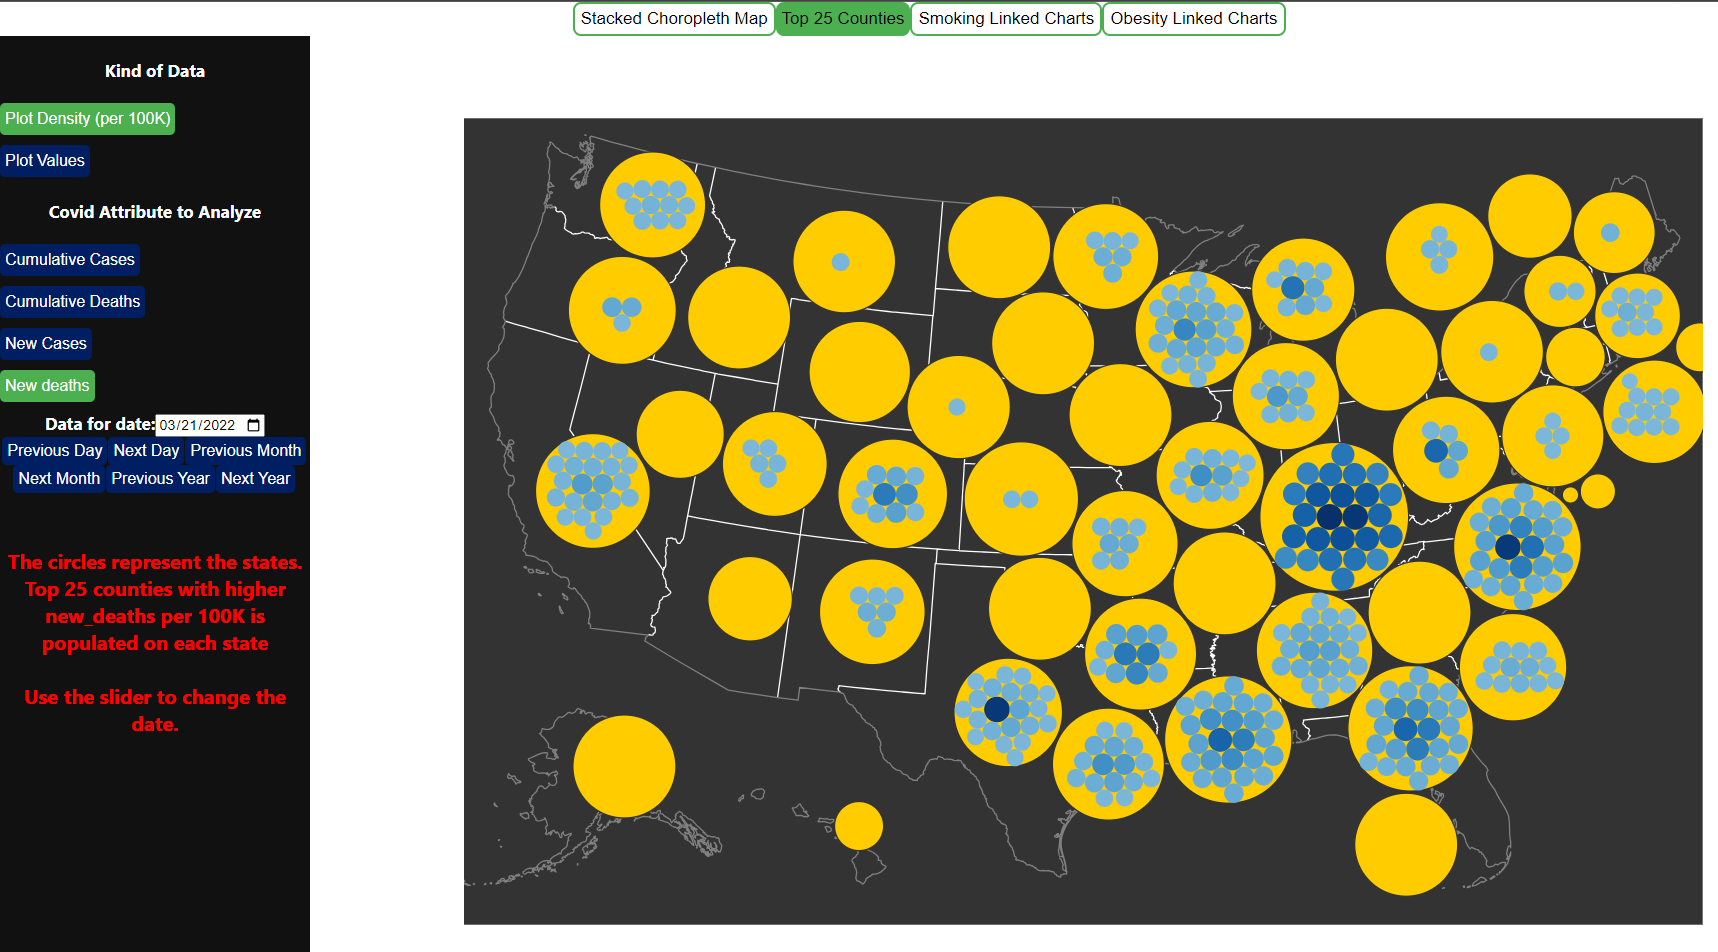
Visualizing the Influence of Health Factors, Social
Vulnerability, and COVID-19 Outcomes in the United States
Group: Kavya Rama Nandana Sidda, Ridhuparan Kungumaraju, Chandhu
Bhumireddy
This project seeks to analyze and visually depict the intricate
connections between health determinants, social vulnerabilities, and
COVID-19 outcomes, shedding light on their impact and empowering
individuals, communities, and policymakers to make informed
decisions amidst the pandemic and future public health challenges in
the United States.
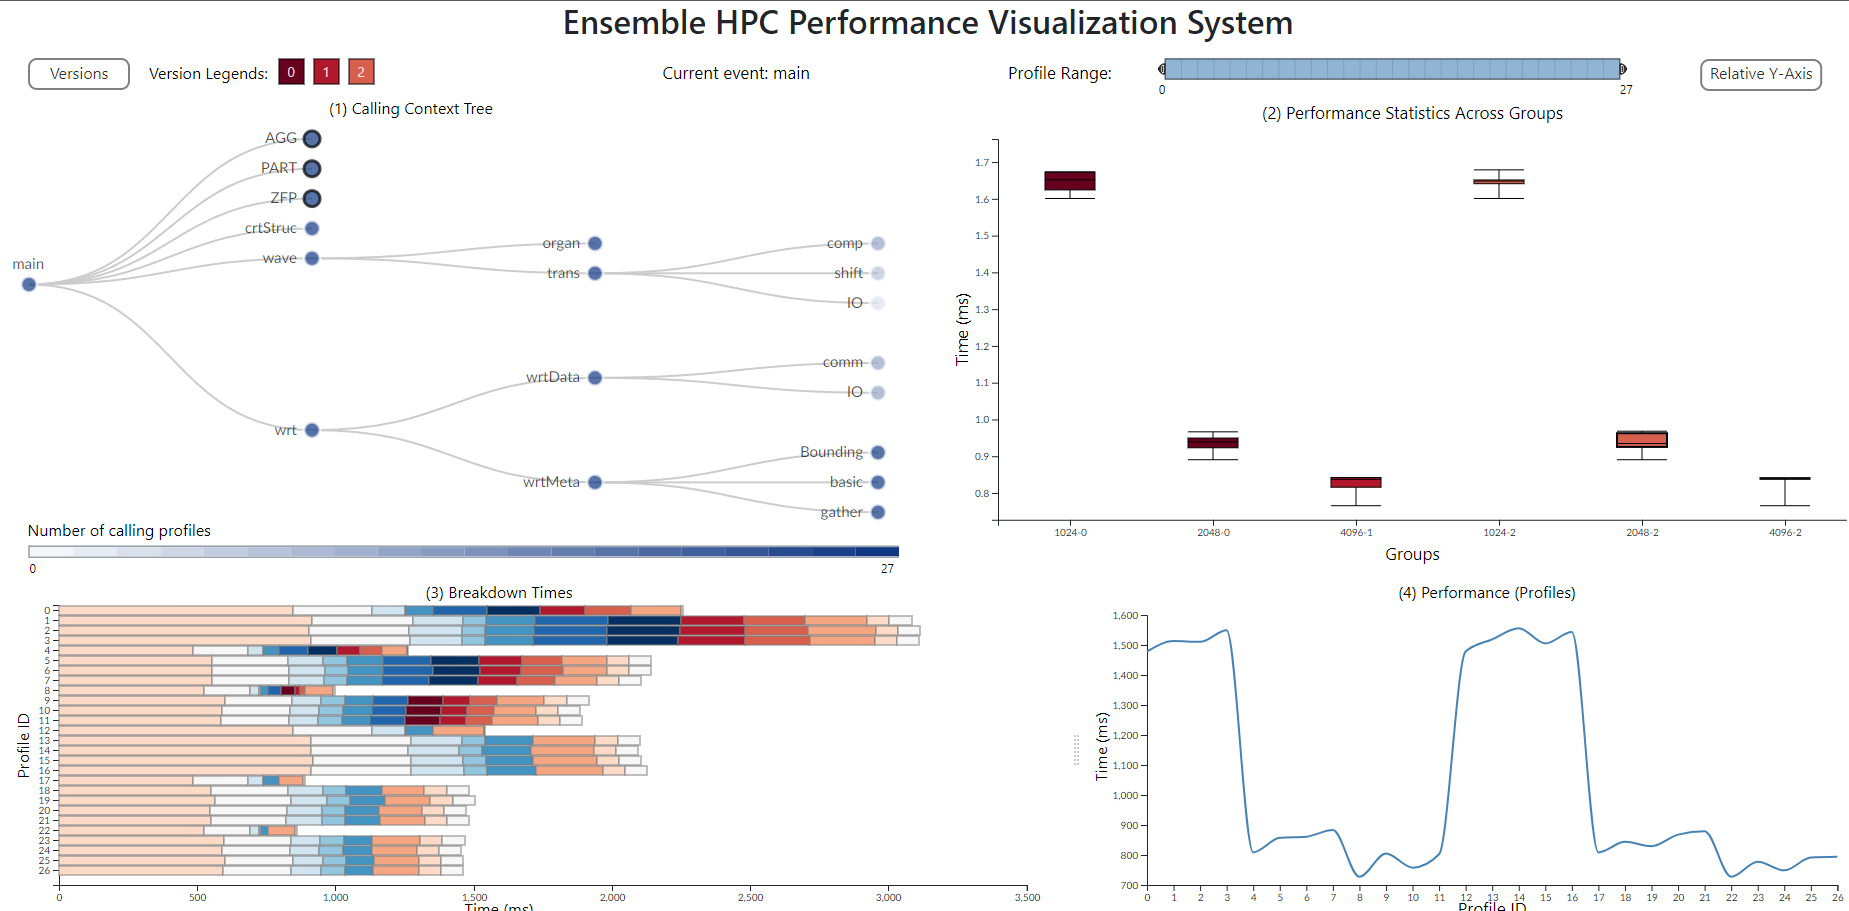
Scalable Comparison Ensembles of Performance of Large-Scale
Applications
Group: Ke Fan, Ahmedur Rahman Shovon
We propose a scalable comparison ensemble performance visualization
system for large-scale applications that enables exploration of
multiple calling-context-tree (CCT) with high scalability in a
limited screen space.
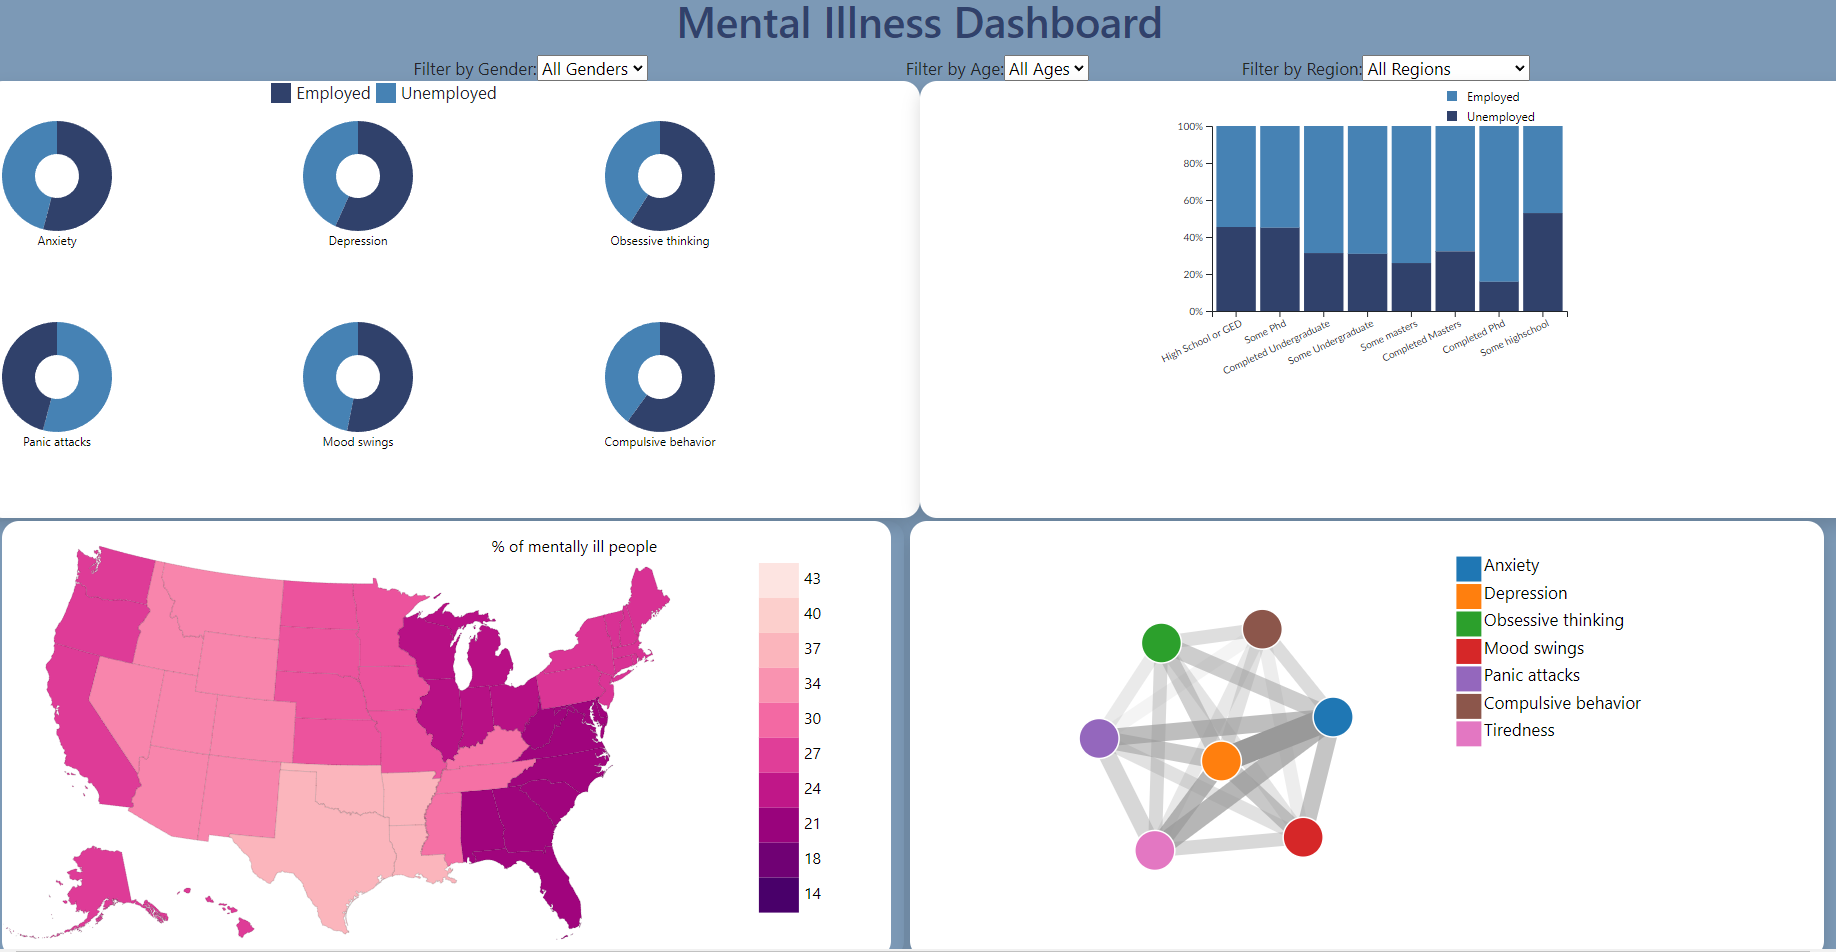
Causes of Mental Illness (surrounding unemployment)
Group: Vibhu Dagar, Pranav Bhardwaj, Harishobith Reddy Anantha
The intersection of unemployment and mental illness represents a
critical and pressing concern for society. The issue of joblessness
not only impacts an individual's financial stability but also has
far-reaching implications for their mental health and overall
well-being. In an era marked by data-driven decision-making, my data
visualization project seeks to shed light on the complex
relationship between unemployment and mental illness, leveraging a
diverse dataset encompassing various socio-demographic factors.
MOFVis: Exploring Metal-Organic Frameworks through
Visualizations
Group: Venkata Sesha Phani, Vakicherla, Srikanth Kyatham, Sri Sai
Kiran Reddy Gorla
The MOFVis project develops a web application that facilitates the
exploration of Metal-Organic Frameworks (MOFs) by providing
researchers with advanced visualization tools to connect structure
to function and accelerate MOF-related discoveries.
Final Projects Fall 2022
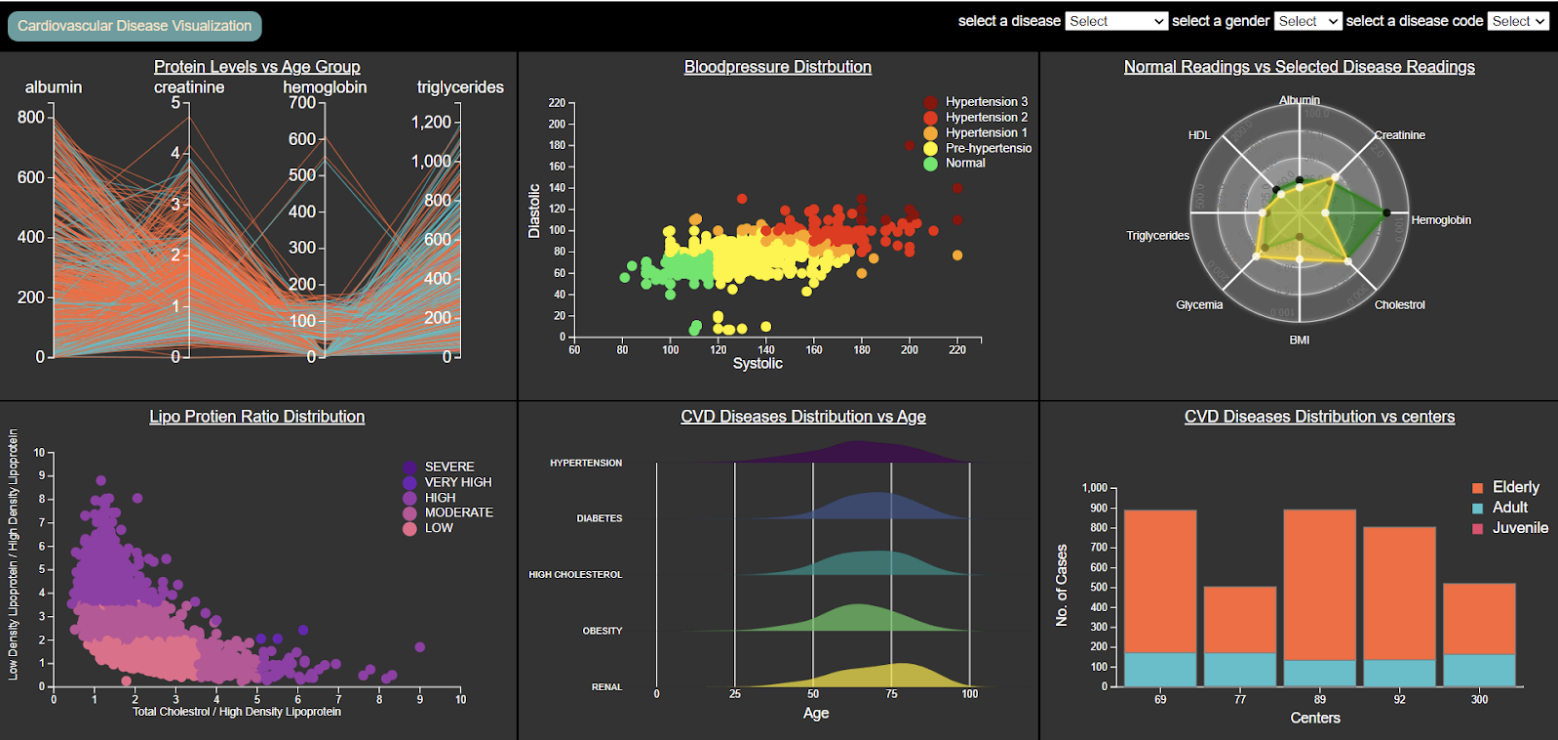
Cardiovascular Disease Visualization
Group: Aditya Ranganathan, Kuldeep Singh, Nikita Thakur (CS)
This project was designed for analyzing trends in the flow of medical care for patients suffering from
cardiovascular diseases.
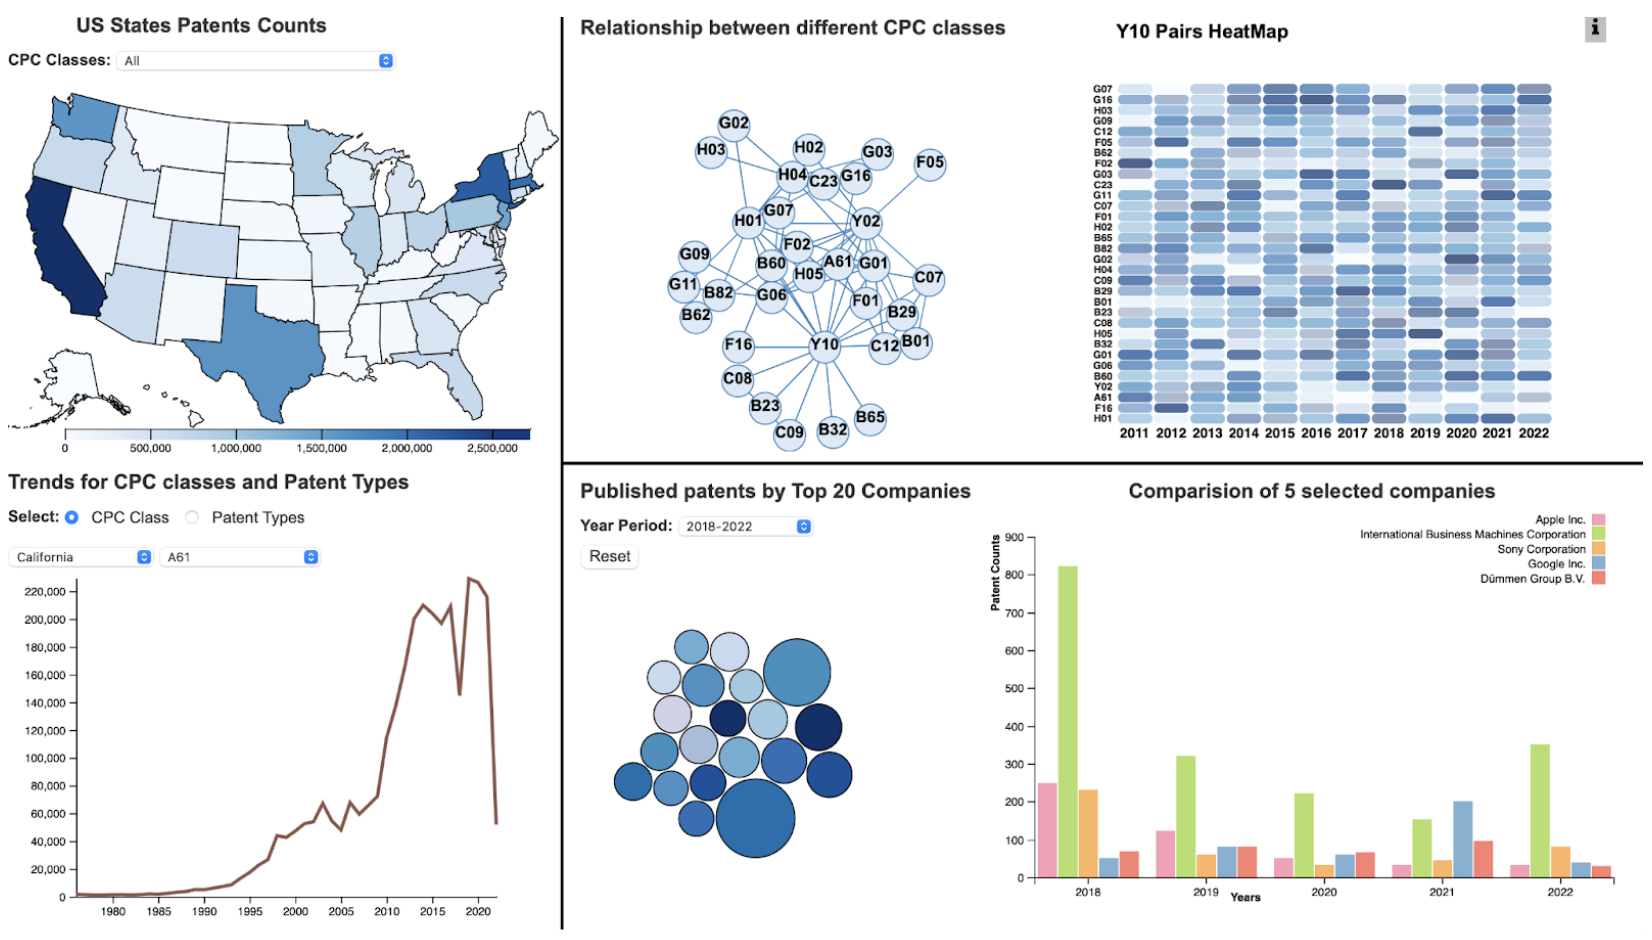
Visualization of
Trends of Patent Popularity and Impact via Network Analysis
Group: Amulya Boyapati, Indu Reddy Pati, Rahul Sai Samineni (CS)
The project proposes an idea to visualize the patent data with deep insights including the trends of classes,
sub-classes, kinds and different factors and innovation areas influencing the patent publications.
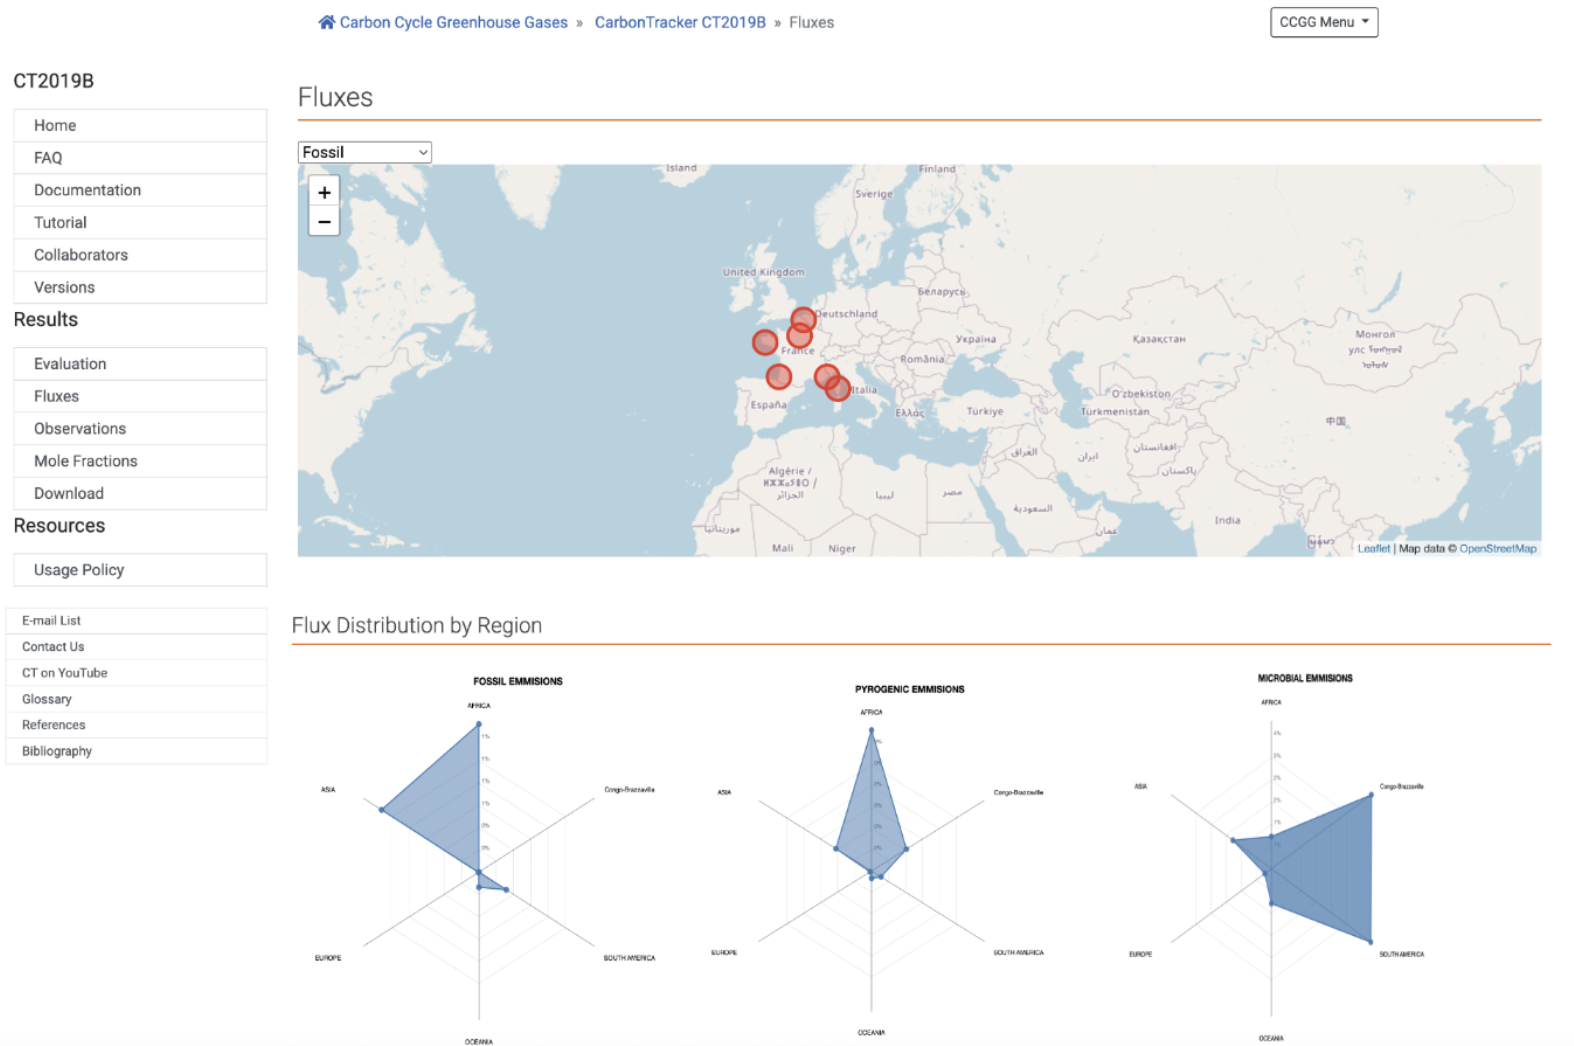
Visualizing the NOAA CarbonTracker-CH4
Data Assimilation Product
Group: Matt Ziminski, Neil Chawla, Shreya Raj Kati
(CS)
The project proposes an Interactive Visualization Tool to implement version 2.0 of an up-and-coming NOAA
dataset publication.
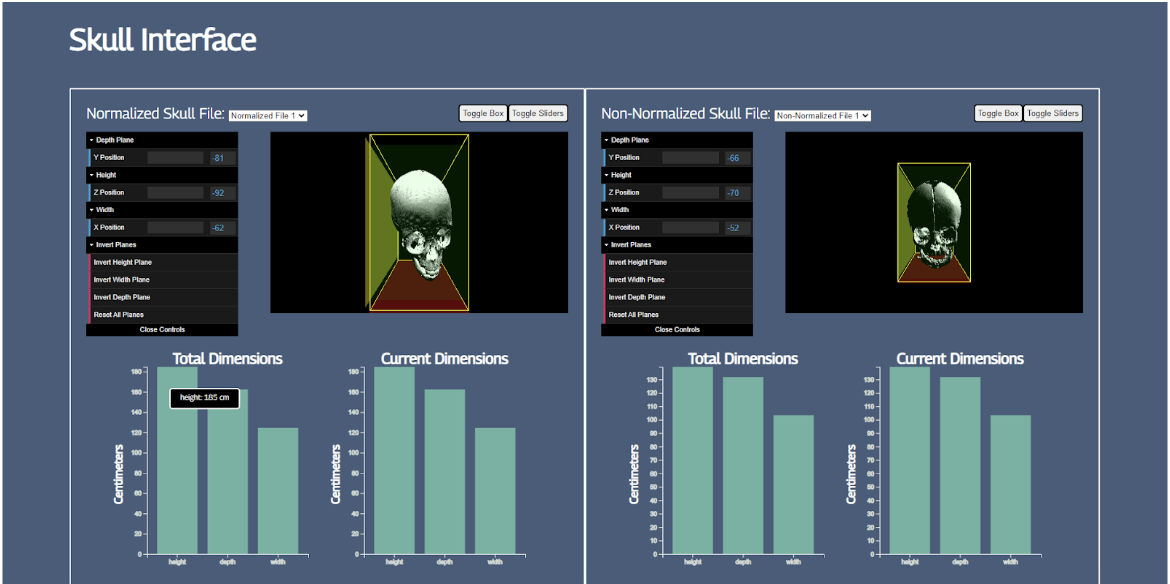
Normative Skull Interface to
Contest Craniosynostosis
Group: Robert Finedore, Ajay Marampalli, Karan Jogi (CS)
The project outlines a proposal for a novel data visualization project. The goal of this project is to create
a robust system that allows surgeons or medical students to generate a normative model of a skull in order to
assist them in performing surgery on infants suffering from Craniosynostosis.
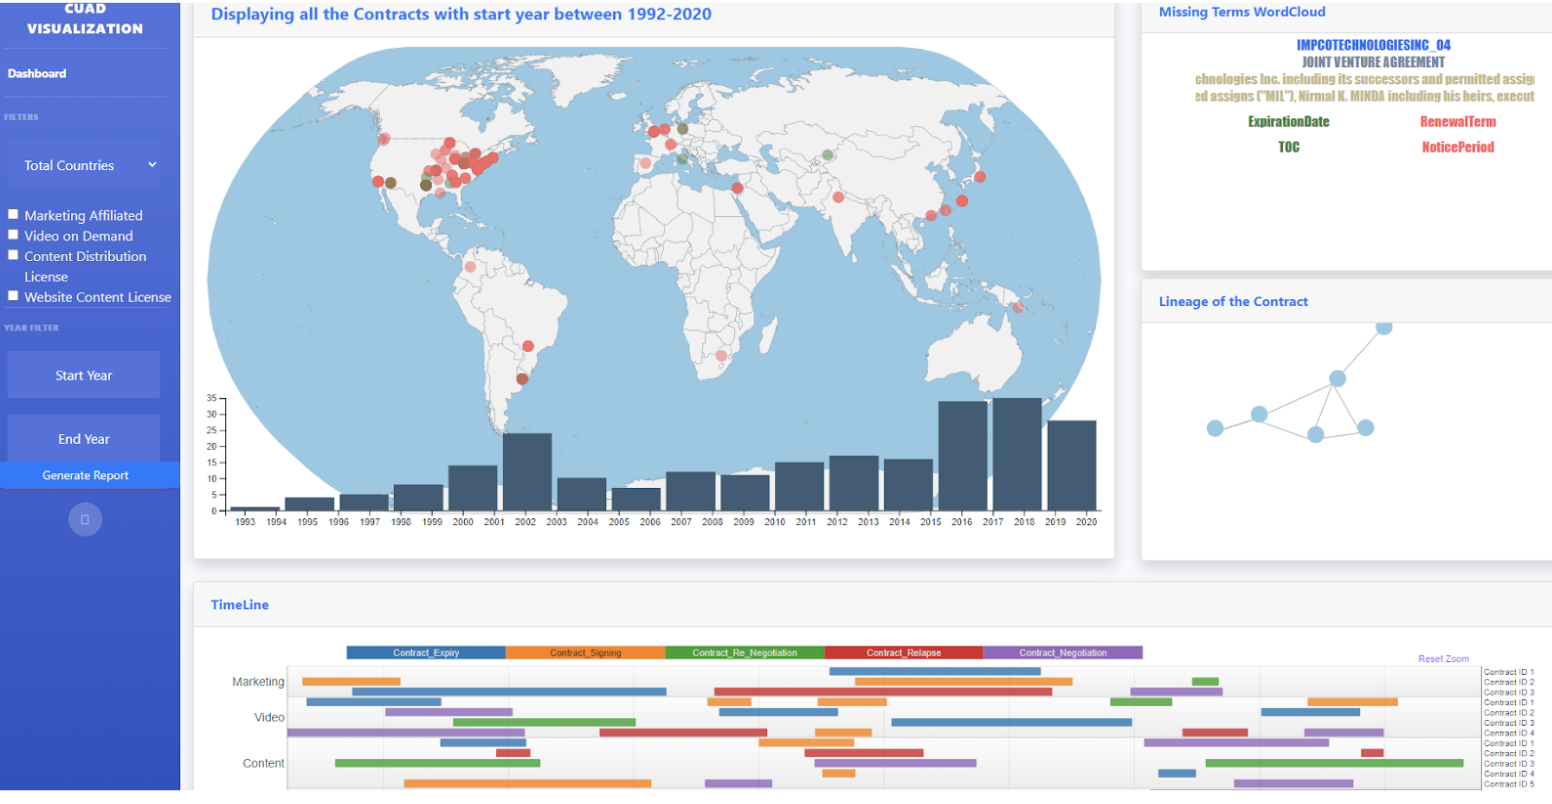
Visualization of
CUAD-A Dataset for Legal Contract Reviews
Group: Sunil Belde, Vivek Nadimpalli, Anantha Rohan Parankusham (CS)
The purpose of this project is to create a platform to visualize the contracts which helps the users to easily
identify the key terms and risk of the contracts. This would accelerate the process of reviewing a contract
and reduce the manpower required.
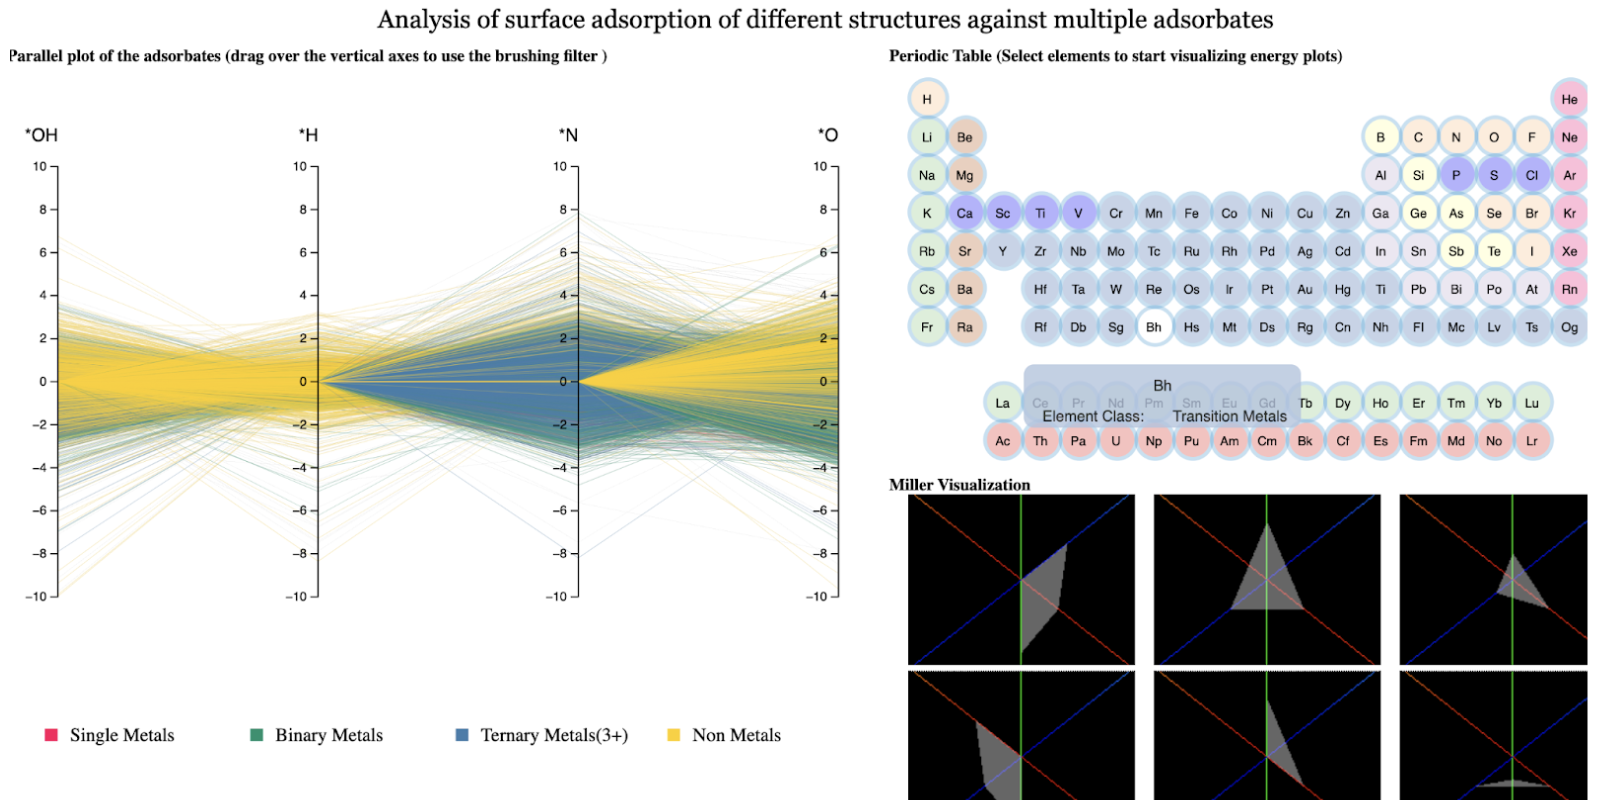
Analysis of Surface Adsorption of Different Structures Against Multiple Adsorbates
Group: Vikram Abhishek Sah, Kushal Reddy Palvai, Narendra Sairam Murthy Buddhavarapu (CS)
Project idea: Creating a visualization dashboard which aids in the analysis of surface adsorption of different structures against multiple adsorbates.
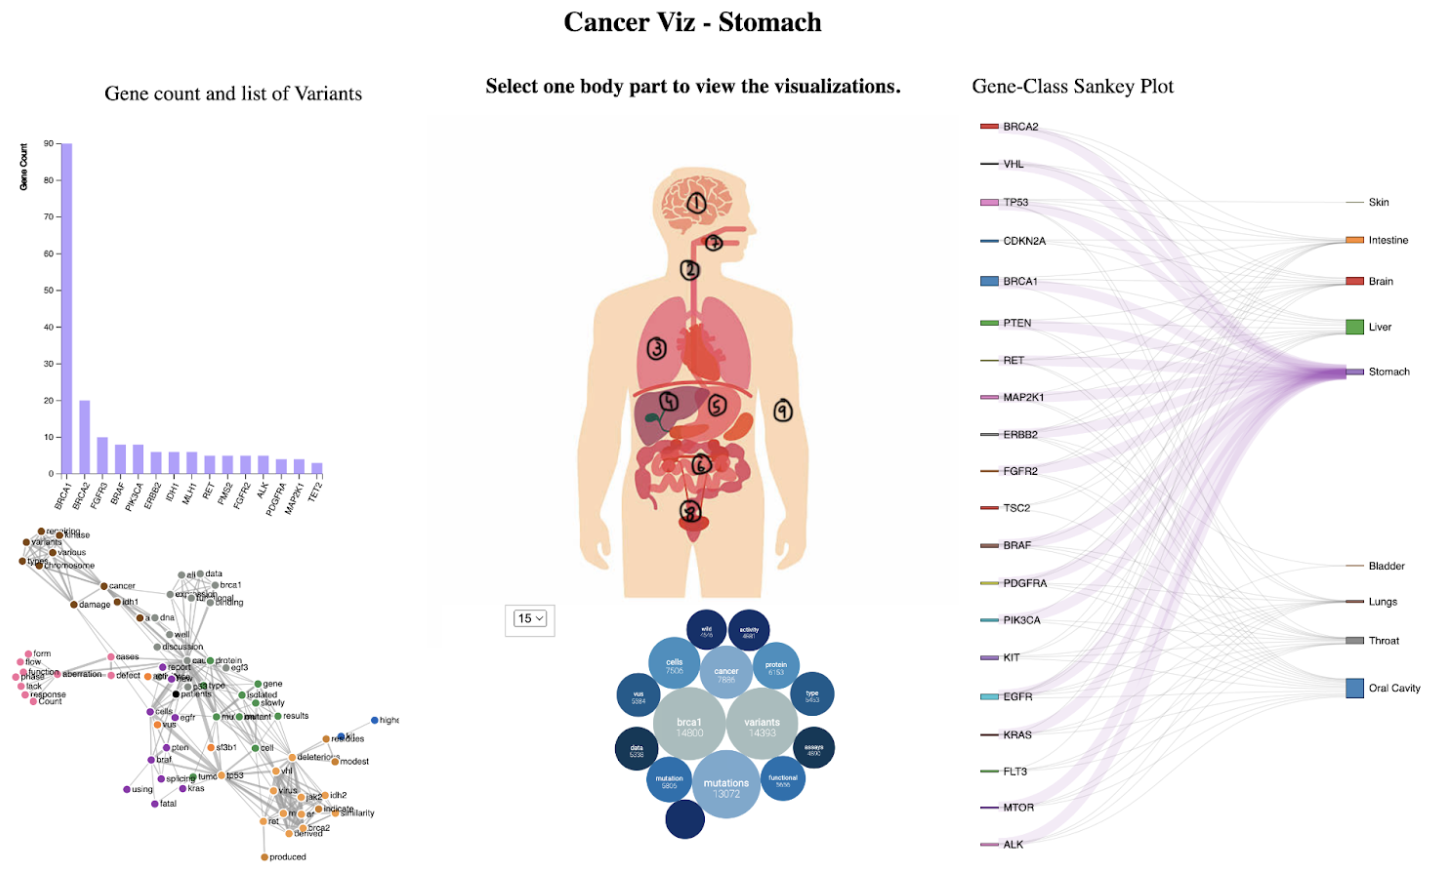
Visualization of Genetic Mutations contributing to the growth of Cancer Tumors
Group: Hemanth Pokala, Sriniketan Mysari, Pavan Kumar Yadav Dukka (CS)
The project proposes to visualize the patterns of genes, variations and clinical text which would help in determining the class of cancer.
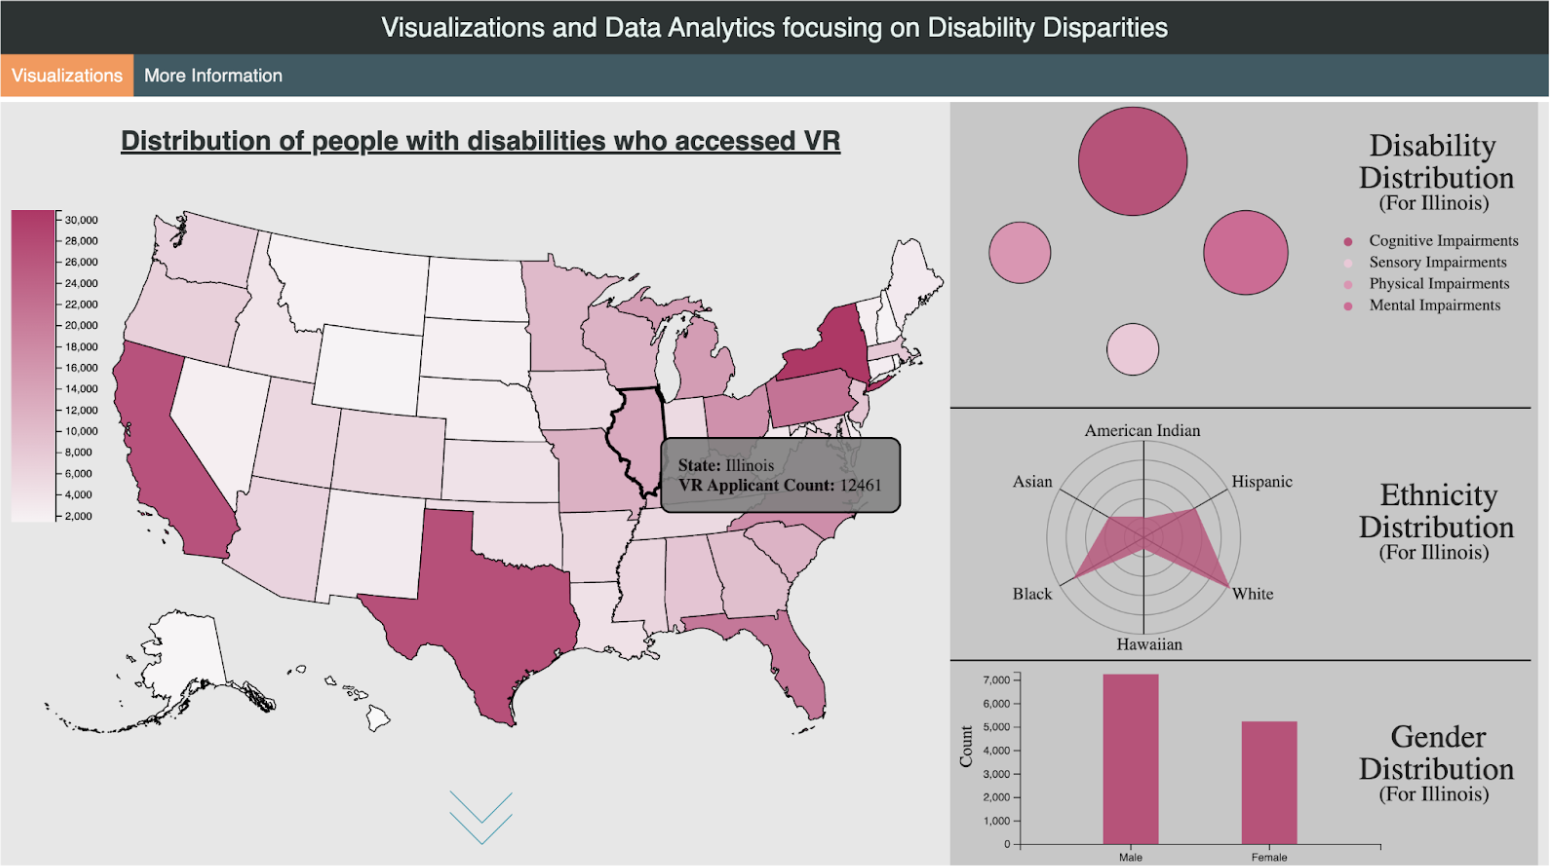
Visualizations and Data Analytics focusing on Disability Disparities
Group: Saksham Ayush, Deepanshu Raghuvanshi (CS)
This project aims to help researchers working with disparity data in better helping people with disabilities to become more independent.
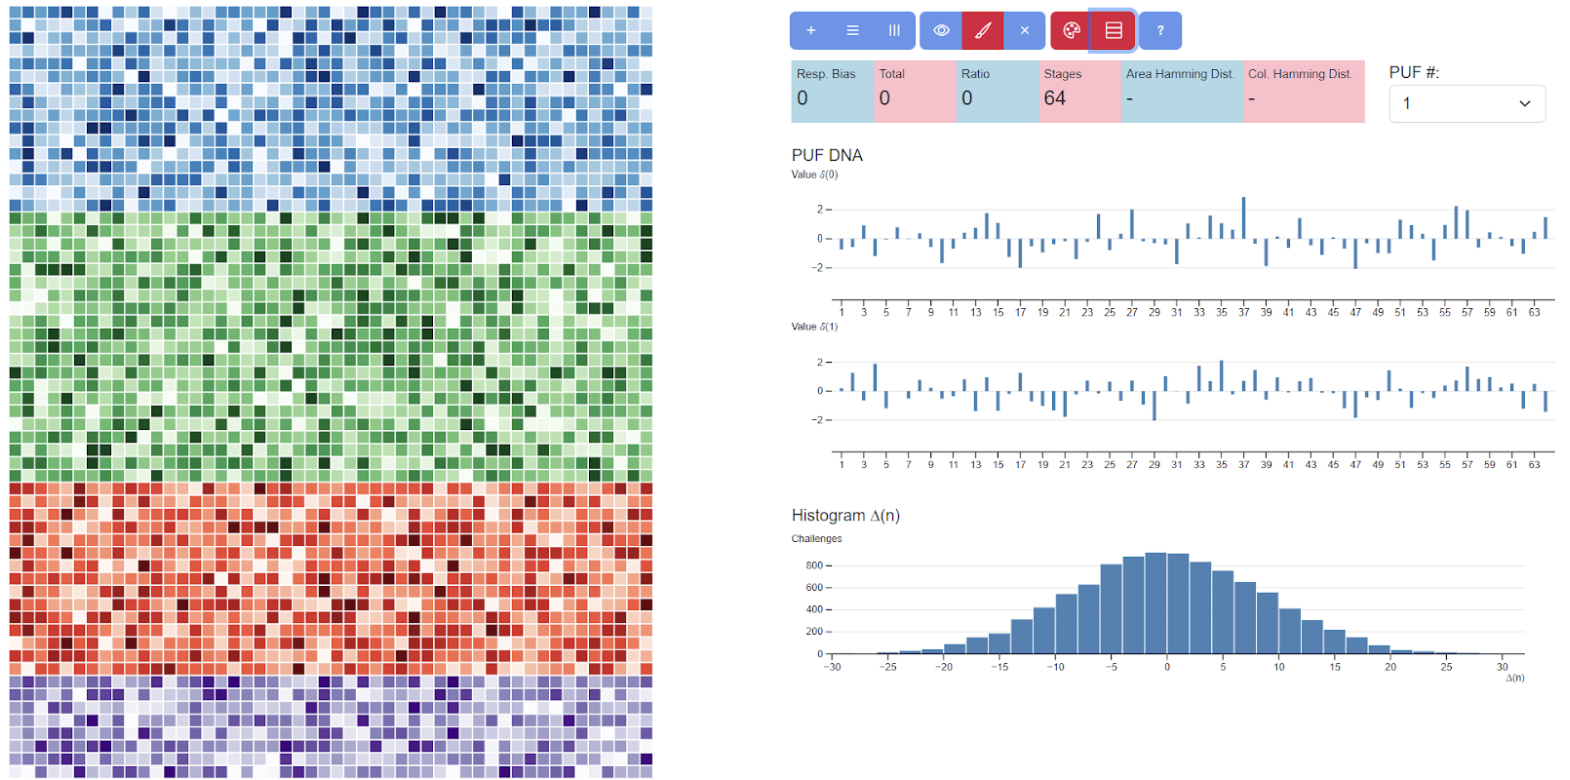
Visualizing and Interacting with Physically Unclonable Function Experiment Data
Group: Karthik Singh, Jason Pereira, Reetika Patel (CS)
This project proposes a tool to visualize and analyze experiment data of physically unclonable functions. This tool can help its users gain new insight and catch patterns that haven’t been seen before from the data.
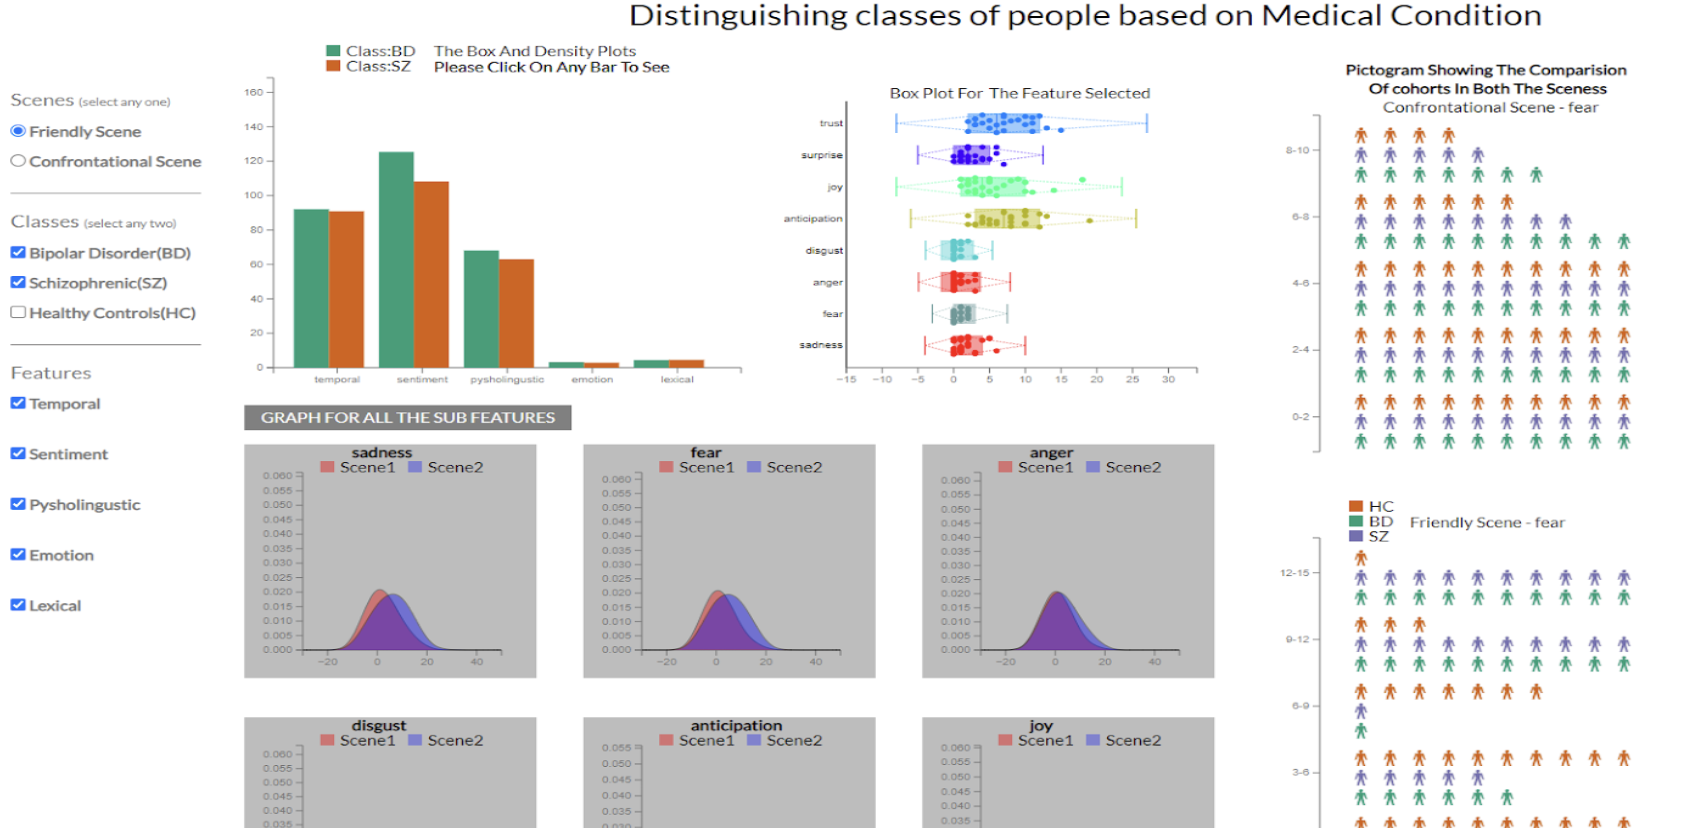
Visualizing to show the best feature to distinguish classes of people based on medical condition
Group: Leelaprasad Karuturi, Sai Deepika Yarlagadda, Madhumitha Rajarajan (CS)
This visualization system shows features of people with different medical conditions, namely, Bipolar Disorder (BD), Schizophrenic (SZ), Healthy Controls (HC).
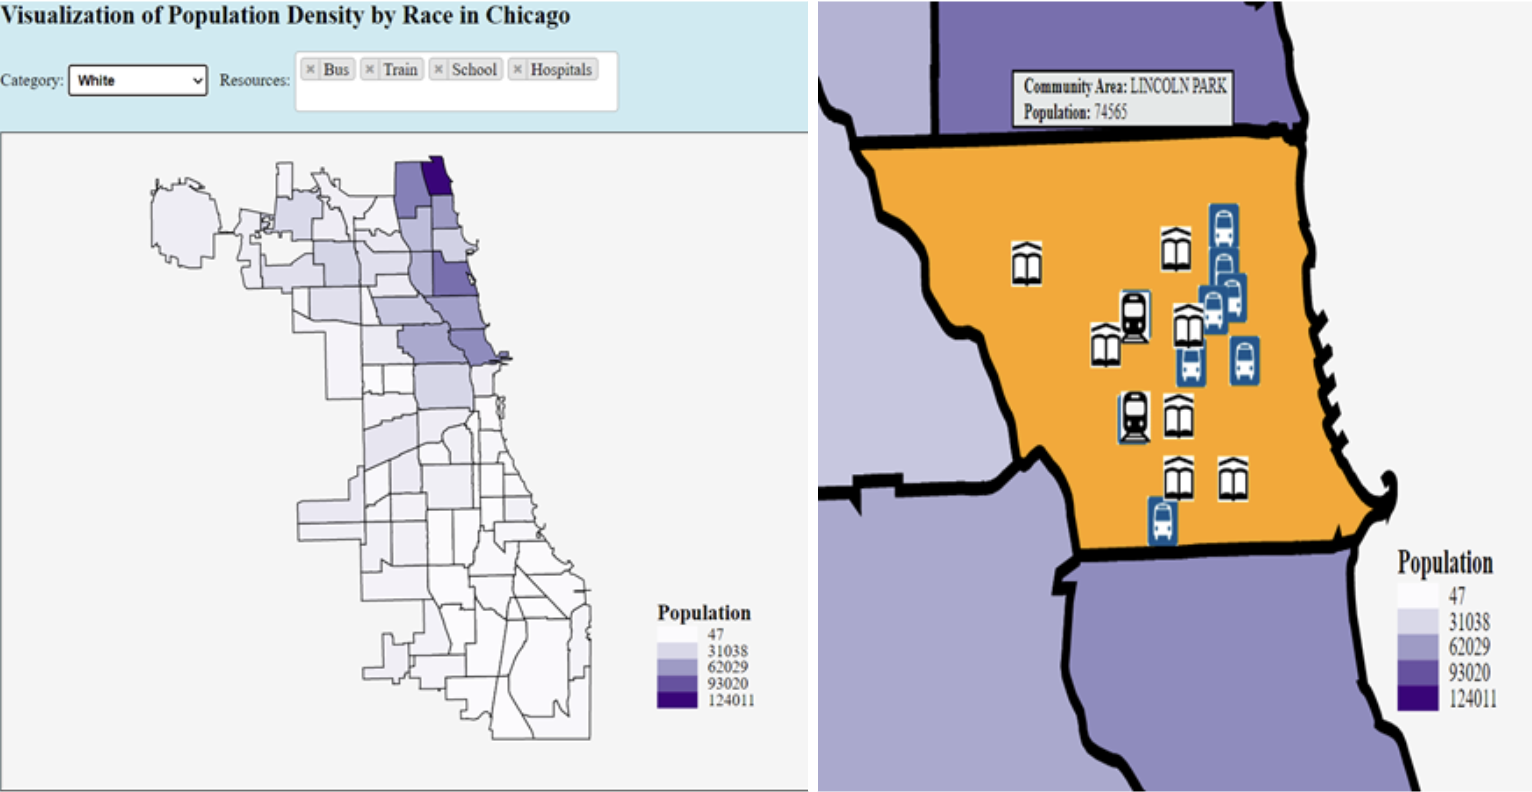
Identifying Unfair Resource Allocation Among Races Using Visualization
Group: Swetha Jayakumar, Aditya Nair, Sharan Gottuparthi (CS)
The goal of the project is to determine if there is any racial bias in the allocation of public resources in Chicago.
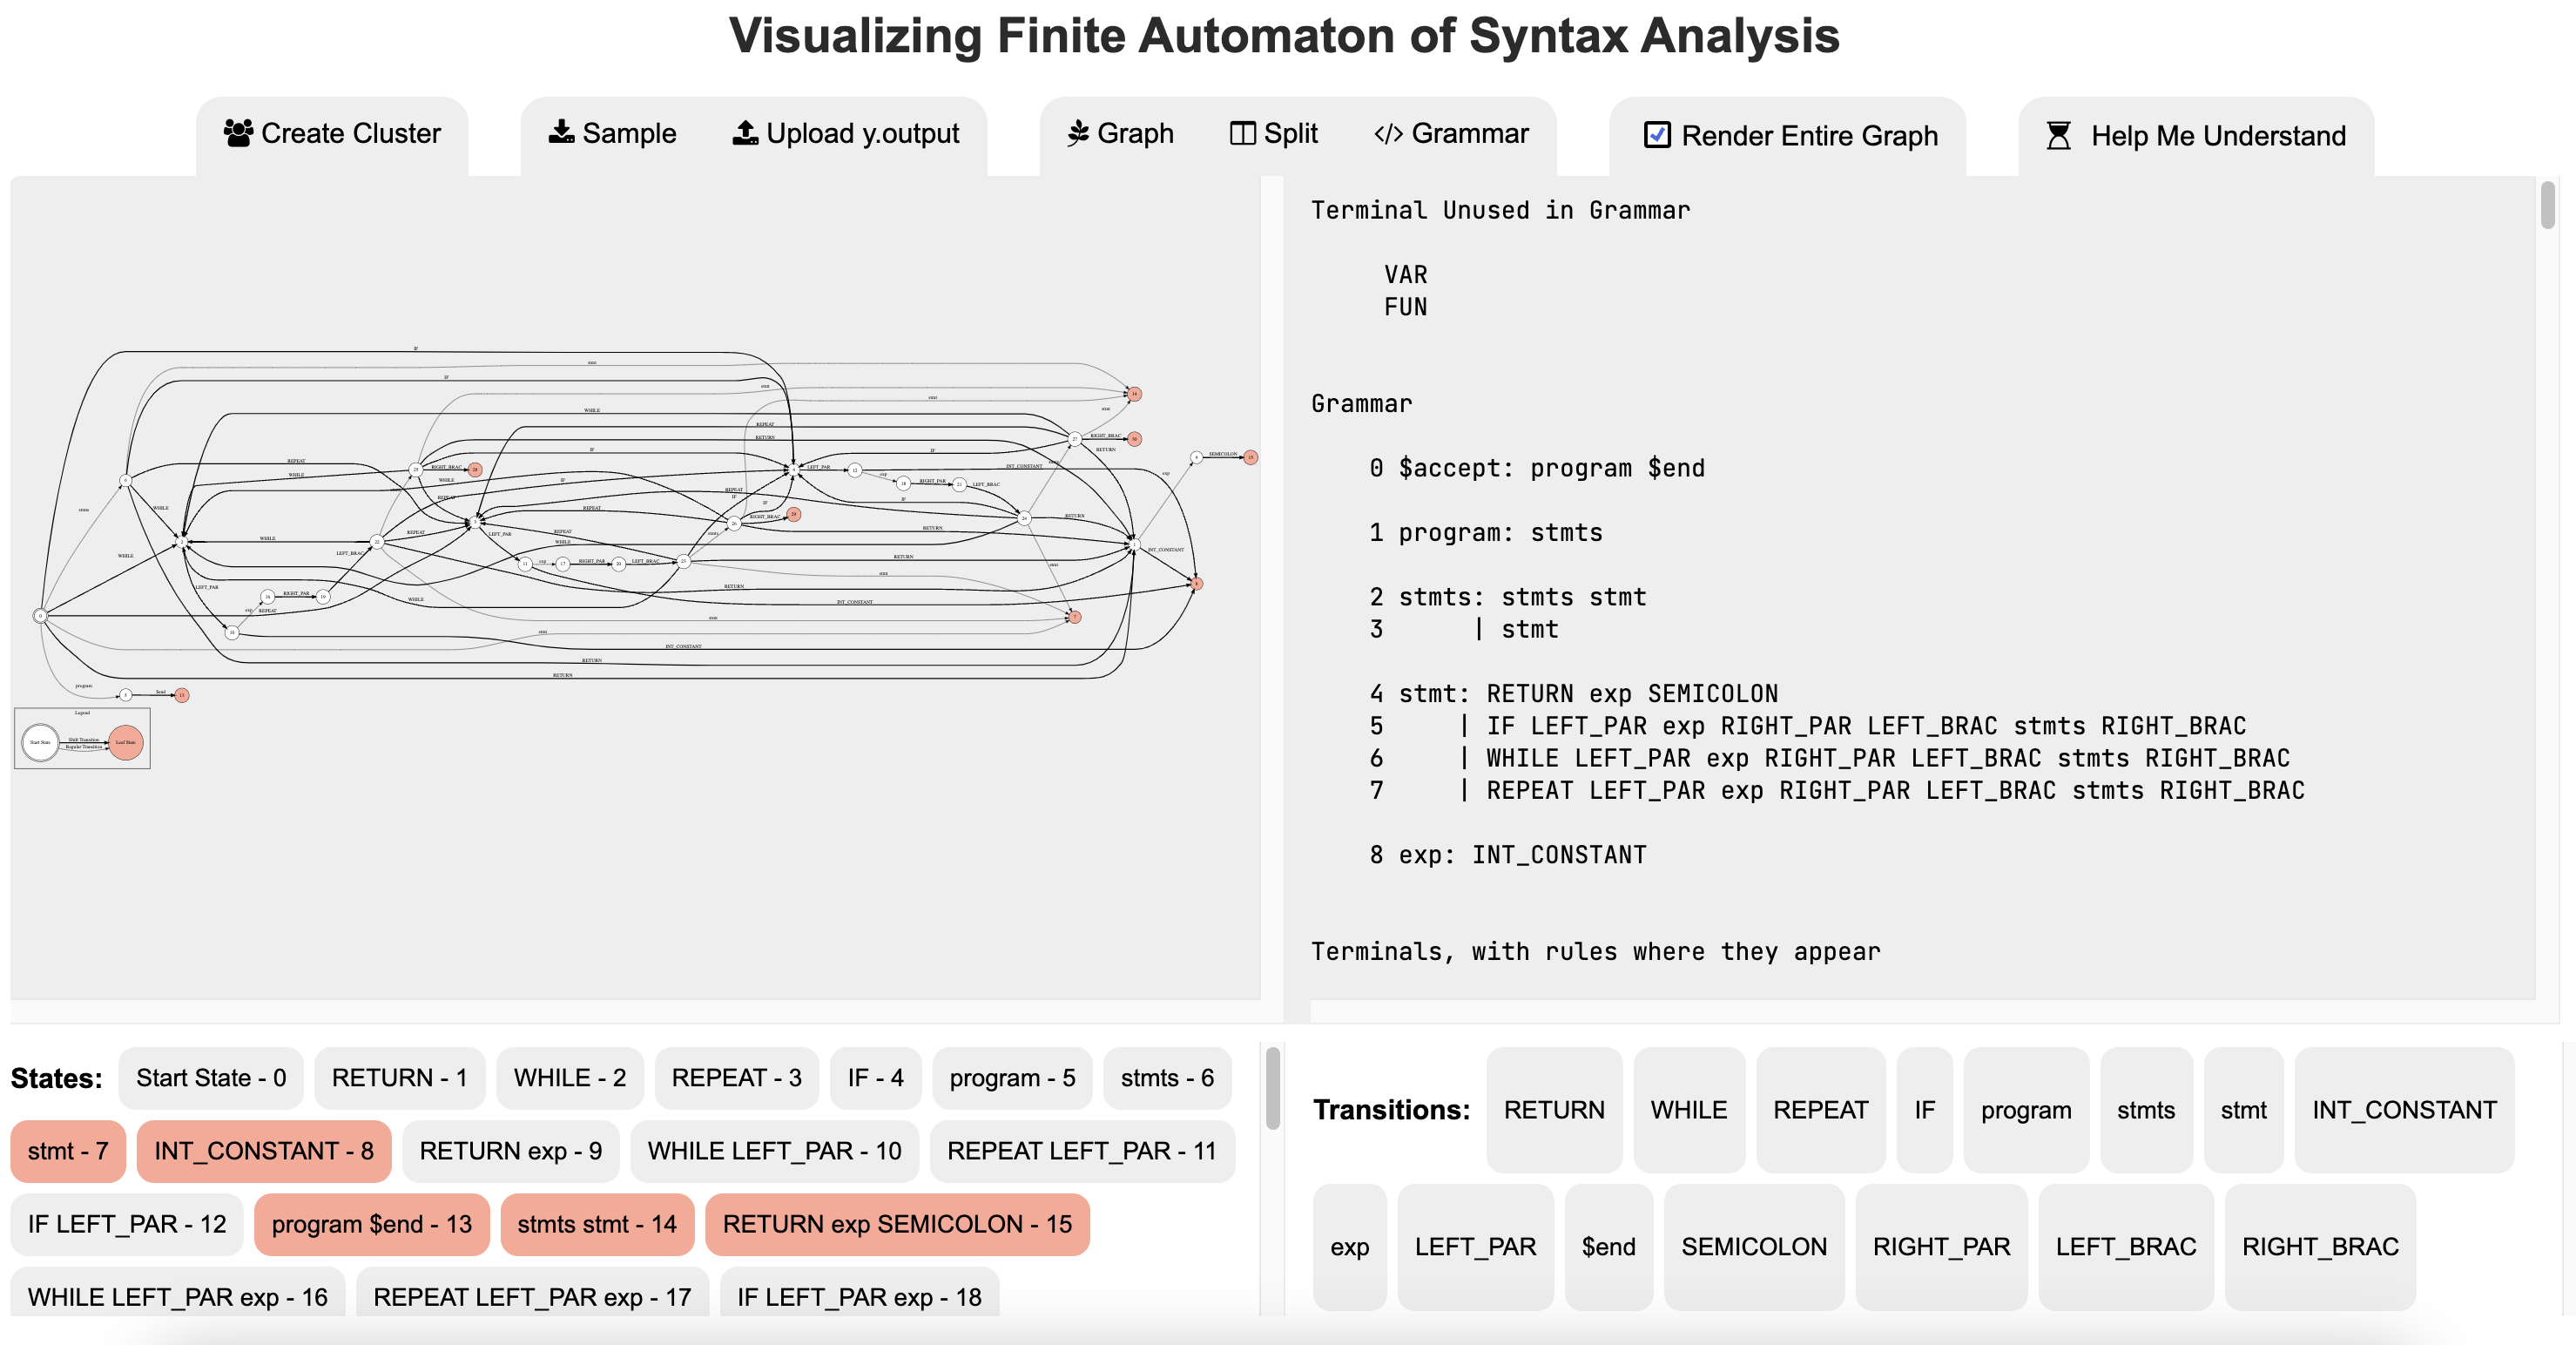
Visualizing Finite Automata of Syntax Analysis From a Compiler
Group: Nikith Rachakonda, Sravan Pattabhi, Akash Magnadia (CS)
Project Idea: Creating finite automaton from the output of a syntax analyzer in a compiler.
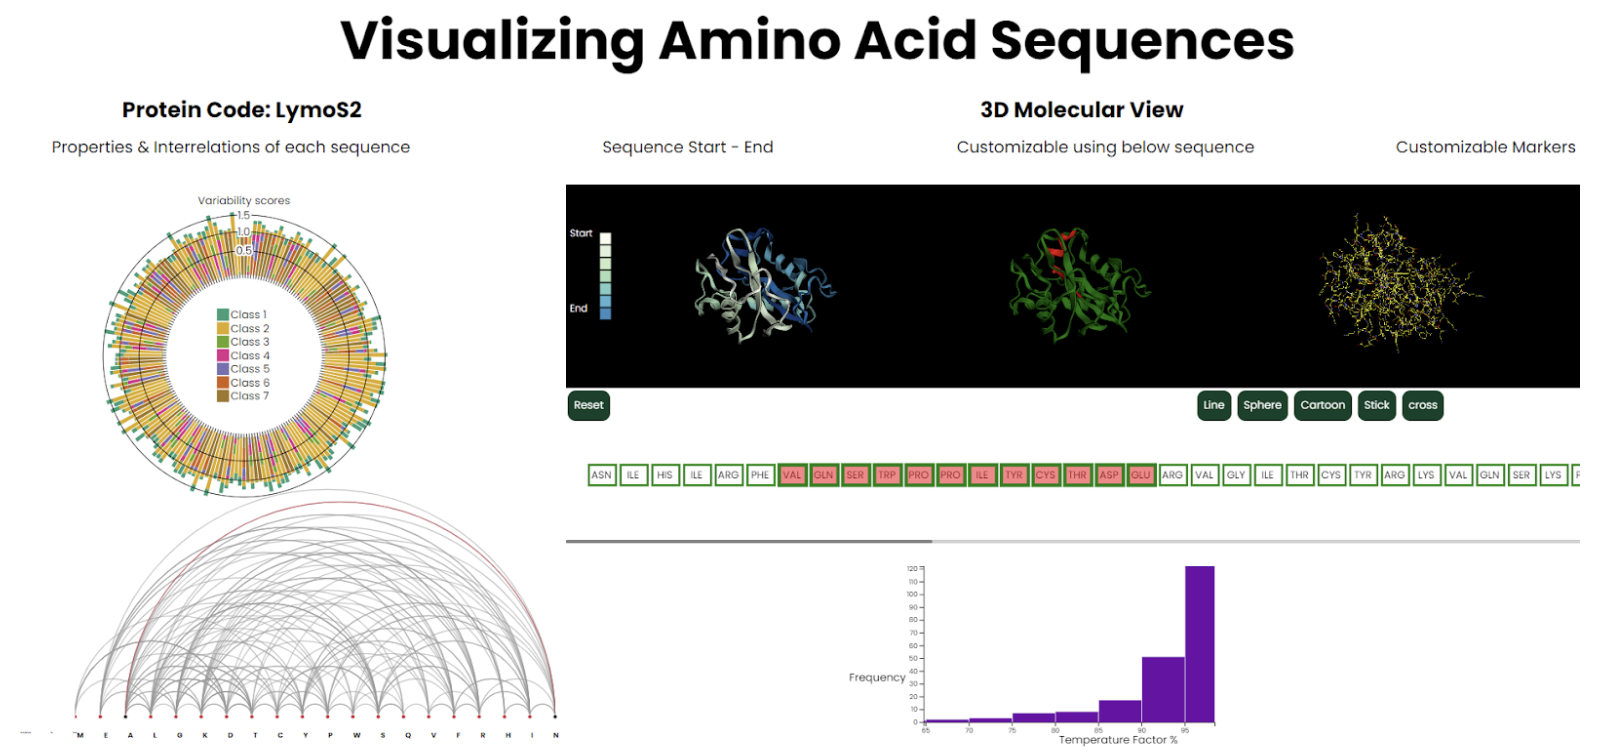
Visualization of Amino Acid Protein Structure
Group: Venkata Laxmi Mounika Batchu, Junaid Mohammad Shaik, Harsh Mishra (CS)
This project proposes an illustration of the novelties of amino acids. This project aims to develop a tool that enables users to investigate the regions of amino acids where variability is quite high.
Final Projects Fall 2020
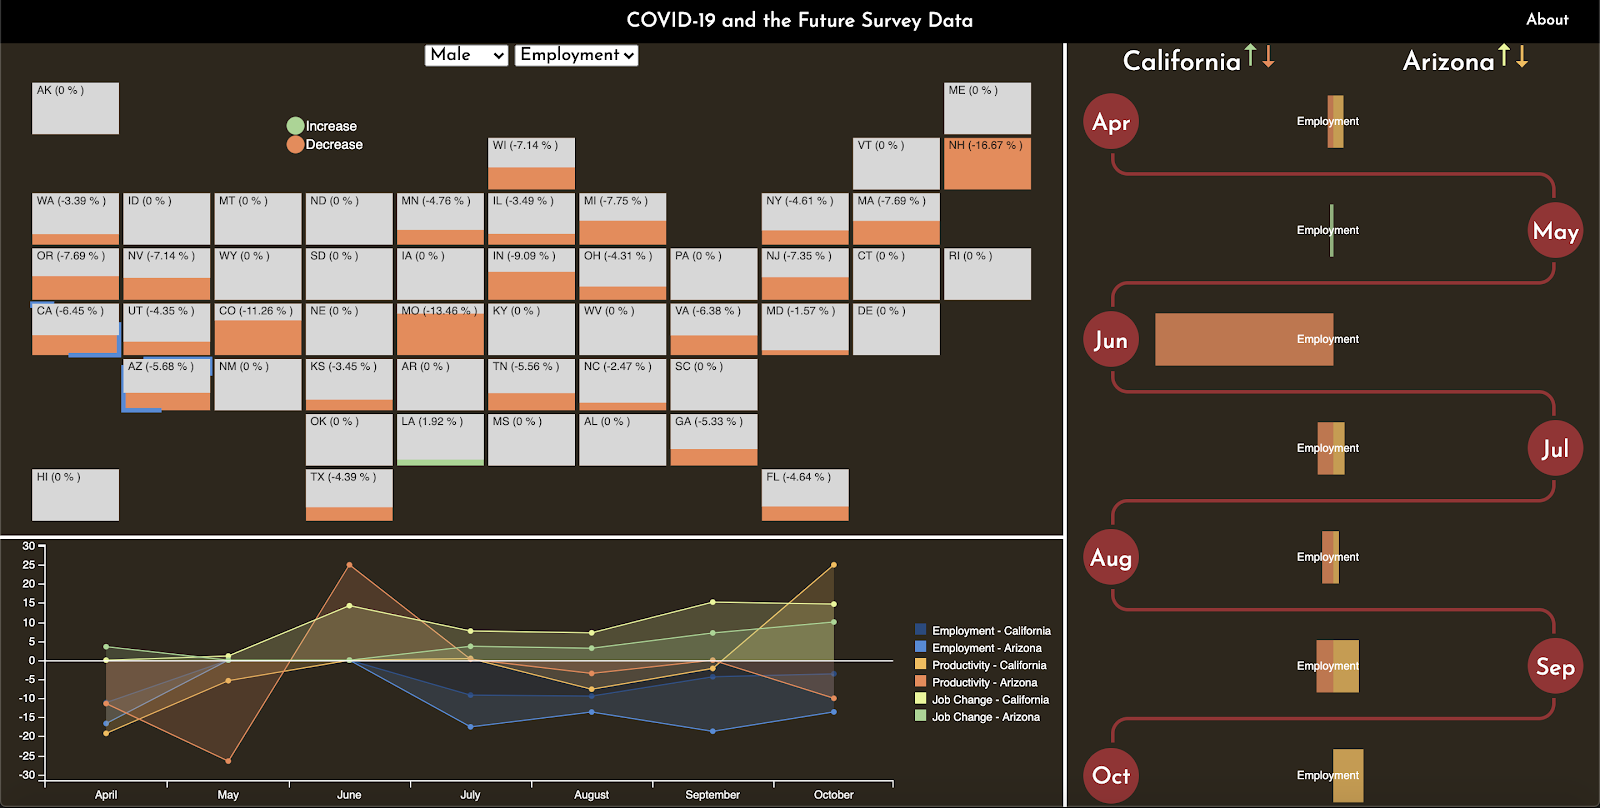
COVID-19 and The Future
Group: Sachin Manimekalai Balakrishnan, Aastha Saraf, Akshay Narula (CS)
This is a project designed to create a visualization using geographical interactive designs. This will provide the features like filtering and selection. The project spans over various ways by which the people of America will be affected post COVID.
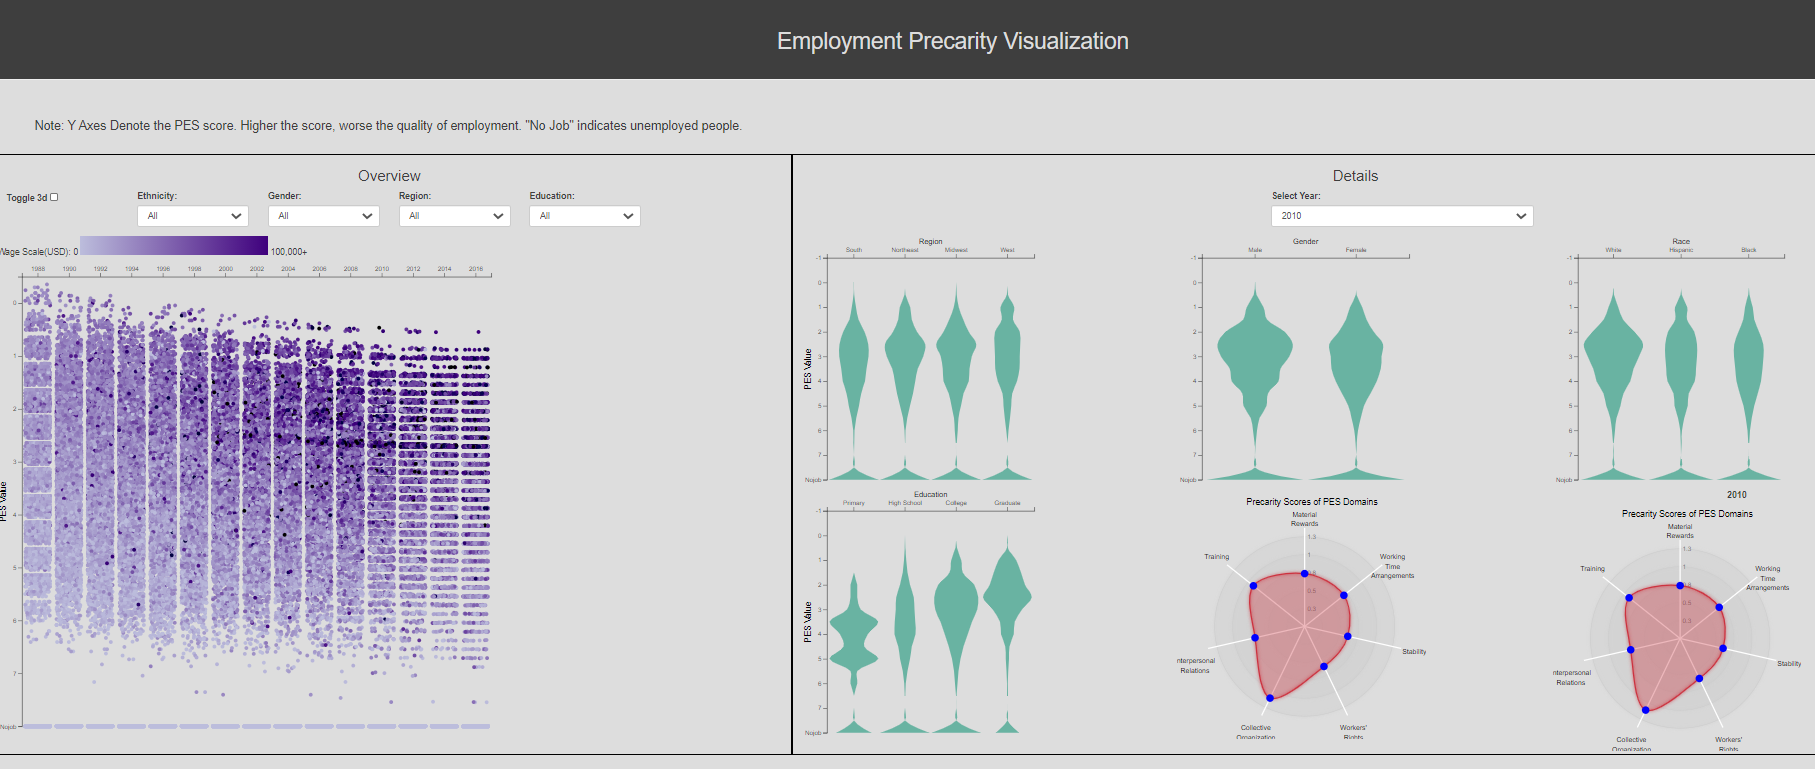
Exploring the Precariousness of Employment in the United States between 1988-2016 through visualization
Group: Pardis Ranjbar-Noiey, Mina Valizadeh, Parikshit Solunke (CS)
Visualizing the Degradation in the quality of employment in the United States over the past 3 decades.
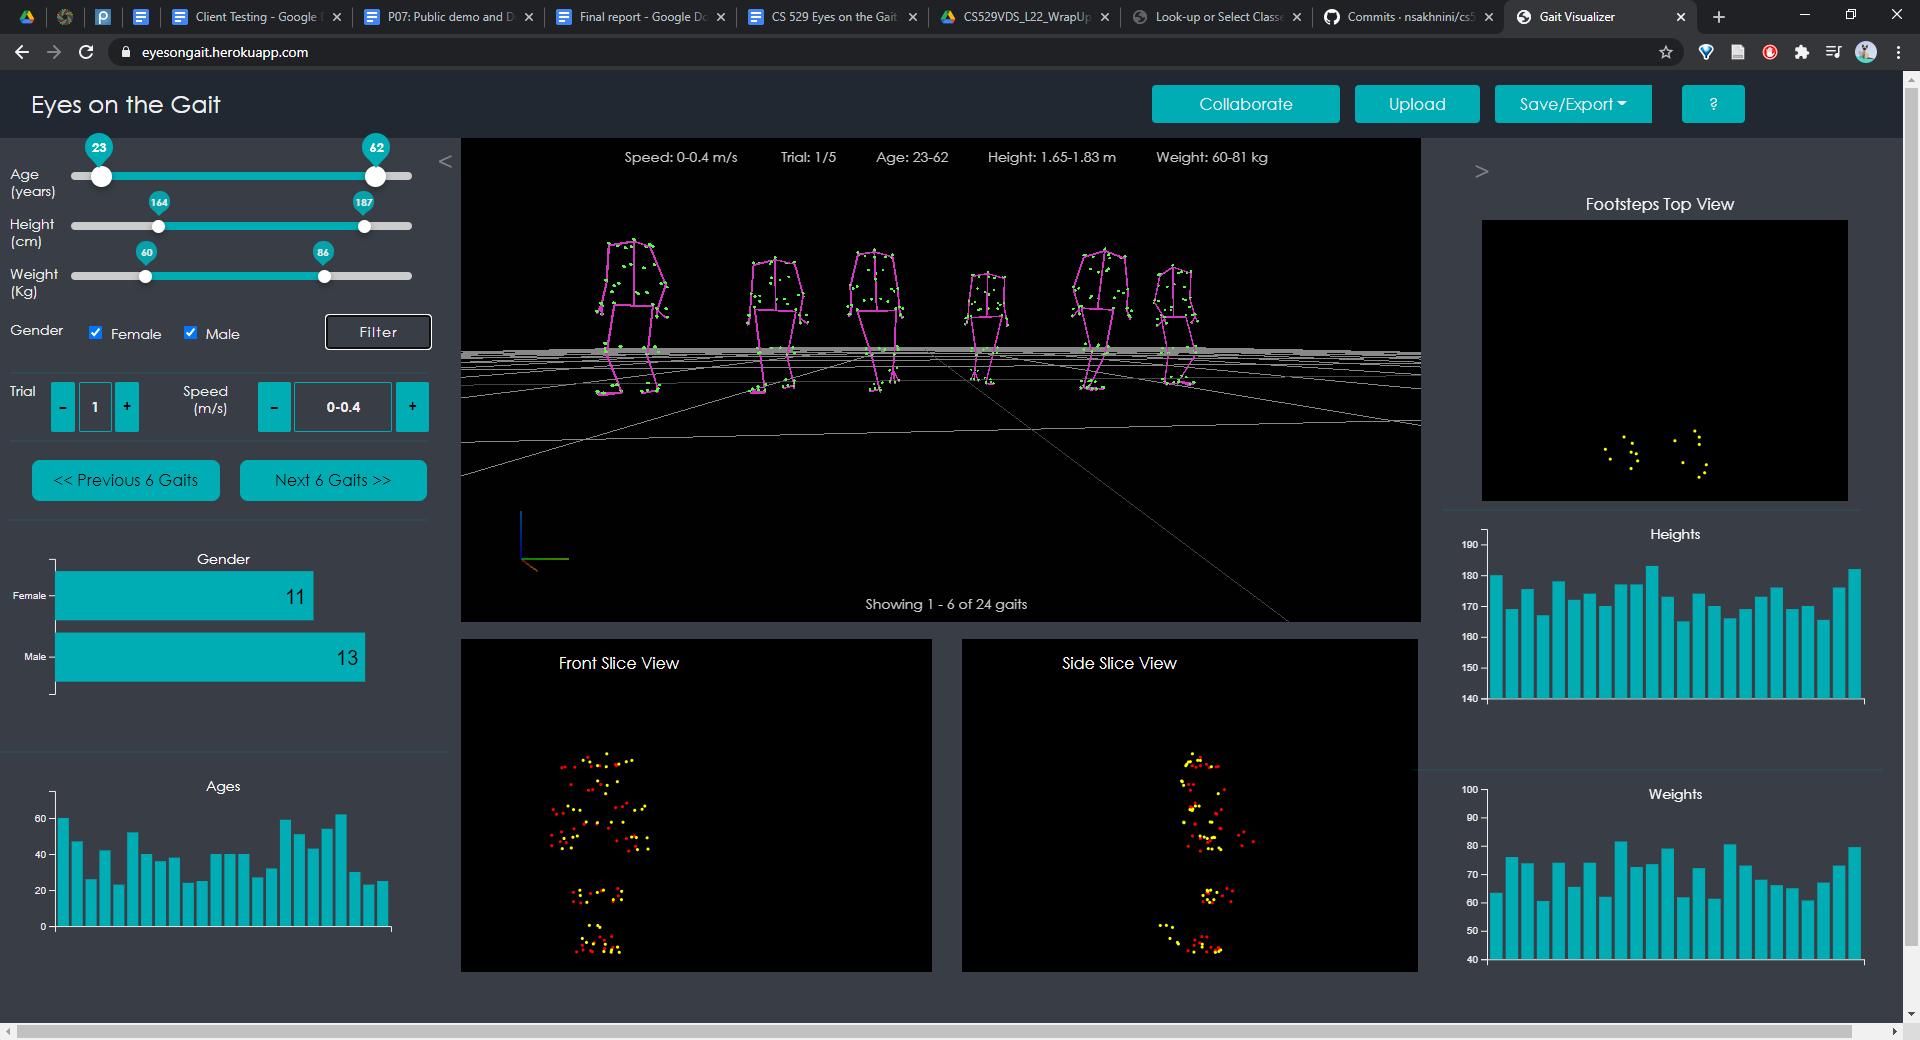
Eyes on the Gait A Visualization Tool to Delve into Gaits
Group: Nina Sakhnini, Gino Ureta, Marius Horga (CS)
Building a gait visualization tool to explore the data and conceptualize research. The tool will give the users the freedom to explore gait data, observe patterns and analyze the effects of different variables on gait.
Identifying the Right Episode of Care using Visualization
Group: Akarsh Balasubramanyam, Suhan Surendra Nath,Sneha Mysore Suresh (CS)
Analyze the correct Episode of Care for a given condition by visualizing the sequence of events involved in an episode.
Lung damage analysis through visualization
Group: Andrew Burks, Alex Politowicz (CS), Yushen Dong (MSCS)
This project is to create a system viewing time-dependent lung damage images from mice and the corresponding analysis for single time point and over time simultaneously.
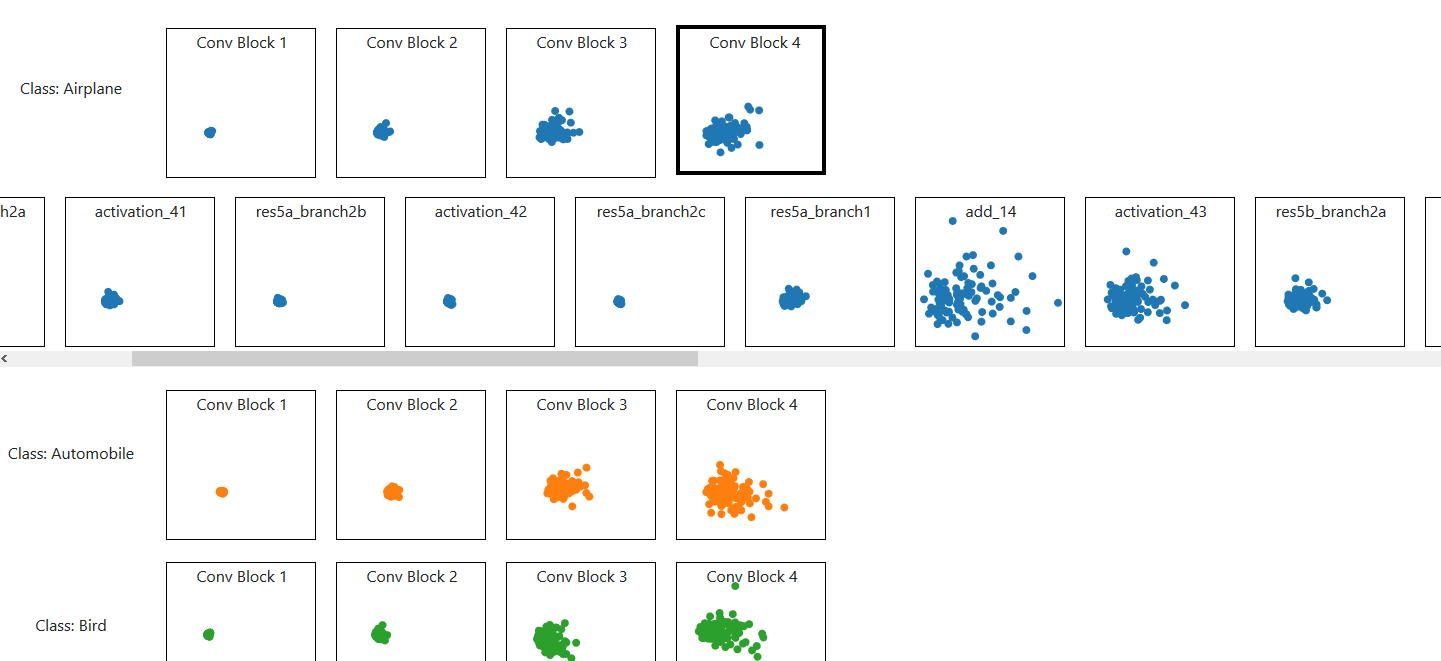
Visualization of Hidden Layers in Flow Based Neural Networks
Group: Alex Viznytsya, Benito Alvares, Charlie Wang (CS)
This project was developed to visualize data flow through hidden layers of flow based neural network. The purpose of this visualization tool is to provide insides how a trained model classifies images by showing data flow as vectors in the 2D or 3D space.
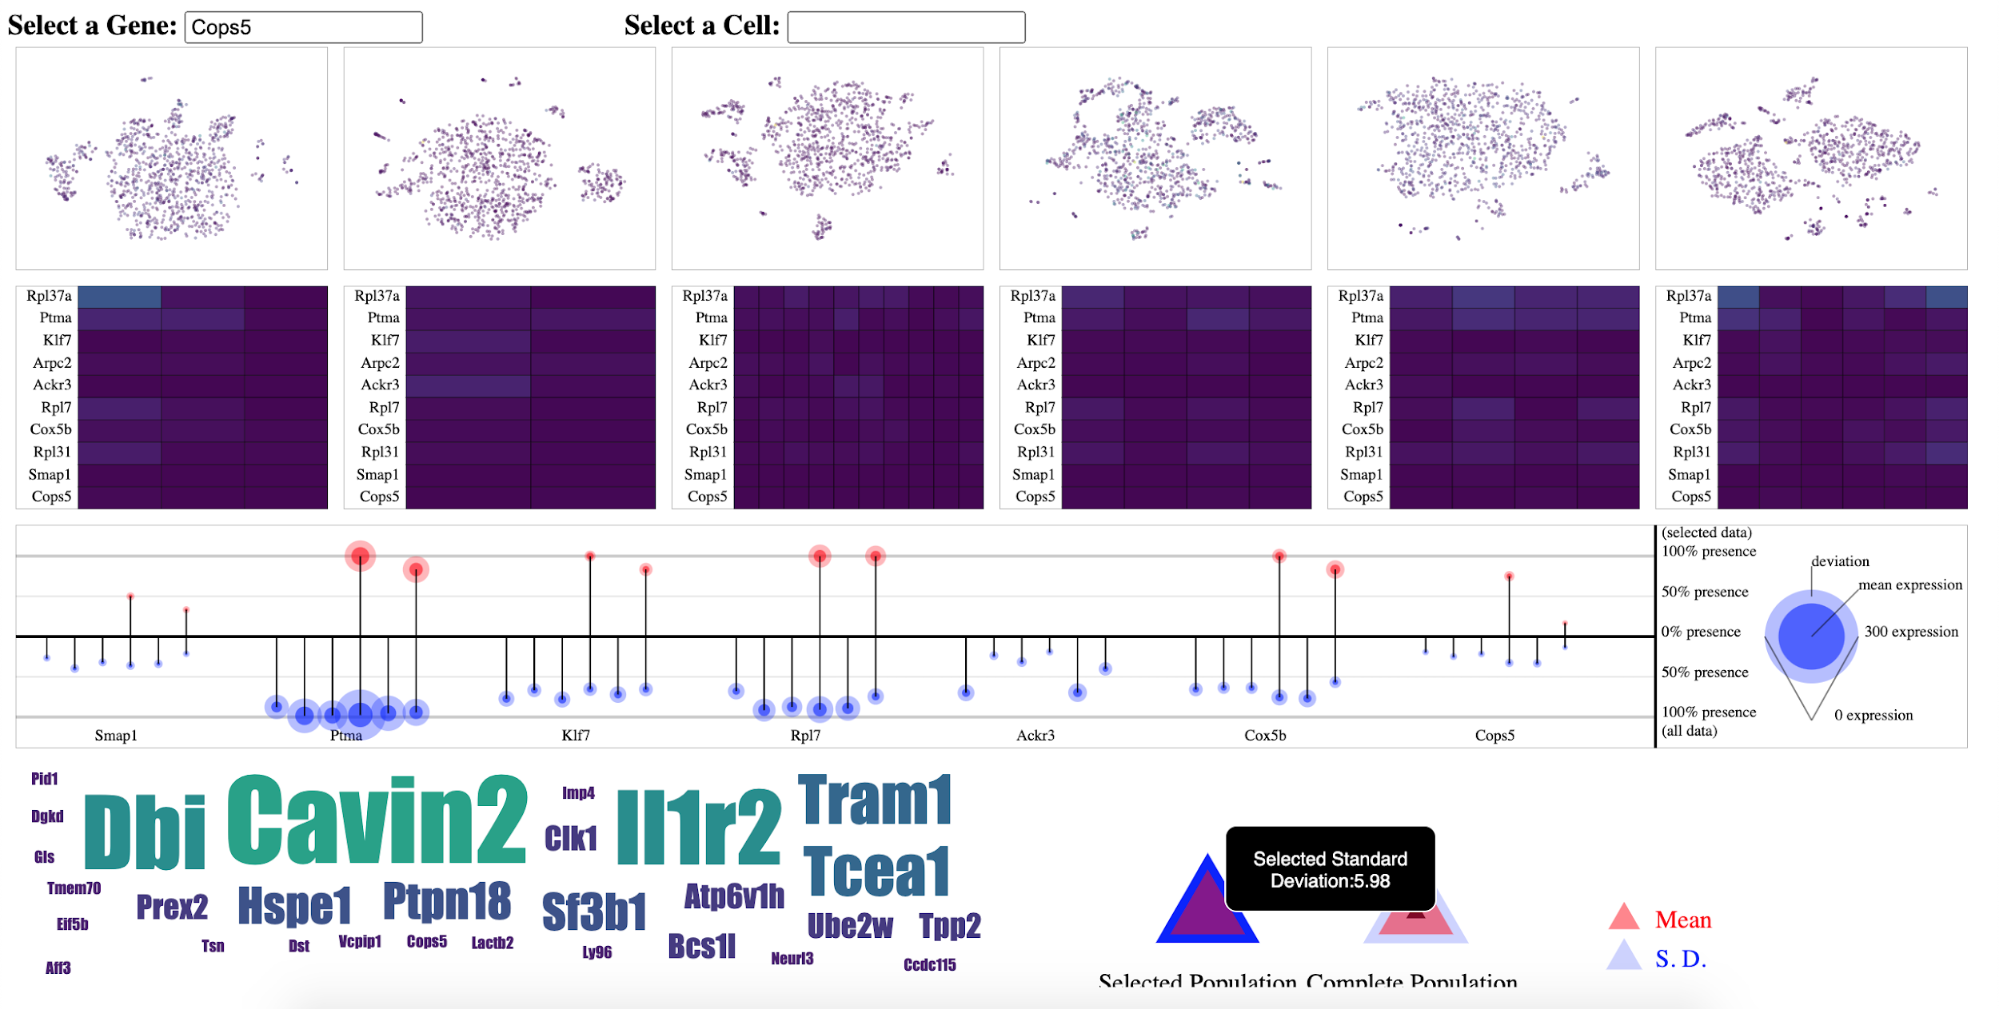
Visualizing single cell RNA- Sequencing data over time
Group: Irshad Badarpura, Abdul Wahhab, Christian Rivera (CS)
This project was developed to create a visualization tool that can be used for visualizing single-cell RNA Sequencing data over time and allow the users to compare how a particular gene changed between multiple timepoints for a specific cell of interest.
Final Projects Fall 2019
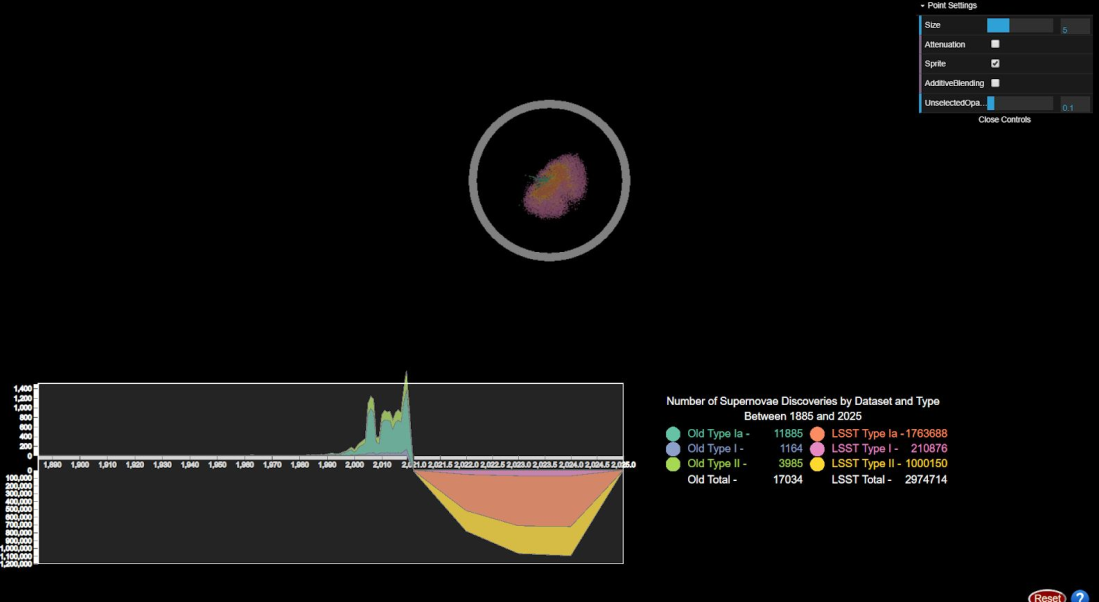
Visualizing Large Synoptic Survey Telescope Supernovae Data
Group: Ryan Nishimoto, Pavana Doddi, Anjali Yadla (CS)
Visualize existing supernovae (SNe) data alongside projected Large Synoptic Survey Telescope (LSST) data.
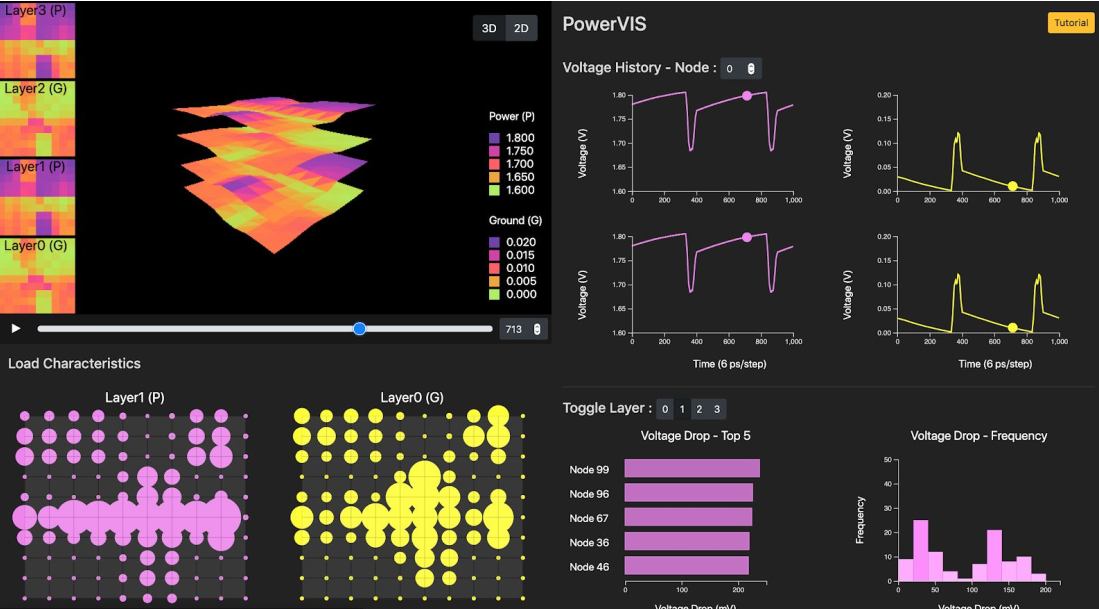
PowerVIS: A Novel Way of Seeing On-Chip Power Delivery Networks
Group: Farid Kenarangi (ECE), Saisuma Dodda, Luis Arredondo (CS)
Visualize on-chip power delivery networks to detect early stage design violations.
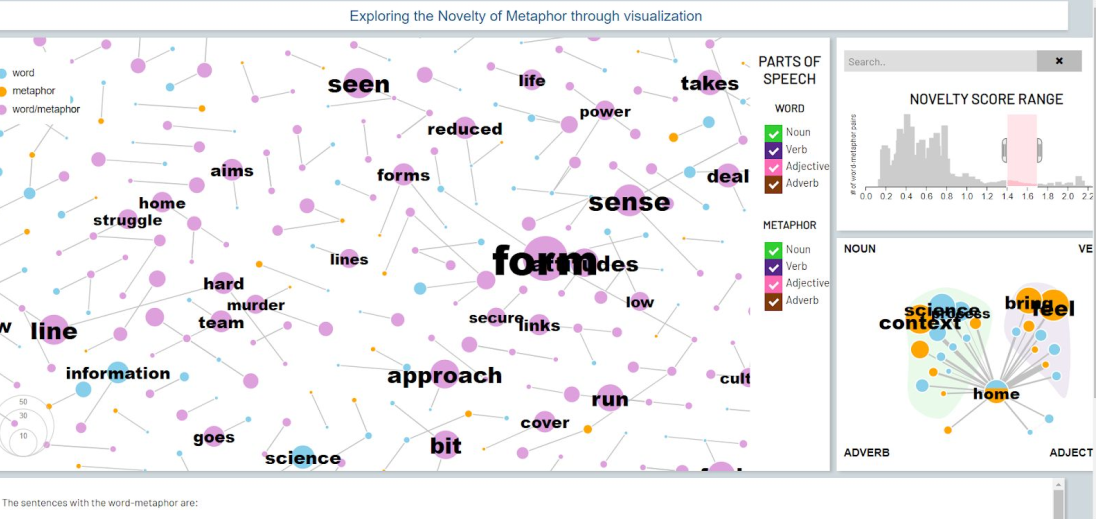
Exploring the Novelty of Metaphors through Visualization
Group: Ja Eun Yu, Sudha Anusha Sagi, Deblina Roy (CS)
Tool that helps users to explore the network of metaphor words through
visualization and gives users insights into the patterns and commonalities of word-to-metaphor
relationships.
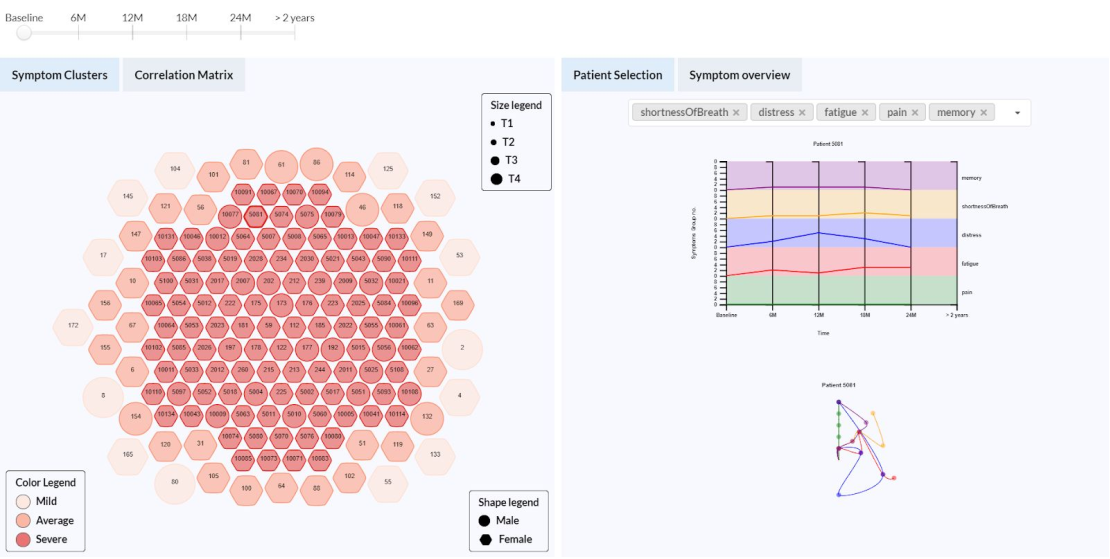
Visualizing Symptom Clusters for Head and Neck Cancer Patients
Group: Carla Floricel, Naveen Kumar Sangi, Nitya Mula (CS)
This project aims to help researchers and clinicians to visualize in the most efficient way over
100 patients’ background and symptom information in order to detect and characterize clusters
which is an important step in discovering more about cancer treatment and improving patients’
quality of life.
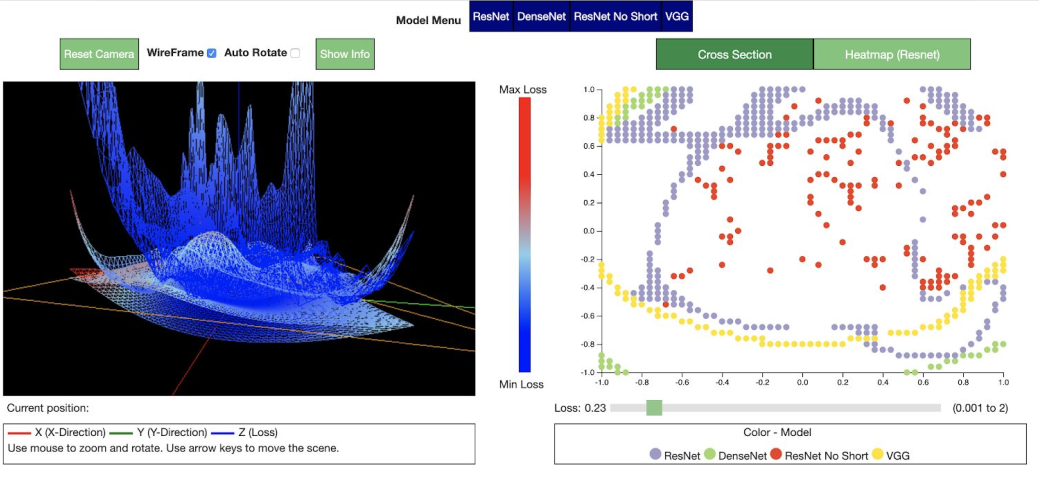
Visualization of Loss Landscapes in Neural Nets to Identify Minima of Loss Functions
Group: Varunya Yanamadala, Ramana Rao Akula, Sai Aakarsh Reddy (CS)
The idea of the project is to understand the geometry of the loss function landscape in terms of
sharpness or flatness and to estimate on the loss function values.
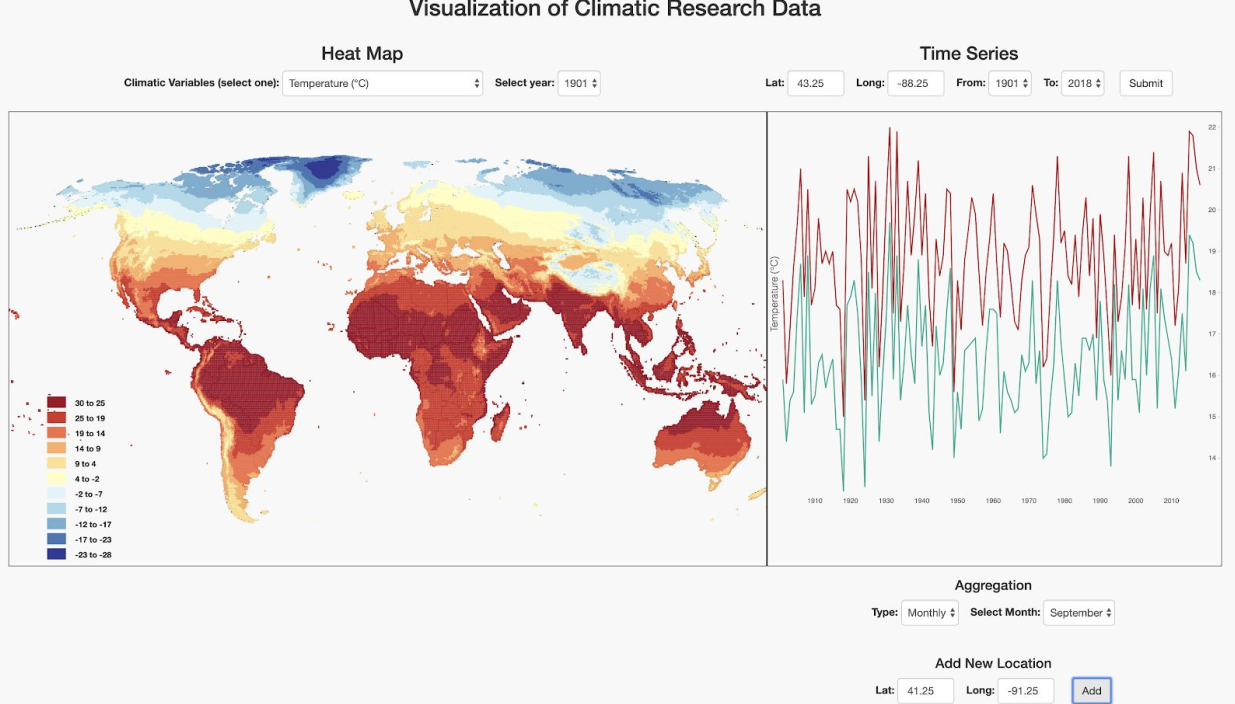
Visualizing the Climatic Research Unit Data to Improve Forecasts of Glacier Evolution and Climate Change
Group: Ruby Salazar, Praveen Chandrasekaran, Sai Krishnan Thiruvarpu(CS)
The aim of the project is to create a visualization system that will help users visualize how
different climate factors and relationships affect the physical mechanisms of glaciers.
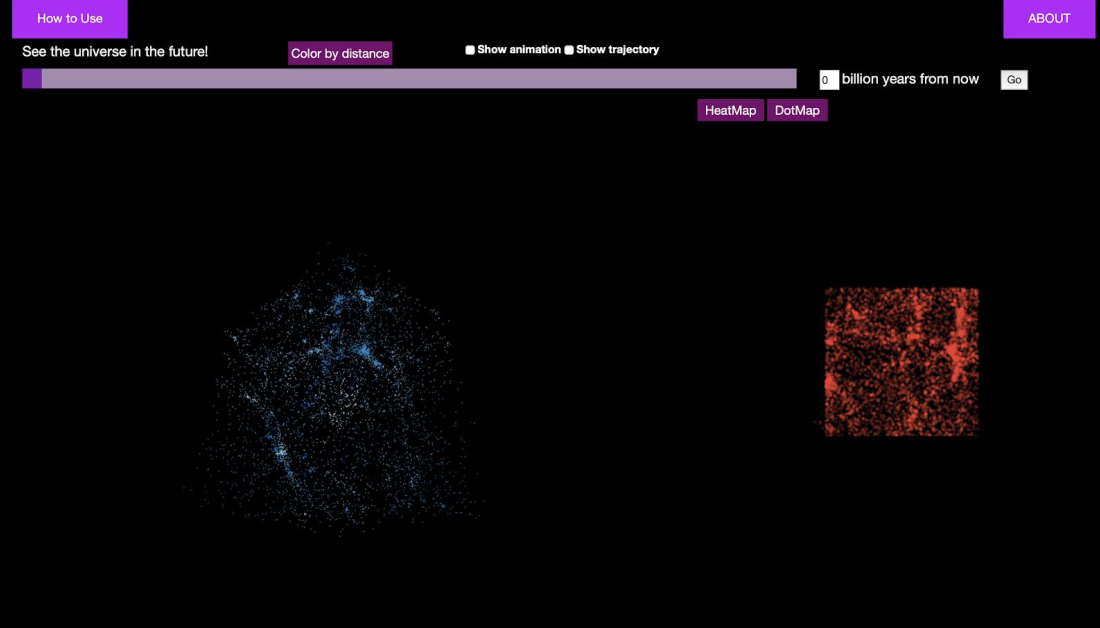
Visualization of the Universe
Group: Shiyong Li, Peihong Man (Physics), Lanxin Zhang (CS)
Visualization of the formation of the universe thorugh dark matter simulation.
Identifying Similarities and Dissimilarities between UIC/MDACC RT Plan Data
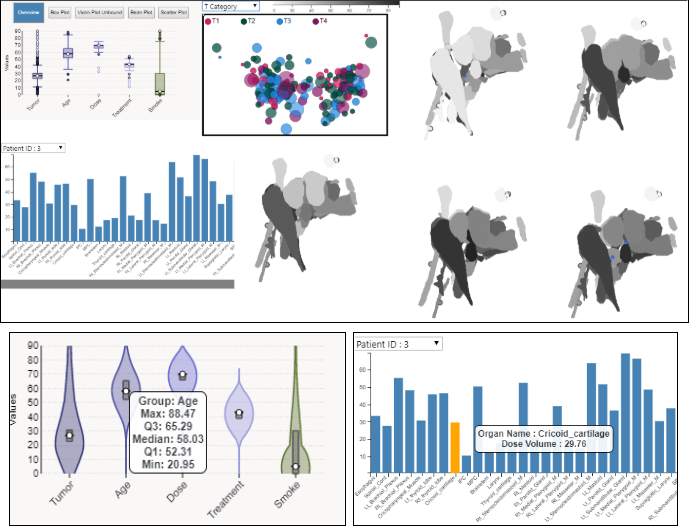
Group: Md Nafiul Alam Nipu, Sanjana Srabanti, Samujjwaal Dey (CS)
Radiation therapy is a primary modality to treat head and neck, cancer patients. In this paper, we propose a novel approach to correlate similarities and differences between cancer patients. The system will use head and neck cancer patients’ data from UIC and MDACC and visualize the similarities and dissimilarities in terms of dose prescription, dose distribution, tumor size, presence of lymph node, etc. The system will introduce an efficient way for the users to analyze the data to reach and understand a decision in an easy and proficient manner.