3/29
|
| Kahler |
link
talk
|
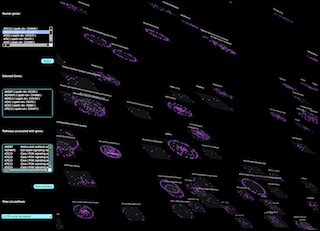
Runtime
Visualization
of
the
Human
Arterial
Tree
- Insley et al, IEEE
TRANSACTIONS ON VISUALIZATION AND COMPUTER GRAPHICS,
VOL. 13, NO. 4, JULY/AUGUST 2007
|
|
3/31
|
Nishimoto
|
link
|
Interactive
Visualization
of
Hyperspectral
Images
of
Historical
Documents
-
Kim
et
al,
IEEE
TRANSACTIONS
ON
VISUALIZATION
AND COMPUTER GRAPHICS, VOL. 16,
NO. 6, NOVEMBER/DECEMBER 2010
|
Conner
|
link
|
Visualizing
Windows
System
Traces
-
Wu
et
al,
Proceedings
of
SOFTVIS '10 Proceedings of the 5th international symposium on Software
visualization
|
|
4/05
|
Mateevitsi
|
link
|
Exploration
of
4D
MRI
Blood-Flow
Using
Stylistic
Visualization
-
van
Pelt
at
al,
IEEE
TRANSACTIONS
ON
VISUALIZATION AND COMPUTER GRAPHICS, VOL. 16, NO.
6, NOVEMBER/DECEMBER 2010
|
Grenning
|
link
|
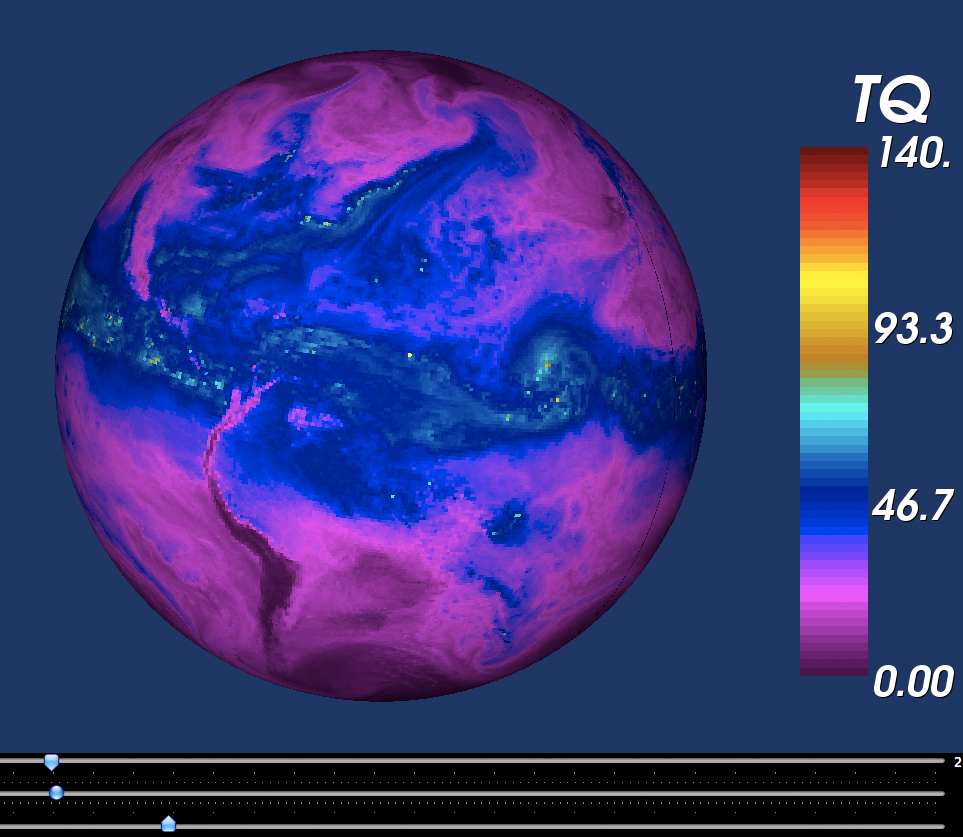
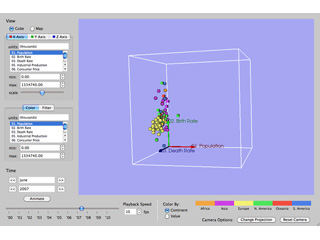
Three-Dimensional
Simulations
of
the
Deflagration
Phase
of
the
Gravitationally Confined
Detonation Model of Type Ia Supernovae - Jordan et al, The
Astrophysical Journal, 681:1448–1457, 2008 July 10
|
|
4/07
|
| Marrinan |
link
|
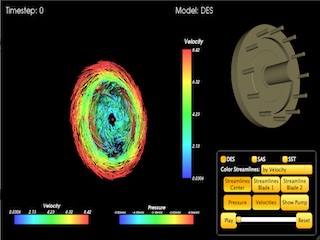
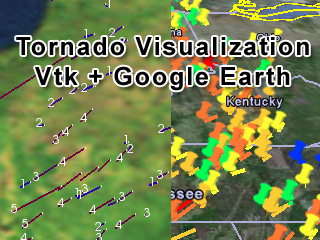
View-Dependent
Streamlines
for
3D
Vector
Fields
-
Marchesin
et
al,
IEEE
TRANSACTIONS
ON
VISUALIZATION
AND
COMPUTER
GRAPHICS, VOL. 16, NO. 6,
NOVEMBER/DECEMBER 2010
|
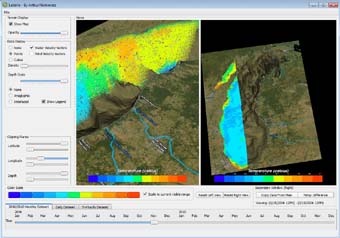
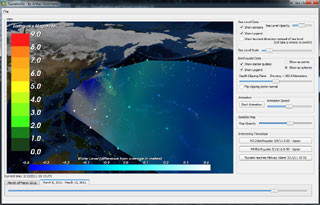
Aurisano
|
link
|
Hypothesis
Generation
in
Climate
Research
with
Interactive
Visual
Data
Exploration
-
Kehrer
et
al,
IEEE
TRANSACTIONS ON VISUALIZATION AND COMPUTER
GRAPHICS, VOL. 14, NO. 6, NOVEMBER/DECEMBER 2008
|
|