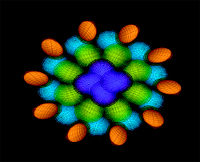
Transitive: Immersive Visualization of Real Time Network Transfers
April 30th, 2004
Categories: MFA Thesis, Networking, Software, Visualization

Authors
Lopez Silva, B.A.About
Processing data for print and other static media may employ numerous design, digital and analog steps along the way; but the final product is dated at its release. In contrast, real-time visualization of data employs an active system capable of processing and rendering data as a dynamic presentation.
Rather than displaying a single snapshot of data, real-time information visualization presents the data the moment it is queried. As it is driven by computers equipped with memory caches, there is the added ability to observe both the immediate effects of input affecting data, or to observe data behavior over a period of time.
Designing an information visualization backed by digital technology poses a unique set of challenges; but like all design processes, the goal is to make complex data simple and understandable.
Using computational data to generate computer graphic art work dates back at least three decades and has evolved into a discipline in itself - electronic visualization. The use of massive scientific datasets to generate real-time art is a newly emerging field based largely on the increasing ability to access high-bandwidth networks.
Since 1997, the Electronic Visualization Laboratory’s networking initiatives, including STAR TAP and StarLight1, have facilitated national and international R&D network interconnectivity in support of high-end application, networking, visualization and data mining user communities. Since 1998, EVL has also organized biannual international grid, or iGrid, events where these communities converge to showcase multi-gigabit-enabled applications running over experimental testbeds.
My interest in developing a real-time network information visualization came in early 2000, when STAR TAP networking engineers requested a graphics-based traffic map for iGrid 2000 to display the in / out bandwidth of multiple networks connected to a central router at the Ameritech Network Access Point (NAP) in downtown Chicago.
Resources
Citation
Lopez Silva, B.A., Transitive: Immersive Visualization of Real Time Network Transfers, EVL, MFA Thesis, April 30th, 2004.