
Interactively Exploring Geotemporal Relationships in Demographic Data via Stretch Projections
November 1st, 2014
Categories: Visualization
Authors
Murray, P., Forbes, A. G.About
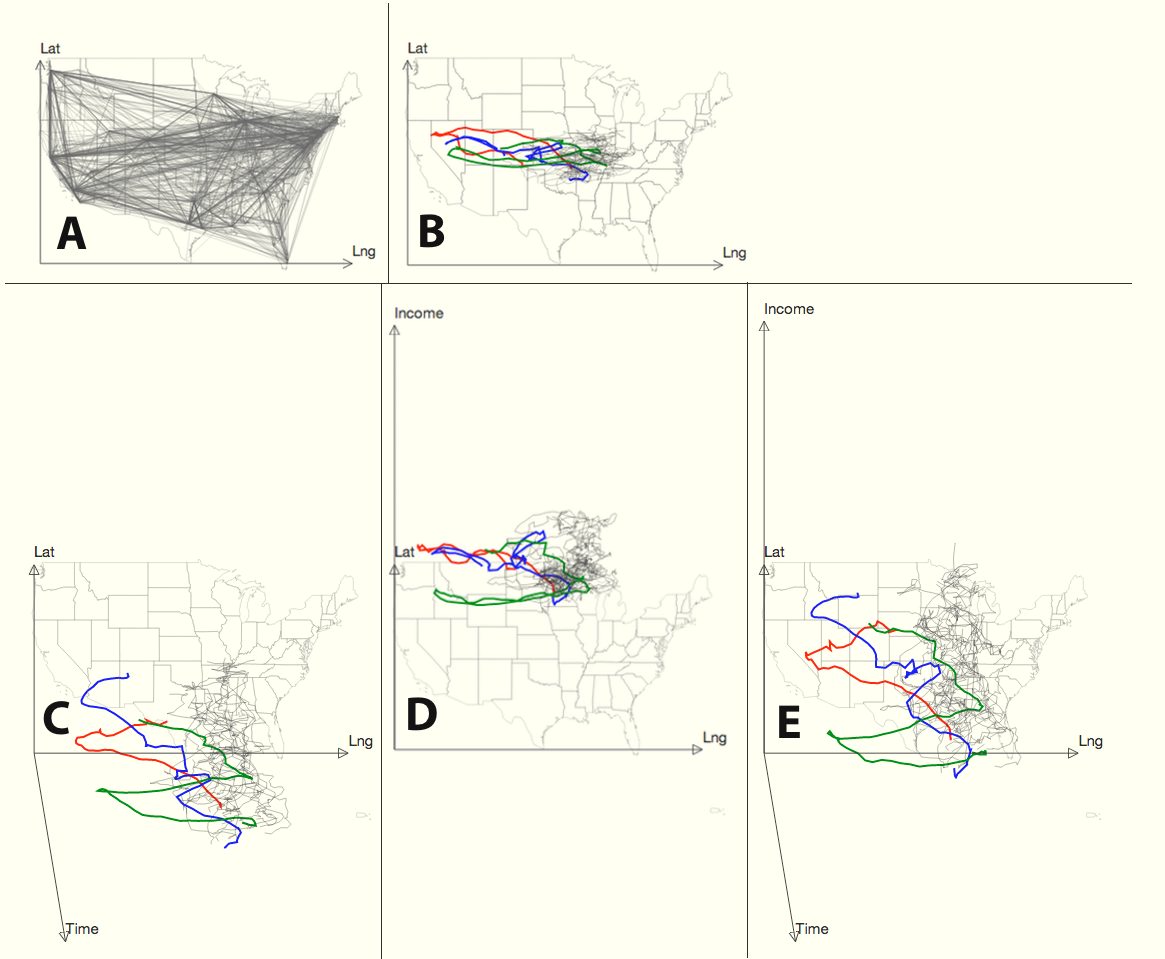
This paper investigates the interactive projection of multivariate space-time data. Specifically, it investigates how complex datasets containing elements situated in space and time that include additional variables can be interactively explored to support effective multivariate geotemporal analyses. Given that substantive analyses of space-time trajectory data will likely be concerned with additional variables beyond space and time, we propose a novel technique, stretch projections, that allows trajectory positions to be determined by an arbitrary number of variables in a multidimensional space-time dataset. We present StretchPlot, an interactive prototype that allows multidimensional space-time trajectory data to be projected into a two-dimensional space according to multiple user-defined coordinate vectors. The StretchPlot tool is demonstrated using a large multidimensional space-time dataset that combines the trajectories of touring musicians with demographic data related to the locations of their performances. Examples are shown which identify relationships between multiple dimensions of space, time, and additional demographic variables, indicating that the use of of stretch projections may be useful for the exploratory analysis of multidimensional geotemporal data.
Keywords:Space-time data, Trajectories, Culture, Sociological data, Stretch projections
Resources
Citation
Murray, P., Forbes, A. G., Interactively Exploring Geotemporal Relationships in Demographic Data via Stretch Projections, Proceedings of the 2nd ACM SIGSPATIAL Workshop on Map Interaction (MapInteract), Dallas, TX, November 1st, 2014.