
StretchPlot: Interactive Visualization of Multi-Dimensional Trajectory Data
November 11th, 2014
Categories: Visualization
Authors
Murray, P., Forbes, A. G.About
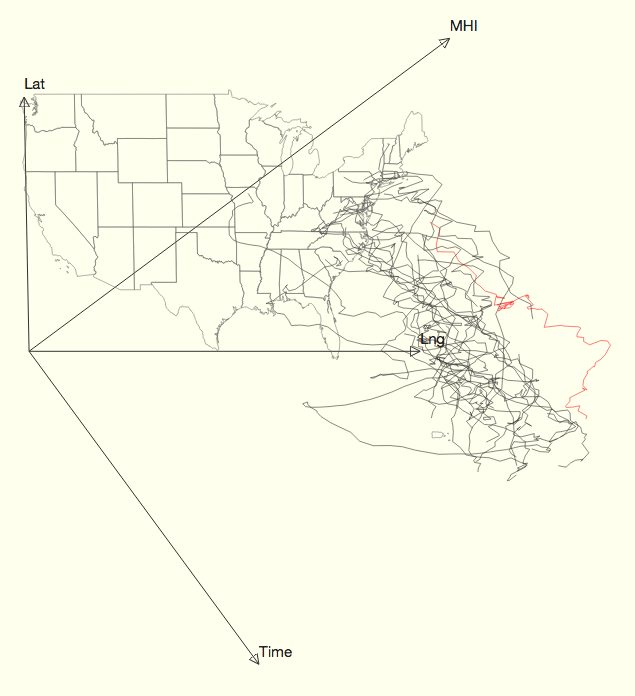
The visualization of space-time trajectory data is challenging due to the fact that, in most cases, the data inherently exists in more than two dimensions. In many space-time visualizations, additional variables must be mapped into other visual attributes such as color or size. Given that substantive analyses of trajectory data will likely be concerned with variables beyond space and time, we propose a method that allows trajectory positions to be determined by an arbitrary number of variables in a multi-dimensional space-time dataset. Our method is based on Star Coordinates, a prior technique for interactively positioning multi-dimensional data. Our technique is catered specifically to multi-dimensional space-time trajectory data. The technique is demonstrated using a large multi-dimensional space-time dataset related to touring musicians.
Resources
Citation
Murray, P., Forbes, A. G., StretchPlot: Interactive Visualization of Multi-Dimensional Trajectory Data, Proceedings of IEEE Visualization (VIS) 2014, Paris, France, November 11th, 2014.