
Top Challenges in the Visualization of Engineering Tensor Fields
January 1st, 2014
Categories: Applications, Software, Visualization
Authors
Hlawitschka, M., Hotz, I., Kratz, A., Marai, G.E., Moreno, R., Scheuermann, G., Stommel, M., Wiebel, A., Zhang, E.About
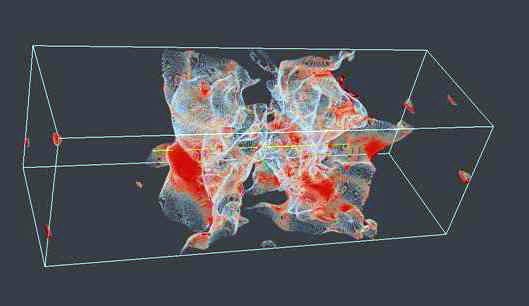
In this chapter we summarize the top research challenges in creating successful visualization tools for tensor fields in engineering. The analysis is based on our collective experiences and on discussions with both domain experts and visualization practitioners. We find that creating visualization tools for engineering tensors often involves solving multiple different technical problems at the same time - including visual intuitiveness, scalability, interactivity, providing both detail and context, integration with modeling and simulation, representing uncertainty and managing multi-fields; as well as overcoming terminology barriers and advancing research in the mathematical aspects of tensor field processing. We further note the need for tools and data repositories to encourage faster advances in the field. Our interest in creating and proposing this list is to initiate a discussion about important research issues within the visualization of engineering tensor fields.
Resources
Citation
Hlawitschka, M., Hotz, I., Kratz, A., Marai, G.E., Moreno, R., Scheuermann, G., Stommel, M., Wiebel, A., Zhang, E., Top Challenges in the Visualization of Engineering Tensor Fields, Visualization and Processing of Tensors and Higher-Order Descriptors for Multi-field Data, Springer, pp. 1-13, Westin, C.F.|Burgeth, B.|Vilanova, A. (editors), January 1st, 2014.