
Extended LineSets: A visualization technique for the interactive inspection of biological pathways
July 10th, 2015
Categories: Applications, Visual Analytics, Visual Informatics
Authors
Paduano, F., Forbes, A.G.About
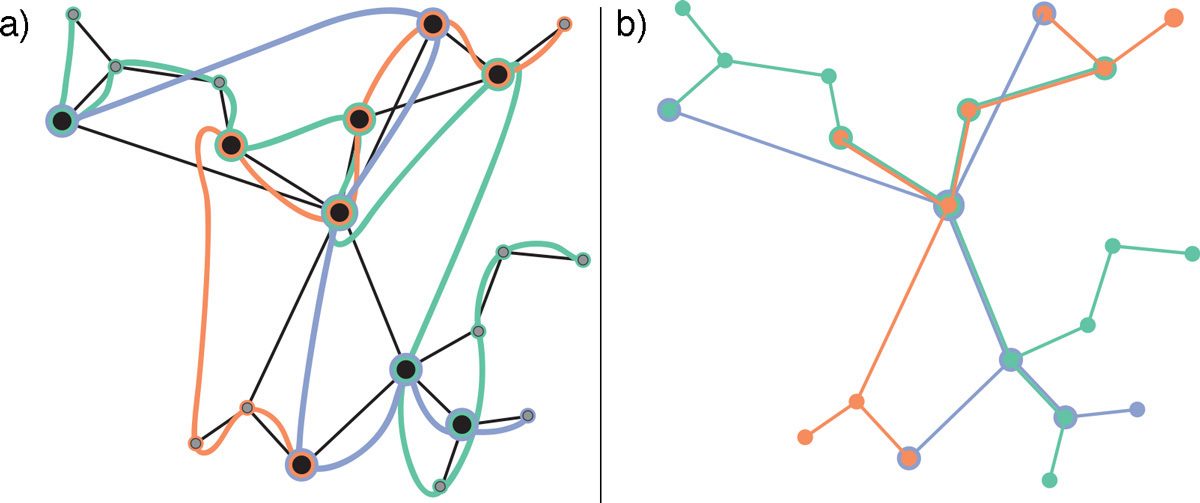
Background: Biologists make use of pathway visualization tools for a range of tasks, including investigating inter-pathway connectivity and retrieving details about biological entities and interactions. Some of these tasks require an understanding of the hierarchical nature of elements within the pathway or the ability to make comparisons between multiple pathways. We introduce a technique inspired by LineSets that enables biologists to fulfill these tasks more effectively.
Results: We introduce a novel technique, Extended LineSets, to facilitate new explorations of biological pathways. Our technique incorporates intuitive graphical representations of different levels of information and includes a well designed set of user interactions for selecting, filtering, and organizing biological pathway data gathered from multiple databases.
Conclusions: Based on interviews with domain experts and an analysis of two use cases, we show that our technique provides functionality not currently enabled by current techniques, and moreover that it helps biologists to better understand both inter-pathway connectivity and the hierarchical structure of biological elements within the pathways.
Resources
Citation
Paduano, F., Forbes, A.G., Extended LineSets: A visualization technique for the interactive inspection of biological pathways, BMC Proceedings, 5th Symposium on Biological Data Visualization, Dublin, Ireland, pp. 9(6):S4, July 10th, 2015.