
SwordPlots: Exploring Neuron Behavior within Dynamic Communities of Brain Networks
January 1st, 2016
Categories: Applications, Visualization, Visual Analytics
Authors
Ma, C., Forbes, A. G., Llano, D. A., Berger-Wolf, T., Kenyon, R. V.About
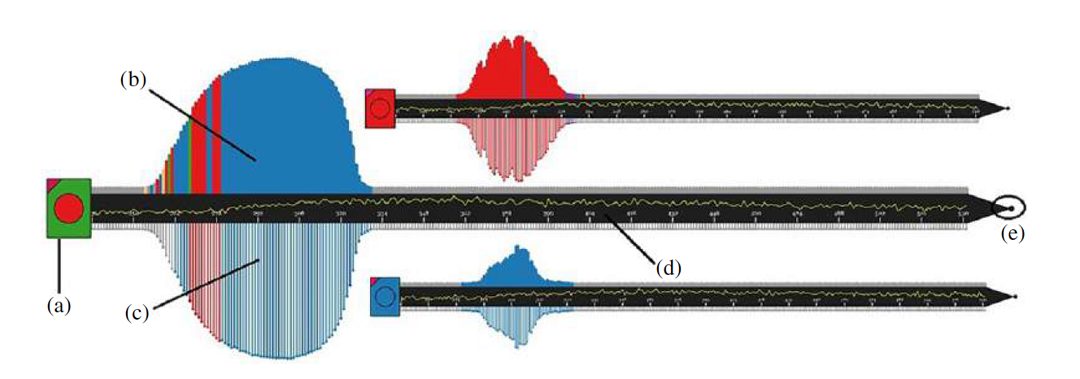
Study of the behavior of individual members in communities of dynamic networks can help neuroscientists to understand how interactions between neurons in brain networks change over time. Visualization of those temporal features is challenging, especially for networks embedded within spatial structures, such as brain networks. In this article, the authors present the design of SwordPlots, an interactive multi-view visualization system to assist neuroscientists in their exploration of dynamic brain networks from multiple perspectives. Their visualization helps neuroscientists to understand how the functional behavior of the brain changes over time, how such behaviors are related to the spatial structure of the brain, and how communities of neurons with similar functionality evolve over time. To evaluate their application, they asked neuroscientists to use SwordPlots to examine four different mouse brain data sets. Based on feedback, their visualization design can provide neuroscientists with the ability to gain new insights into the properties of dynamic brain networks.
Resources
Citation
Ma, C., Forbes, A. G., Llano, D. A., Berger-Wolf, T., Kenyon, R. V., SwordPlots: Exploring Neuron Behavior within Dynamic Communities of Brain Networks, Journal of Imaging Science and Technology, 2017 Charles E. Ives Journal Award, no 601, January 1st, 2016.