
Intrinsic Geometry Visualization for the Interactive Analysis of Brain Connectivity Patterns
February 16th, 2016
Categories: Applications, Visual Analytics
Authors
Conte, G., Ye, A., Almryde, K., Ajilore, O., Leow, A., Forbes, A. G.About
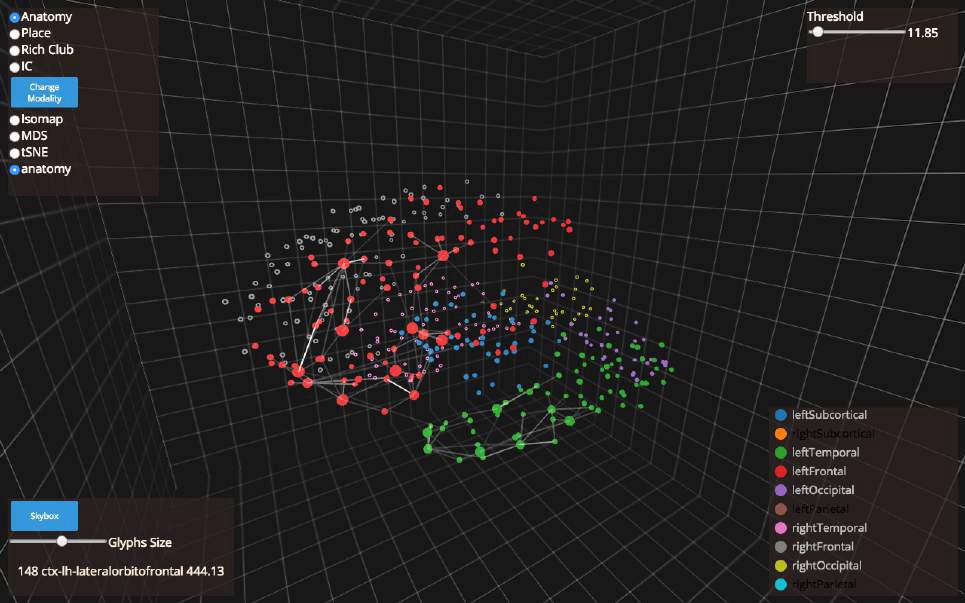
Understanding how brain regions are interconnected is an important topic within the domain of neuroimaging. Advances in non-invasive technologies enable larger and more detailed images to be collected more quickly than ever before. These data contribute to create what is usually referred to as a connectome, that is, a comprehensive map of neural connections. The availability of connectome data allows for more interesting questions to be asked and more complex analyses to be conducted. In this paper we present a novel web-based 3D visual analytics tool that allows user to interactively explore the intrinsic geometry of the connectome. That is, brain data that has been transformed through a dimensionality reduction step, such as multidimensional scaling (MDS), Isomap, or t-distributed stochastic neighbor embedding (t-SNE) techniques. We evaluate our tool through a series of real-world case studies, demonstrating its effectiveness in aiding domain experts for a range of neuroimaging tasks.
Resources
Citation
Conte, G., Ye, A., Almryde, K., Ajilore, O., Leow, A., Forbes, A. G., Intrinsic Geometry Visualization for the Interactive Analysis of Brain Connectivity Patterns, Visualization and Data Analysis (VDA), Proceedings of IS&T Electronic Imaging, San Francisco, CA, February 16th, 2016.