
ProvenanceMatrix: A Visualization Tool for Multi-Taxonomy Alignments
October 11th, 2015
Categories: Visualization, Visual Analytics, Visual Informatics
Authors
Dang, T., Franz, N., Ludascher, B., Forbes, A. G.About
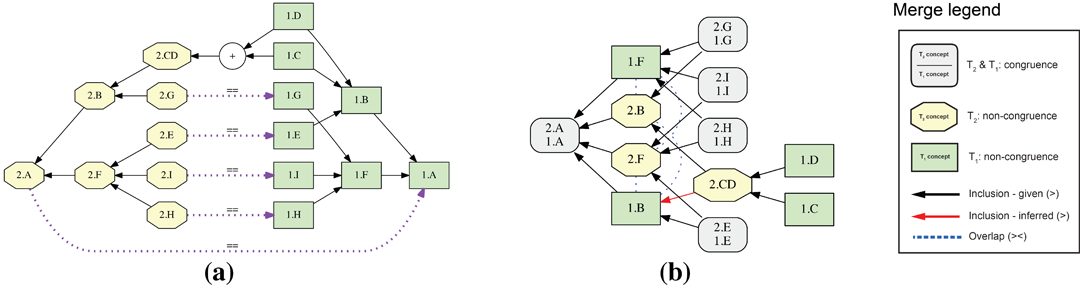
Visualizing and analyzing the relationships between taxonomic entities represented in multiple input classifications is both challenging and required due to recurrent new discoveries and inferences of taxa and their phylogenetic relationships. Despite the availability of numerous visualization techniques, the large size of hierarchical classifications and complex relations between taxonomic entities generated during a multi-taxonomy alignment process requires new visualizations. This paper introduces ProvenanceMatrix, a novel tool allowing end users (taxonomists, ecologists, phylogeneticists) to explore and comprehend the outcomes of taxonomic alignments. We illustrate the use of ProvenanceMatrix through examples using taxonomic classifications of various sizes, from a few to hundreds of taxonomic entities and hundreds of thousands of relationships.
Keywords: Taxonomic classification, multi-taxonomy alignment, phylogenetic relationship, matrix representation, glyph-based visualization
Resources
Citation
Dang, T., Franz, N., Ludascher, B., Forbes, A. G., ProvenanceMatrix: A Visualization Tool for Multi-Taxonomy Alignments, In Proceedings of the ISWC Workshop on Visualizations and User Interfaces for Ontologies and Linked Data (VOILA), Bethlehem, Pennsylvania, pp. 13-24, October 11th, 2015.