
10 simple rules to create biological network figures for communication
June 28th, 2019
Categories: Applications, Visual Analytics, Visual Informatics
Authors
Marai, G.E., Pinaud, B., Buehler, K., Lex, A., Morris, J.H.About
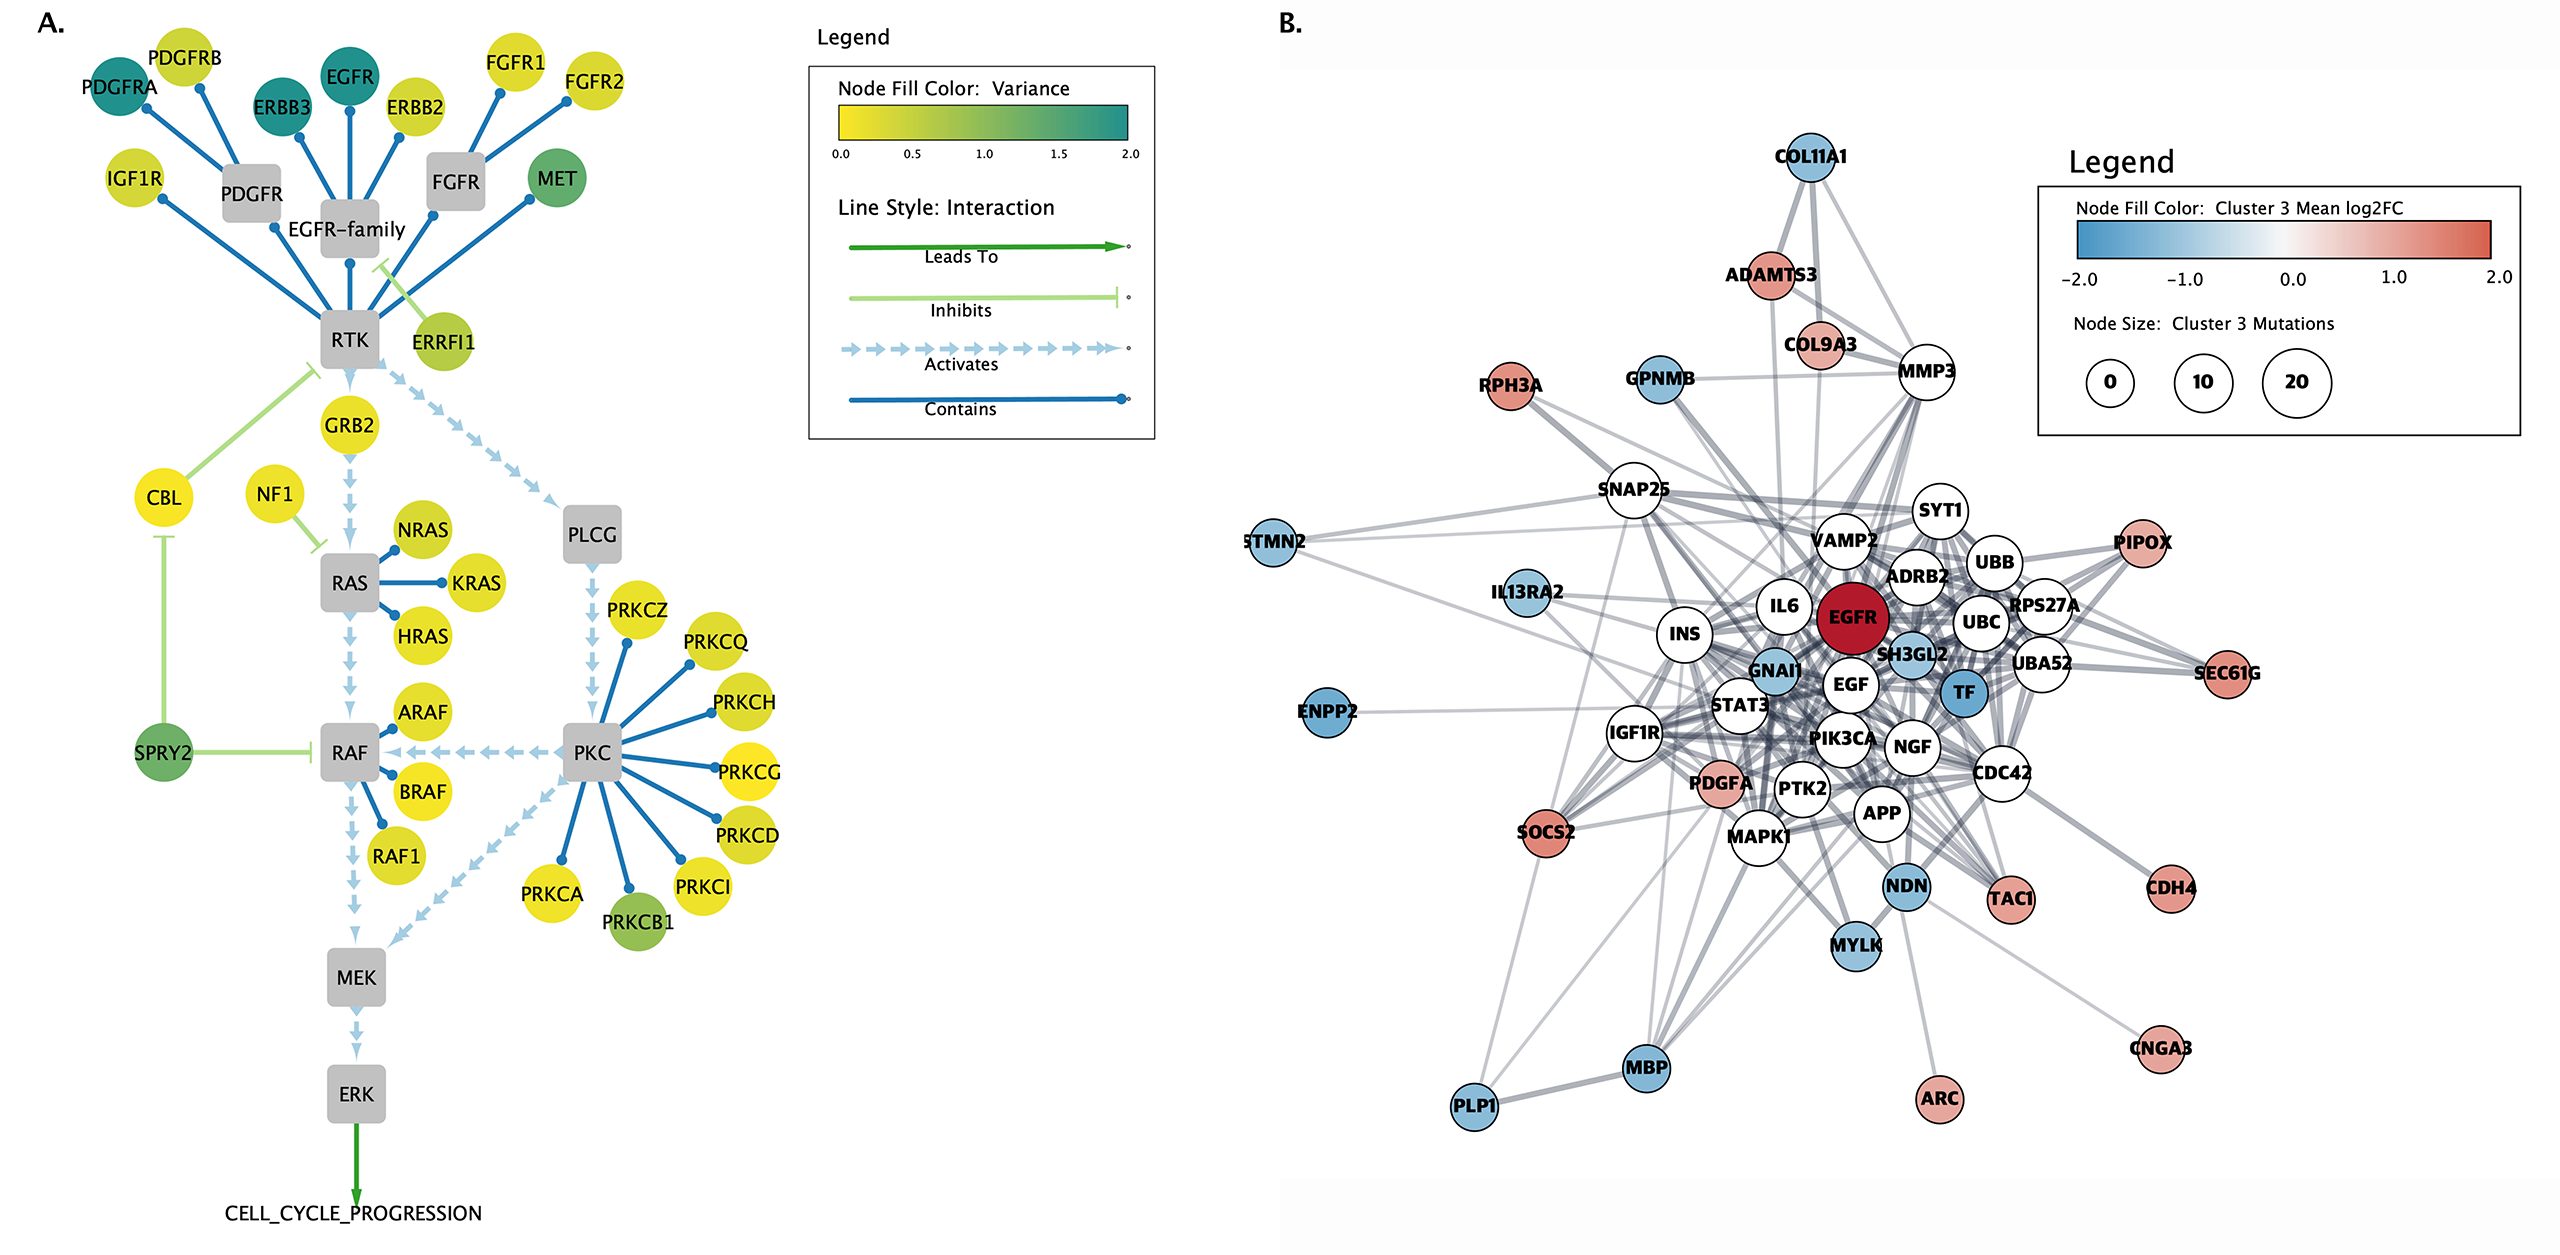
Biological network figures are ubiquitous in the biology and medical literature. On the one hand, a good network figure can quickly provide information about the nature and degree of interactions between items, and enable inferences about the reason for those interactions. On the other hand, good network figures are difficult to create. In this paper, we outline 10 simple rules for creating biological network figures for communication, from choosing layouts, to applying color or other channels to show attributes, to the use of layering and separation. These rules are accompanied by illustrative examples. We also provide a concise set of references and additional resources for each rule.
Resources
Citation
Marai, G.E., Pinaud, B., Buehler, K., Lex, A., Morris, J.H., 10 simple rules to create biological network figures for communication, PLOS Computational Biology, pp. 1-17, June 28th, 2019.