Alumni Insley’s Imagery Featured in Science Grid
December 14th, 2005
Categories: Applications, Visualization

About
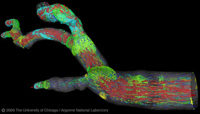
EVL alumni and The University of Chicago / Argonne National Laboratory (UC / ANL) research staff member, Joe Insley’s visualization of a three-dimensional simulation of the human arterial tree is the Science Grid featured image of the week.
A research team from UC / ANL TeraGrid Resource Provider has teamed with researchers from Brown University to provide visualization support for their Human Arterial Tree Simulation Project. Motivated by a grand-challenge problem in biomechanics, the Brown team, along with a colleague from Northern Illinois University, is striving to simulate blood flow in the entire human arterial tree. These simulations are run across multiple TeraGrid resources, and take advantage of the available bandwidth of the TeraGrid network to transfer data between the simulations and the visualization pipeline. A distributed visualization pipeline was designed and developed by the UC / ANL group that both archives data produced by these simulations and is capable of visualizing it in near real time, with little impact on the performance and stability of the running simulation. An early prototype of the system was demonstrated at iGrid 2005 in San Diego this past September, with a second-generation system being shown at SC05 in Seattle in November.