
CytoViz: an Artistic Mapping of Network Measurements as Living Organisms in a VR Application
January 28th, 2007
Categories: Applications, Networking, Software, Visualization
Authors
Lopez Silva, B.A., Renambot, L.About
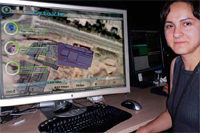
CytoViz is an artistic, real-time information visualization driven by statistical information gathered during gigabit network transfers to the Scalable Adaptive Graphical Environment (SAGE) at various events. Data streams are mapped to cellular organisms defining their structure and behavior as autonomous agents. Network bandwidth drives the growth of each entity and the latency defines its physics-based independent movements. The collection of entity is bound within the 3D representation of the local venue. This visual and animated metaphor allows the public to experience the complexity of high-speed network streams that are used in the scientific community.
Moreover, CytoViz displays the presence of discoverable Bluetooth devices carried by nearby persons. The concept is to generate an event-specific, real-time visualization that creates informational 3D patterns based on actual local presence. The observed Bluetooth traffic is put in opposition of the wide-area networking traffic by overlaying 2D animations on top of the 3D world. Each device is mapped to an animation fading over time while displaying the name of the detected device and its unique physical address.
CytoViz was publicly presented at two major international conferences in 2005 (iGrid2005 in San Diego, CA and SC05 in Seattle, WA).
Keywords: Visualization, network performance, Bluetooth, information visualization
Resources
Citation
Lopez Silva, B.A., Renambot, L., CytoViz: an Artistic Mapping of Network Measurements as Living Organisms in a VR Application, IS&T / SPIE Electronic Imaging 2007 Conference Proceedings, January 28th, 2007.