
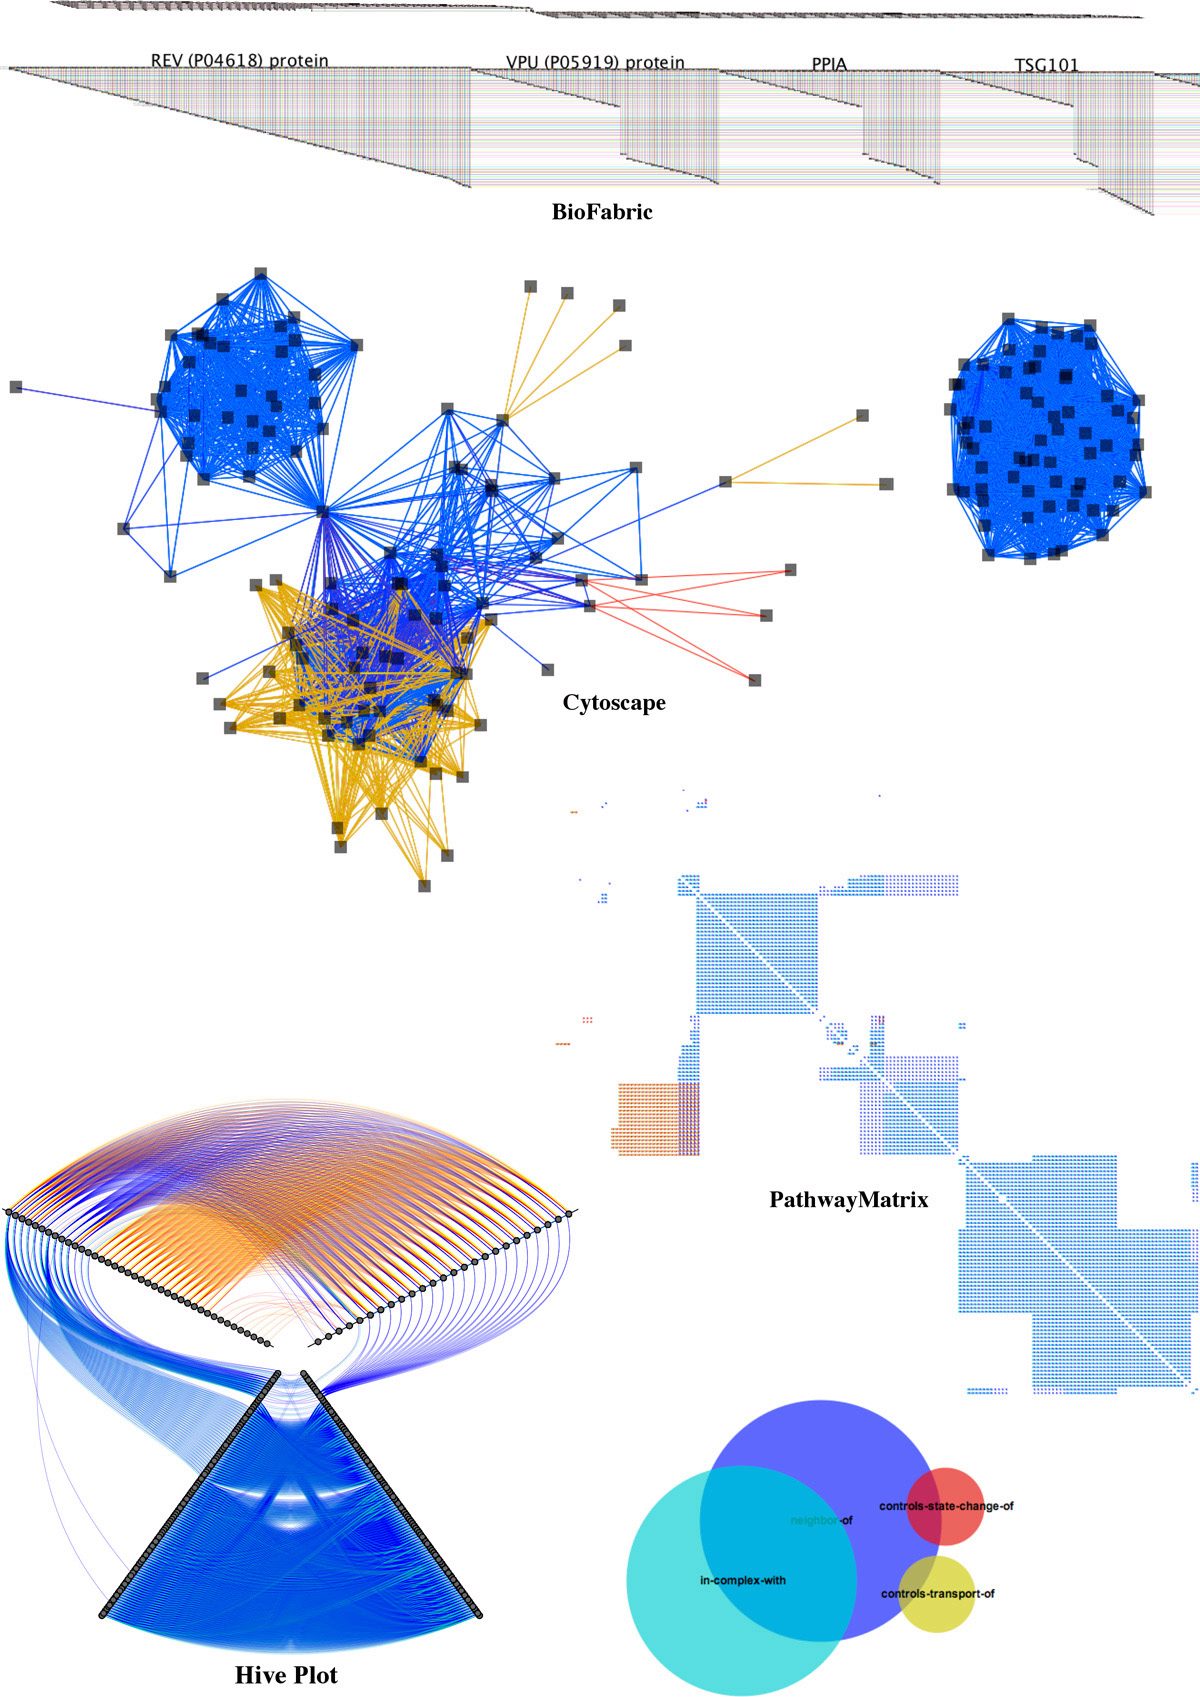
PathwayMatrix: Visualizing Binary Relationships between Proteins in Biological Pathways
July 10th, 2015
Categories: Applications, Data Mining, Software, Visualization, Visual Analytics, Visual Informatics
Authors
Dang, T., Murray, P., Forbes, A.About
Background: Molecular activation pathways are inherently complex, and understanding relations across many biochemical reactions and reaction types is difficult. Visualizing and analyzing a pathway is a challenge due to the network size and the diversity of relations between proteins and molecules.
Results: In this paper, we introduce PathwayMatrix, a visualization tool that presents the binary relations between proteins in the pathway via the use of an interactive adjacency matrix. We provide filtering, lensing, clustering, and brushing and linking capabilities in order to present relevant details about proteins within a pathway.
Conclusions: We evaluated PathwayMatrix by conducting a series of in-depth interviews with domain experts who provided positive feedback, leading us to believe that our visualization technique could be helpful for the larger community of researchers utilizing pathway visualizations.
PathwayMatrix is freely available at https://github.com/CreativeCodingLab/PathwayMatrix.
Keywords: Pathway visualization; Biological networks; Matrix visualization; Binary Relationships
Resources
Citation
Dang, T., Murray, P., Forbes, A., PathwayMatrix: Visualizing Binary Relationships between Proteins in Biological Pathways, Proceedings of the 5th Symposium on Biological Data Visualization, BioVis 2015, Dublin, Ireland, July 10th, 2015.