Visualizing Dynamic Brain Networks Using an Animated Dual-Representation
May 4th, 2015
Categories: Applications, Visual Analytics, Visual Informatics

Authors
Ma, C., Kenyon, R.V., Forbes, A.G., Berger-Wolf, T., Slater, B.J., Llano, D.A.About
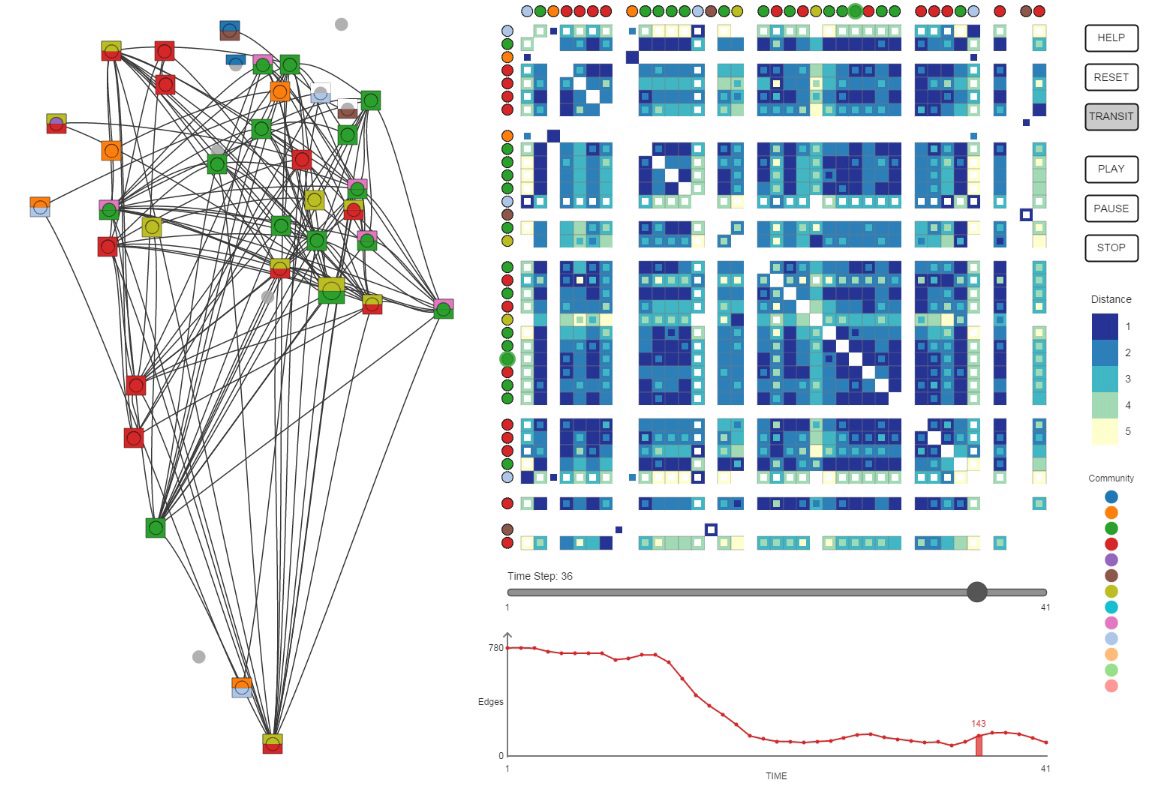
Dynamic network visualization has been a challenging topic for dynamic networks analysis, especially for spatially embedded networks like brain networks. In this paper, we present an animated interactive visualization design that combines enhanced node-link diagrams and distance matrix layouts to assist neuroscientists in their exploration of dynamic brain networks and that enables them to understand how functional connections relate to the spatial structure of the brain. Our visualization also provides the ability to observe the evolution of a network, the change in the community identities, and node behavior over time.
Resources
URL
Citation
Ma, C., Kenyon, R.V., Forbes, A.G., Berger-Wolf, T., Slater, B.J., Llano, D.A., Visualizing Dynamic Brain Networks Using an Animated Dual-Representation, In Proceedings of the Eurographics Conference on Visualization (EuroVis'15), Short Papers Track, Cagliari, Italy: Eurographics Association, pp. 73-77, May 4th, 2015. https://diglib.eg.org/handle/10.2312/eurovisshort.20151128.073-077