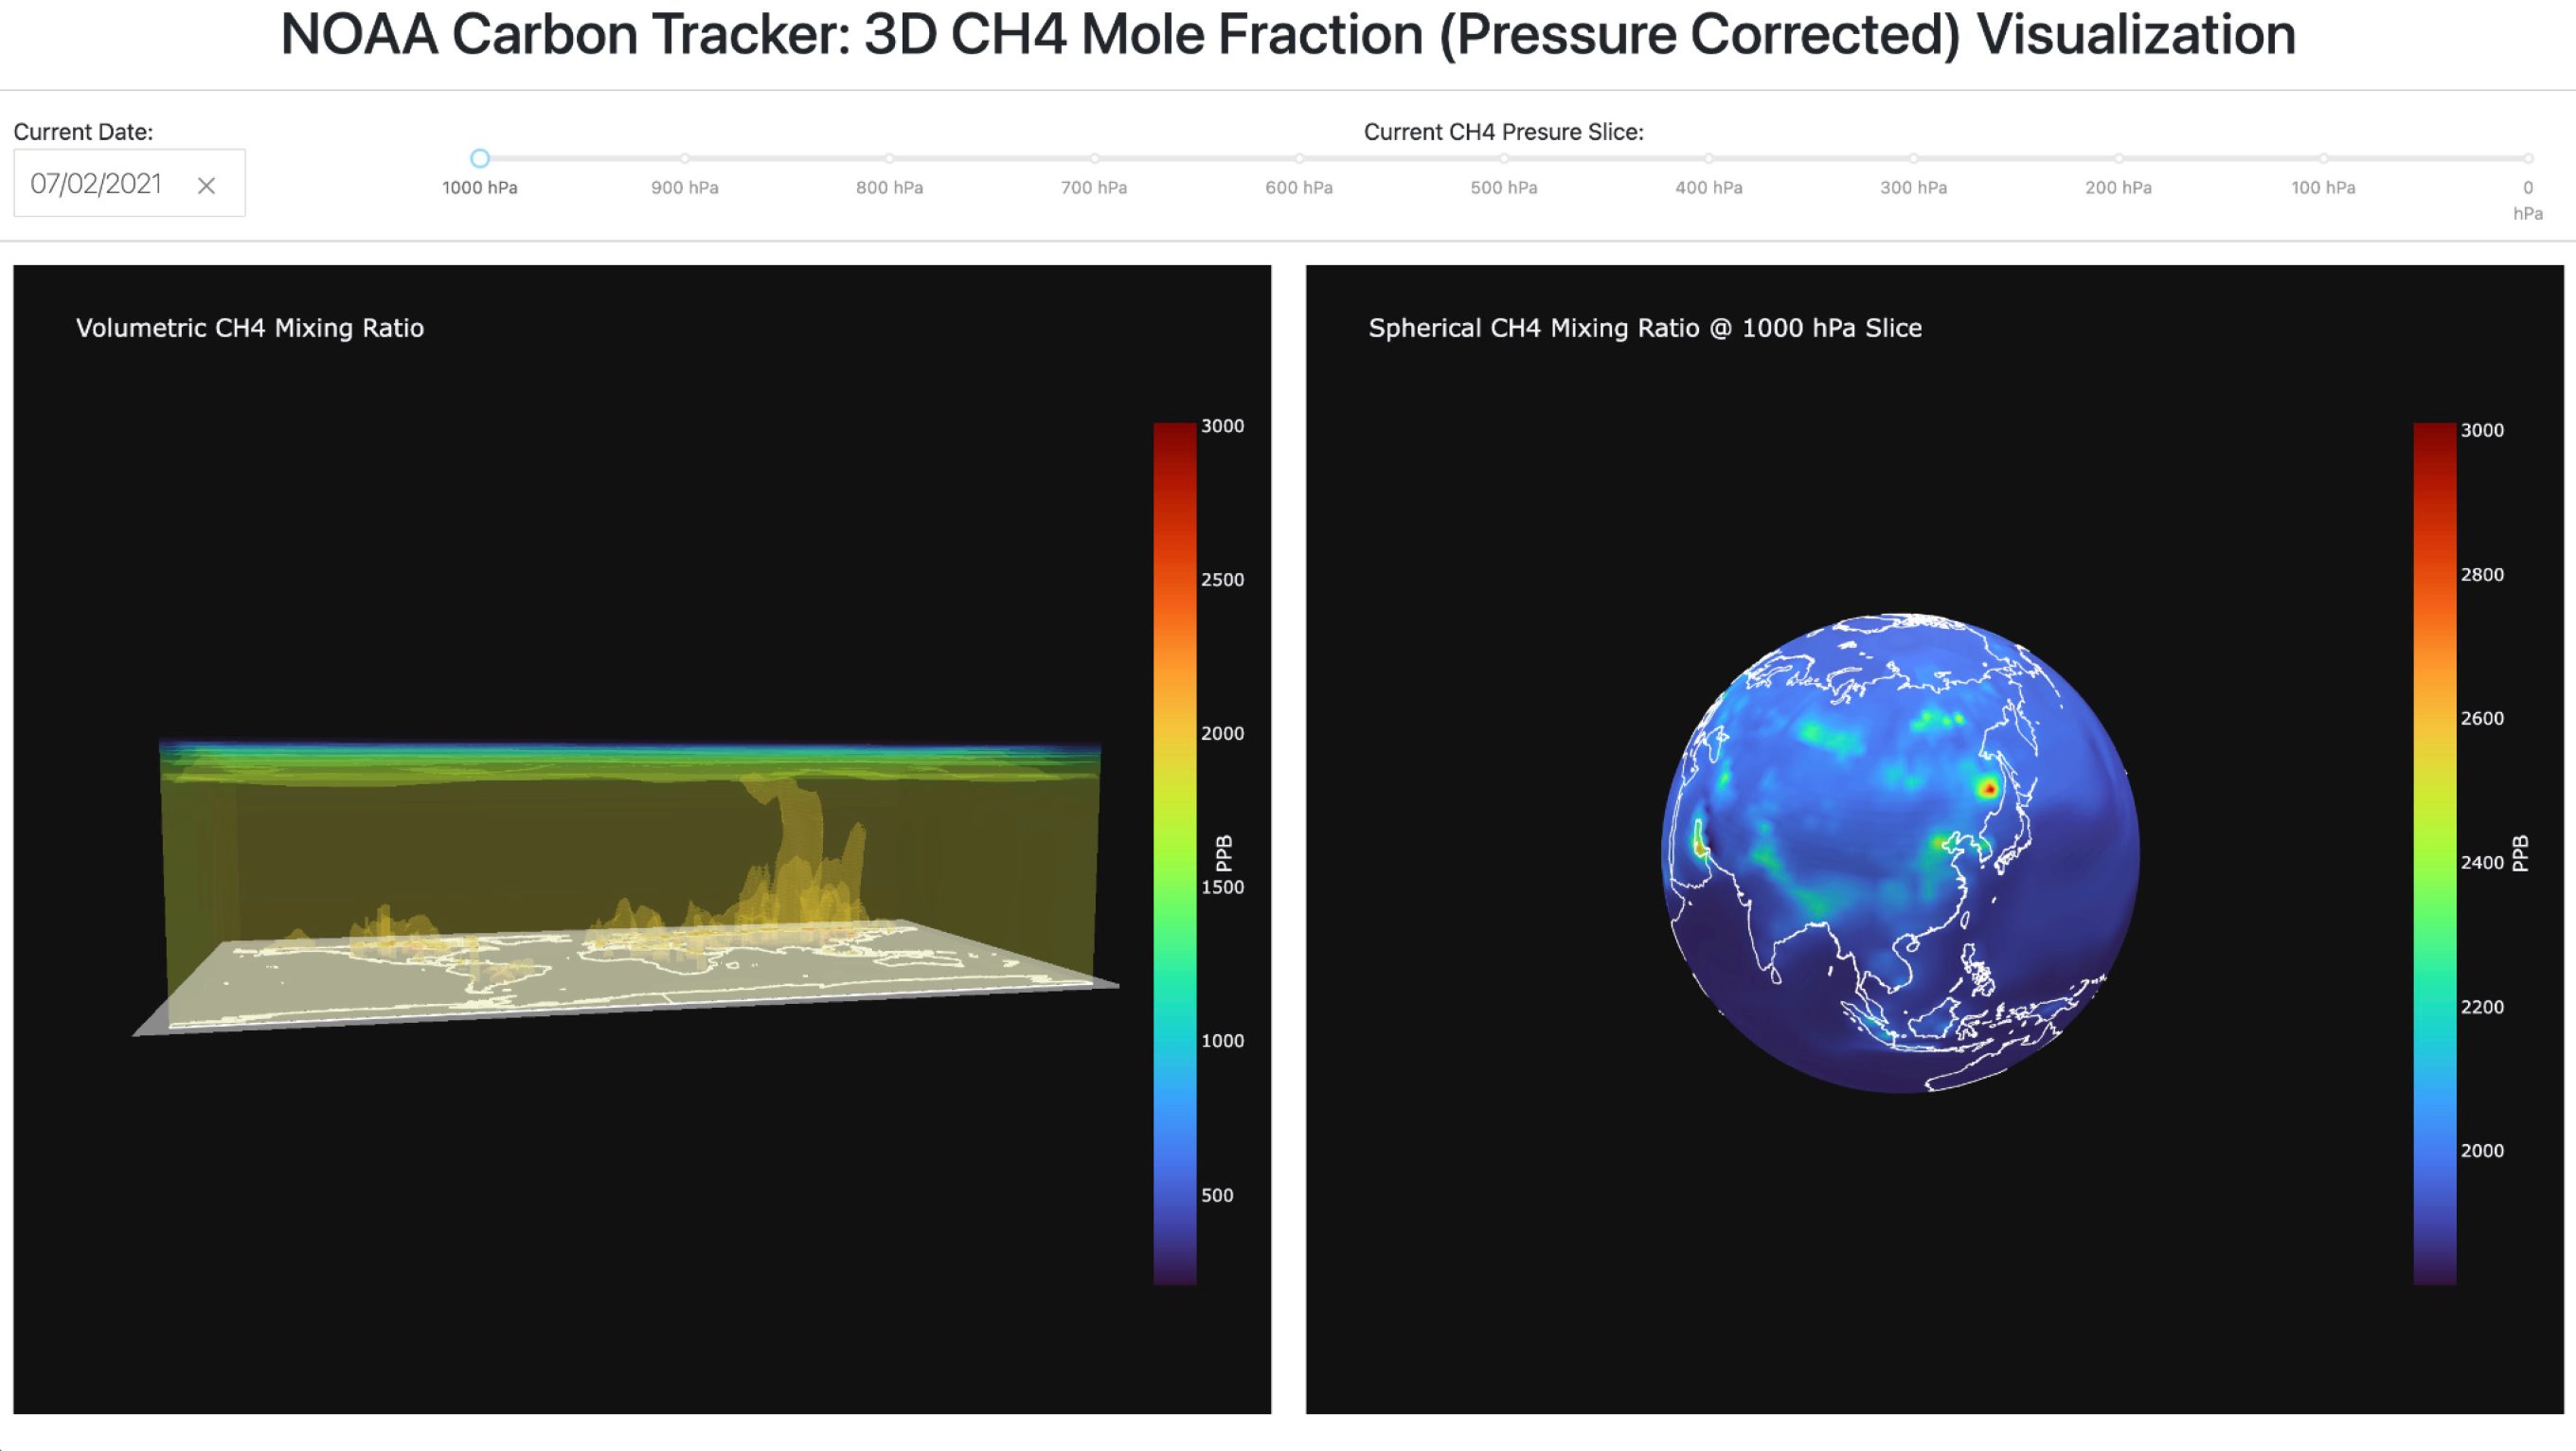
Visualizing the NOAA CarbonTracker-CH4 3-D Mole Fraction (Pressure Corrected) Dataset
May 1st, 2023
Categories: Applications, Visualization, Visual Analytics, Data Science

Authors
Ziminski, M.About
Methane the main component of natural gas is also a potent greenhouse gas that requires robust monitoring, so that scientists, educators, and the general public can get better informed of its effect(s) on local/regional air quality and current short-term mitigations for climate change. However, current data visualizations for methane, and other scientific data, are either static 2-D graphs/plots or animated through using videos/gifs. These data visualization approaches can be limiting in that they lack interactiveness for an end user to gain exploratory insights by comparing and contrasting different areas of a dataset. This report thereby showcases how to build a functional and interactive visualization as the solution to the previously mentioned limitation.
Keywords: Interactive Scientific Data Visualization, Climate Data Visualization, Methane Visualization
Resources
Citation
Ziminski, M., Visualizing the NOAA CarbonTracker-CH4 3-D Mole Fraction (Pressure Corrected) Dataset, Submitted in partial fulfillment of the requirements for the degree of Master in Computer Science, Graduate College, Chicago, IL, May 1st, 2023.