
Empowering Communities: Tailored Pandemic Data Visualization for Varied Tasks and Users
April 14th, 2025
Categories: Applications, Software, Visualization, Visual Analytics, Data Science
Authors
Baumgartl, T., Ghoniem, M., von Landesberger, T., Marai, G. E., Miksch, S., Scheithauer, S., Srivastava, N.About
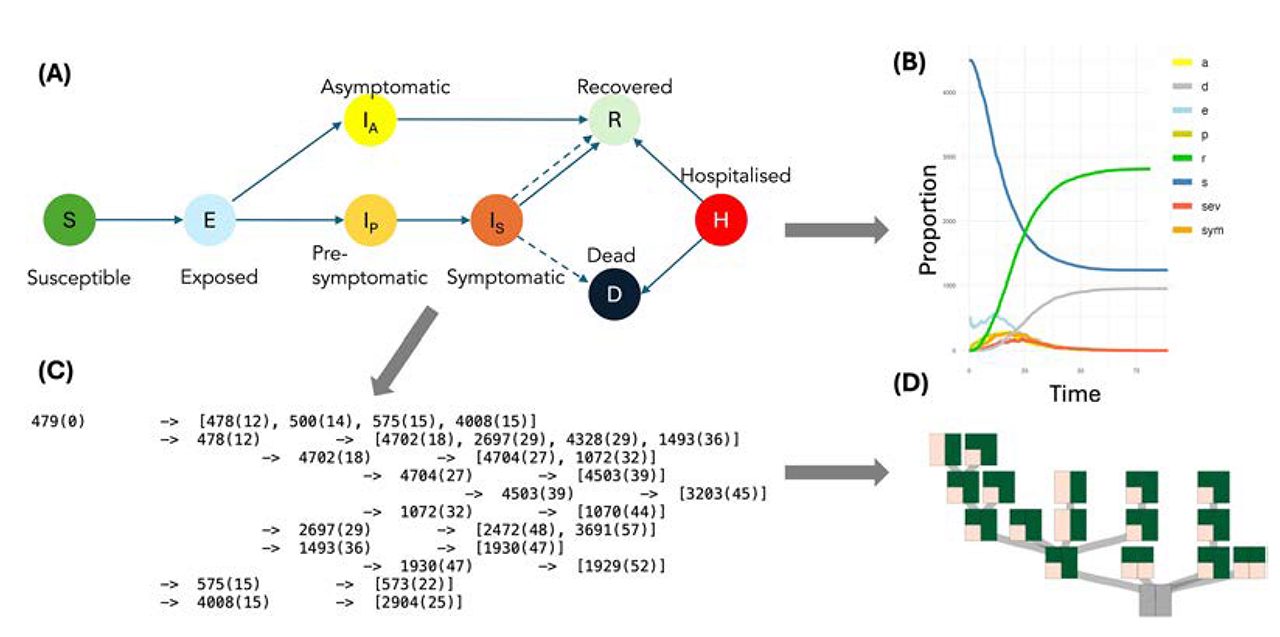
Data visualization methodologies were intensively leveraged during the COVID-19 pandemic. We review our design experience working on a set of interdisciplinary COVID-19 pandemic projects. We describe the challenges we met in these projects, characterize the respective user communities, the goals and tasks we supported, and the data types and visual media we worked with. Furthermore, we instantiate these characterizations in a series of case studies. Finally, we describe the visual analysis lessons we learned, considering future pandemics.
https://ieeexplore.ieee.org/document/10964487
Resources
URL
Citation
Baumgartl, T., Ghoniem, M., von Landesberger, T., Marai, G. E., Miksch, S., Scheithauer, S., Srivastava, N., Empowering Communities: Tailored Pandemic Data Visualization for Varied Tasks and Users, IEEE Computer Graphics and Applications, vol 45, no 1, pp. 130 - 138, April 14th, 2025. https://ieeexplore.ieee.org/document/10964487