
From Peaks to Patterns
November 2nd, 2025
Categories: Applications, Visualization, Visual Analytics, Data Science
Authors
Fathollahian, H., Salahshour, M.About
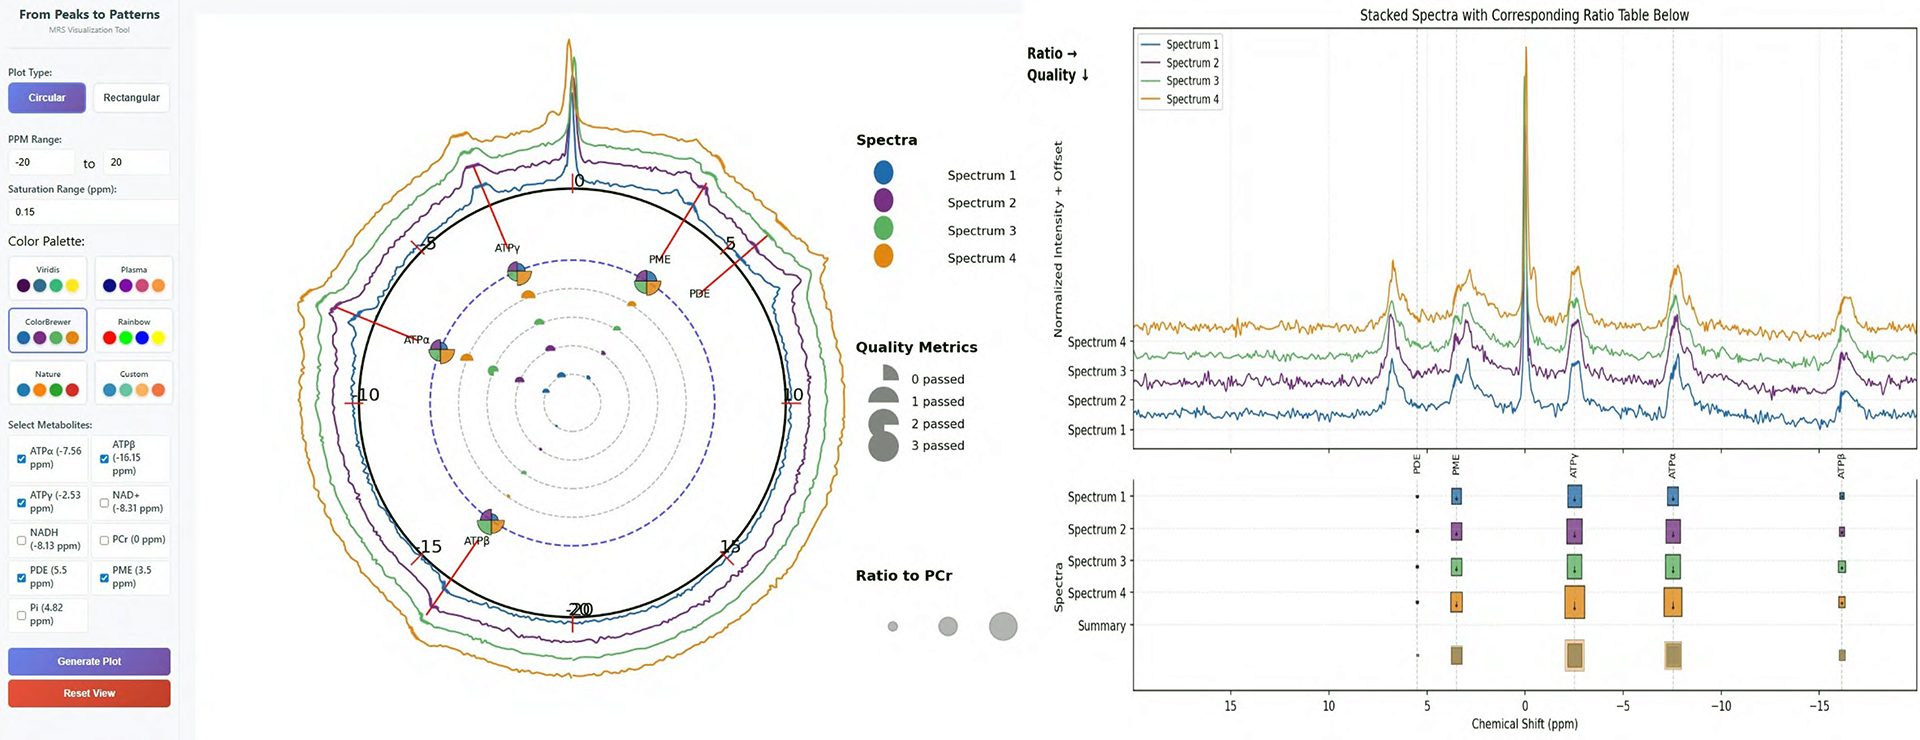
MRS is a non-invasive way of gaining information about cellular metabolism and can be used to study neurological and metabolic disorders. However, the clinical utility is limited by low signal quality, overlapping spectral peaks, and the inability to interpret and compare metabolite data. We developed an interactive visual analysis system that integrates methods for filtering, quality measurement, and comparative summaries of MRS signals, enabling researchers to more effectively evaluate and interpret spectral data. This will allow researchers to perform a more accurate evaluation of spectral data, which will help them understand the molecular processes behind the complex neurological and metabolic processes in greater depth.
Index Terms: Glyph-based Visualization, Quality Metrics, Multimodal Visualization.
Resources
URL
Citation
Fathollahian, H., Salahshour, M., From Peaks to Patterns, IEEE Vis 2025 (Bio+MedVis Challenge Poster), Vienna, Austria, IEEE, November 2nd, 2025. http://biovis.net/2025/biovisChallenges_vis/