
Data-Mining Visualization
September 1st, 1998 - December 1st, 1999
Categories: Applications, Data Mining, Supercomputing
About
The Health Care field is data rich, but information poor. Data exists from admissions, laboratory, radiology, and pharmacy systems, as well as from third-party systems, which consolidate data from a variety of sources. However, for a number of reasons, these have remained “islands of information.” With the rise in implementation of clinical data repositories (one such repository is being built at the UIC Hospital), where transaction data is stored in a normalized relational format at the enterprise level, there is the promise of:
- Generating outcome information (e.g., that 2 additional days in Intensive Care Units results in fewer re-admissions of HIV patients with pneumocystis carinii pneumonia).
- Identifying treatment patterns by physician.
- Monitoring the health status of the community (e.g., the incidence and prevalence of disease, illness, traumatic injury) in order to project future utilization of services, and appropriateness of care across various settings (e.g., whether or not care in lower cost sites yields the same or better outcomes).
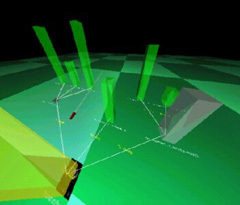
Obtaining information from such repositories has been through the conventional use of SQL or forms-driven queries. These types of queries rely on the inquirer knowing up front what information he / she wants back. These commercial packages do not detect “hidden” patterns (i.e., ones that have not been thought of before). Given the complexity of the clinical, demographic and financial data in the repository, data-mining techniques can extract information that is missed by traditional query techniques. To augment this process, the results of the data-mining algorithms (decision trees) are visualized by generating a VRML1 model which is quickly imported into LIMBO for collaborative viewing. Although this was originally intended as a tool for understanding the decisions made by data-mining algorithms, it has currently found a greater use in debugging the algorithms. The added dimension of stereoscopic 3D graphics allows one to visualize more data than is normally possible in a tree drawn on a flat display. The collaborative capabilities allows one to discuss these trees with other researchers.
This project is a collaboration between the Electronic Visualization Laboratory and the National Center for Data Mining at the University of Illinois at Chicago, directed by Robert Grossman.