
DASS
March 1st, 2021 - Ongoing
Categories: Applications, Software, Visualization, Visual Analytics, Machine Learning, Data Science
About
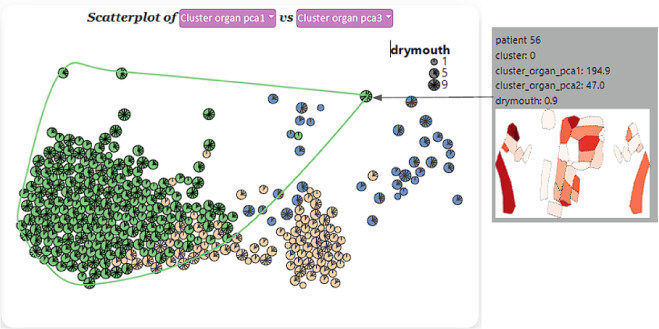
DASS is a visual computing system designed to help scientists build machine learning models that classify head and neck cancer patients into groups, based on their risk of developing permanent side effects from radiation therapy. Its visual interface helps data scientists to build a model for each side-effect by visualizing the patients&rsquo anatomical and other clinical data, and to figure out what parameters the model should consider, such as which organs may be damaged when side effects occur, what amount of radiation dose causes the damage to the organs, and how many risk groups to create. DASS also has features for explaining to clinicians the finished models and examining whether their predictions perform well, and the reasons behind why a given patient belongs in a certain risk group. DASS was created by visual computing researchers at EVL, in collaboration with clinicians at the MD Anderson Cancer Center and data mining specialists at University of Iowa, and is supported by funding from the US National Institutes of Health (NIH awards NCI-R01-CA258827 and NLM-R01-LM012527), and US National Science Foundation (NSF awards CDSE-1854815 and CNS-1828265).