The required textbook, Visualization Analysis and Design, by Tamara Munzner (CRC Press, 2014), is available in the bookstore. Interactive Data Visualization for the Web, by Scott Murray (O'Reilly, 2013) is available for free online.
— Course overview & policies
— Goals of visualization
— Information Visualization vs. Visual Analytics
— Programming assessment quiz
— Slides: Tu Th
— Complete survey & quiz
— Read Munzner, chapters 1 & 2
— Set up D3.js environment and pick one example of your choice from bl.ocks.org to explain in class 8/30
— Begin data collection for Project 1
Week 2
— Introduction to Javascript and D3.js
— Data abstraction, data types
— JS Bin examples: Basic D3v4 template
SVG example
Shapes from data
Scatterplots
Scaling
Dynamic Axes
- Standalone javascript/JSON examples .zip (requires a webserver: e.g. "python -m SimpleHTTPServer 8080"): Bar chart Donut chart Interactive world map Data binding
- w3schools.com SVG tutorial
- w3schools.com Javascript tutorial
- Mozilla Developers Network's Javascript reference
- Learn JS Data tutorial
- Bl.ock Builder
- D3 tutorials
— Munzner, chapter 3
— Murray, chapters 2,3, and 4 (if you aren't familiar with web basics); chapters 5,6,7, and 8 (for a more detailed introduction to D3)
— Finish tasks 2a and 2b for Project 1
Week 3
— Visual communication
— Dataset types and data types
— Slides: Tu Th
— Munzner, chapter 5
— Finish tasks 3 and 4 for Project 1, due Wed, 9/14 at 11:59pm. Detailed instructions are posted on Piazza.
— Study for quiz in Tuesday’s class
Week 4
— Marks and channels
— Slides: Th
— Munzner, chapters 4 and 6
Week 5
— “Nested” evaluation
— Slides: Tu Th
— Form groups & describe your initial ideas for Project 2 (see Piazza post for details)
Week 6
— D3.js programming lab (led by Shiwangi, with help from Andrew and Kristine)
— Text visualization
— Project 2 proposals
— Slides: Tu:D3 examples
Tu:SVG-pt1
Tu:SVG-pt2
Th
— Literature review exercise for Project 2
Week 7
— Dr. Tony Fast, a materials data scientist from Georgia Tech, will visit the class on Tuesday.
— Project 2 literature review presentations
— Temporal visualizations
— Links/examples: Andy Kirk’s The Design of Time Xarene Eskandar’s Time Pieces Nick Feltron’s PhotoViz Giorgia Lupi’s projects Space-time cube literature survey
Week 8
— Network visualization
— Colorspaces and colormaps
— Project 2 reports
— Slides: Tu Th
— Munzner, chapters 9 and 10
— Study for quiz in Tuesday’s class
— The Project 2 description, list of requirements, and grading rubric is now available. All materials for Project 2 are due by 11/1 at 3:30pm.
Week 9 - IEEE VIS in Baltimore
— IEEE VIS
— VISAP’16
— Guest talks from Kyle Almryde and Shi Yin
— Finalize Project 2
Week 10 - Project 2 Presentations
— Sing a Happy Tune, Brian, Xing, Mac, and Cody
— VizBooks, Nishant, Sai Priya, Sreeraj, and Vishnusri
— Global Warming Visualized, Aditi, Aryadip, and Hai
— Airport Wait Times to Enter the US, Surbhi, Minu, Pooja, and Shreyas
— Flight Delays, Federico and Nicolas
— Musical Moods, Ishta, Jae, James, and Kristine
— US Incarceration Rates from 1978-2014, Sneja and Laith
— Chicago Schools, Libraries, Crimes, Randy, Francisco, and Mario
— Exoplanets, Andy, Patrick, and Louis
— Visualizing Fuel Economy, Roldan, Denis, and Oscar
— Chicago Crime and School Suspensions, Jamie, Jacky, and Noah
— Socioeconomic Status in Relation to Electricity Usage in Chicago, Stephanie, Lubna, and Anthony
— Chicago Crime and Socio-economic Data, Sergio, Himalay, Dhrumin, and Arkadiusz
Week 11
— Options for Project 3 are introduced.
— Recommended texts for the course are: Sketching User Experiences: The Workbook, by Saul Greenberg, et al., Morgan Kaufmann, 2011 and Information Visualization: Perception for Design, by Colin Ware, Morgan Kaufmann, 2012.
— Bring your laptop to class.
— Use a git repo to back-up your files and make your projects/assignments available online.
— Set up a user account on Piazza and join CS 424: https://piazza.com/uic/fall2016/cs424.
On-time class attendance is mandatory. It is not possible to make up or compensate for missed class sessions. More than two unexcused absences will result in a reduction of the final grade by one letter grade; with every additional unexcused absence, the final grade will drop by an additional grade. Some of the discussions and exercises are done and graded in-class so you must attend class to receive these points.
You must submit all assignments via UIC Box unless otherwise instructed on the deadline specified for each assignment. Assignments must be professionally prepared with recommended computer applications. Unless otherwise stated, assignments must be submitted electronically via UIC Box.
A = Consistent growth as well as excellent work that consistently goes above and beyond what is required.
B = Above average growth as well as above average work.
C = Average growth as well as average work.
D = Dissatisfactory growth and incomplete work.
E = Dissatisfactory growth, incomplete work, and poor attendance.
The numeric breakdown for the final grade follows:
— Project 1: 10%
— Project 2: 20%
— Project 3: 30%
— Shorter assignments: 15%
— Quizzes: 15%
— Participation: 10%
D3 v4, what's new?: https://iros.github.io/d3-v4-whats-new
JS Bin: jsbin.com
Bl.ocks: bl.ocks.org
Three.js: threejs.org
Lynda.com@UIC: accc.uic.edu/service/training
Box@UIC, accc.uic.edu/service/box
Websites:
IEEE VIS
Visual Complexity
Flowing Data
Data Stories
FILWD
Dataisnature
VISAP
Lev Manovich's home page
Stamen Design
infosthetics
reddit's Data is Beautiful
Vintage Visualizations
Ben Fry's home page
Fathom Information Design
Interrogating Methodolgies
Dear Data
Martin Wattenberg's home page
HINT.FM
University of Washington's IDL
Isabel Meirelles' home page
Edward Tufte's home page
Kiln
Journals:
Transactions on Visualization and Computer Graphics (TVCG)
Computer Graphics Forum
Proceedings of Conference on Human Factors in Computing Systems (ACM CHI)
Information Visualization
Computer Graphics & Applications
Visualization Surveys:
spacetimecubevis.com dynamicgraphs.fbeck.com
treevis.net
setviz.net
aviz.fr/physvis
financevis.net
textvis.lnu.se
multivis.net
Any individuals with learning disabilities or special needs must make the instructor aware of them prior to the due date of the first major assignment. Those who require accommodations for access and participation in this course must be registered with the UIC Disability Resource Center.
If you wish to observe your religious holiday that is in the conflict with mandatory academic attendance, you must notify the instructor in advance.
You are responsible for understanding what constitutes academic dishonesty. Academic dishonesty is an extremely serious offense. All cases of academic dishonesty will be dealt with in accordance with the policies of the University.
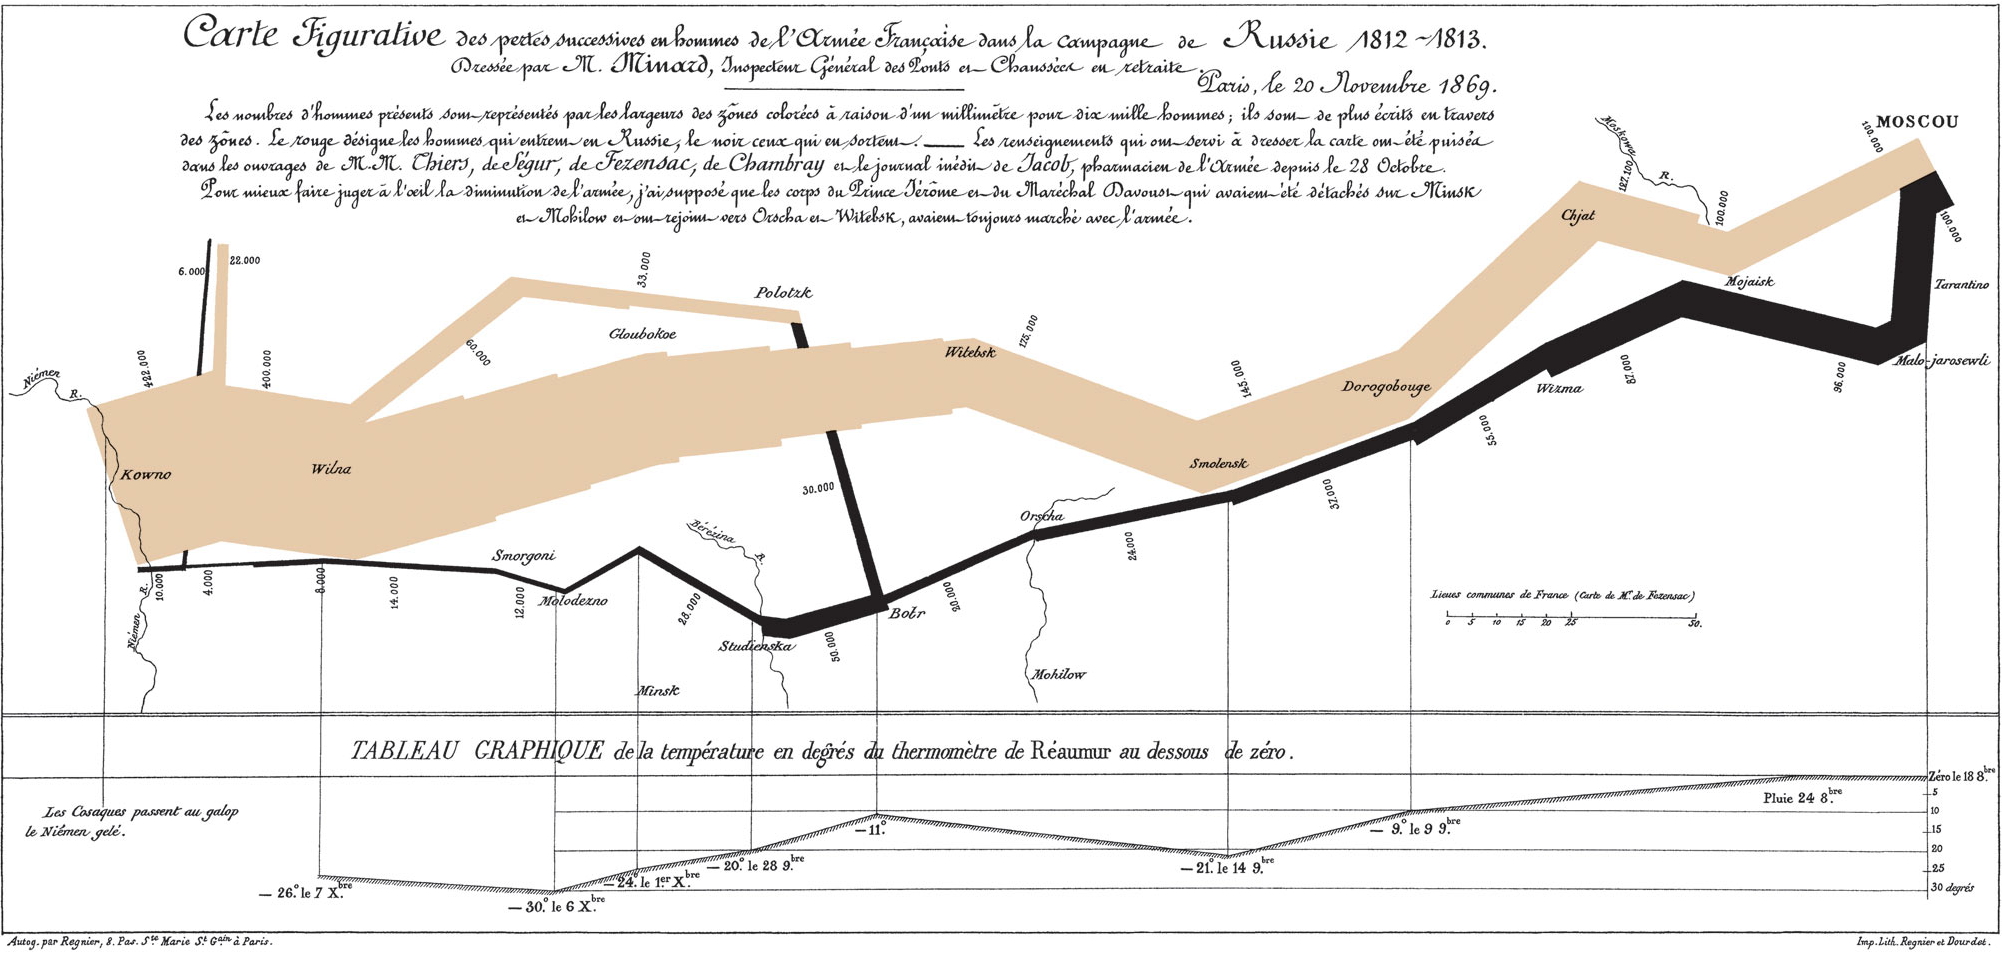
Charles Joseph Minard, Napolean’s March
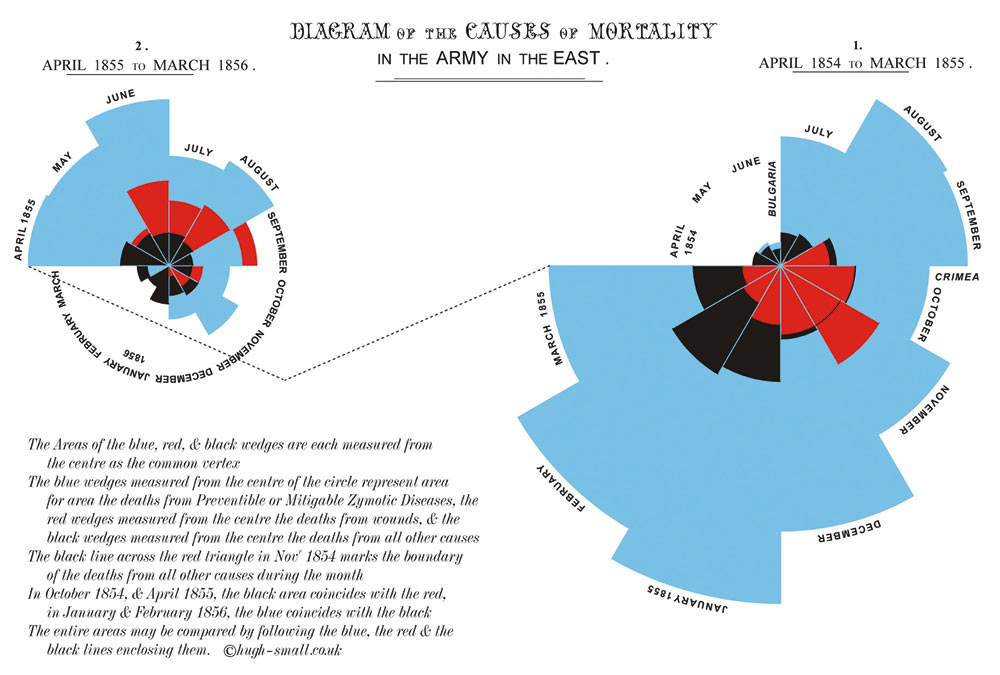
Florence Nightingale, Diagram of the Causes of Mortality in the Army in the East
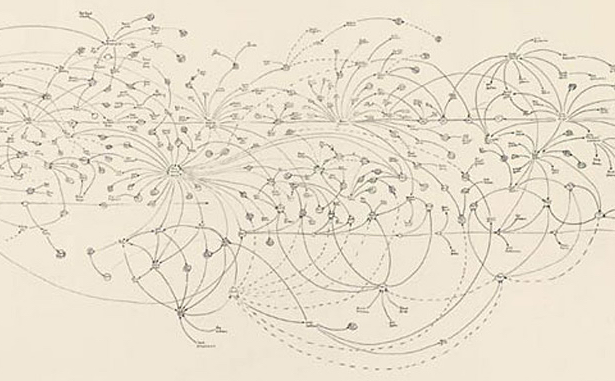
Mark Lombardi, BCCI-ICIC & FAB, 1972-91 (Fourth Version)
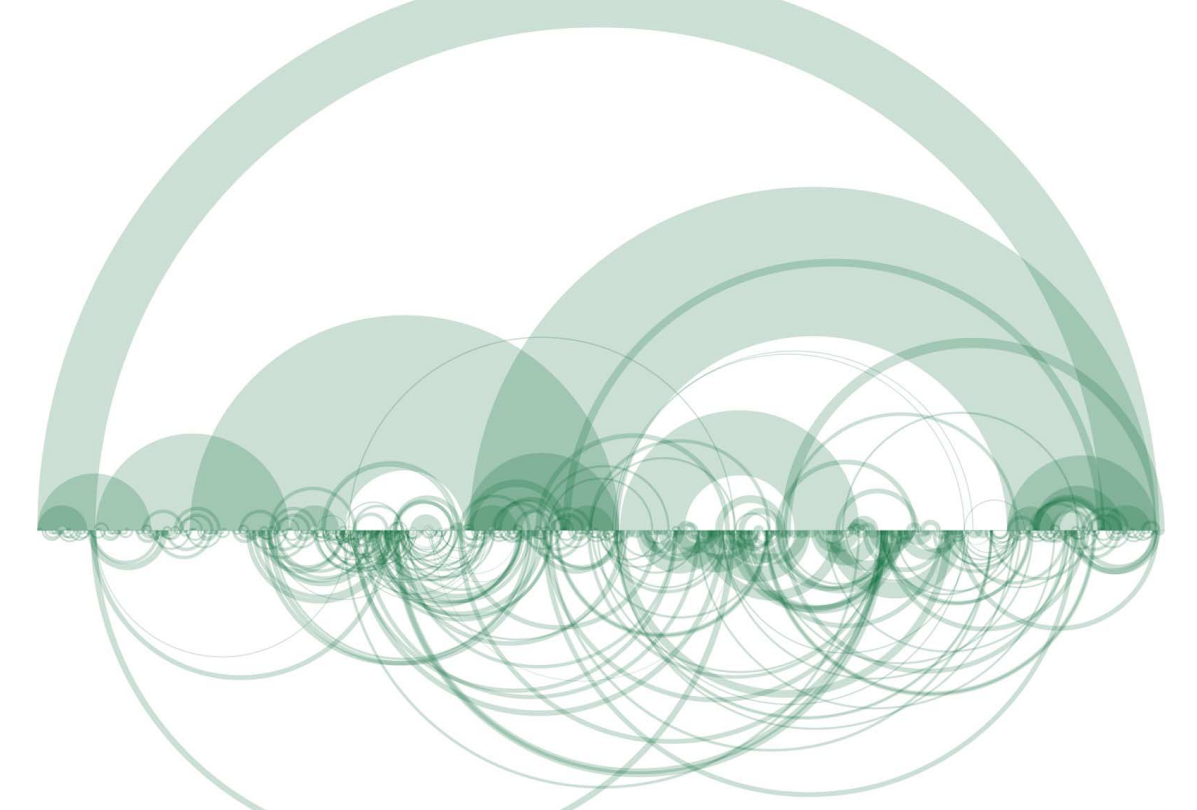
Martin Wattenberg, The Shape of Song
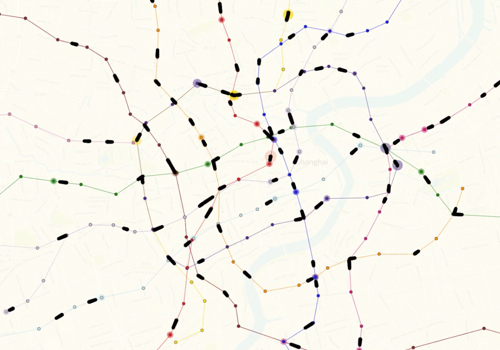
Till Nagel and Benedikt Groß, Metro Flow
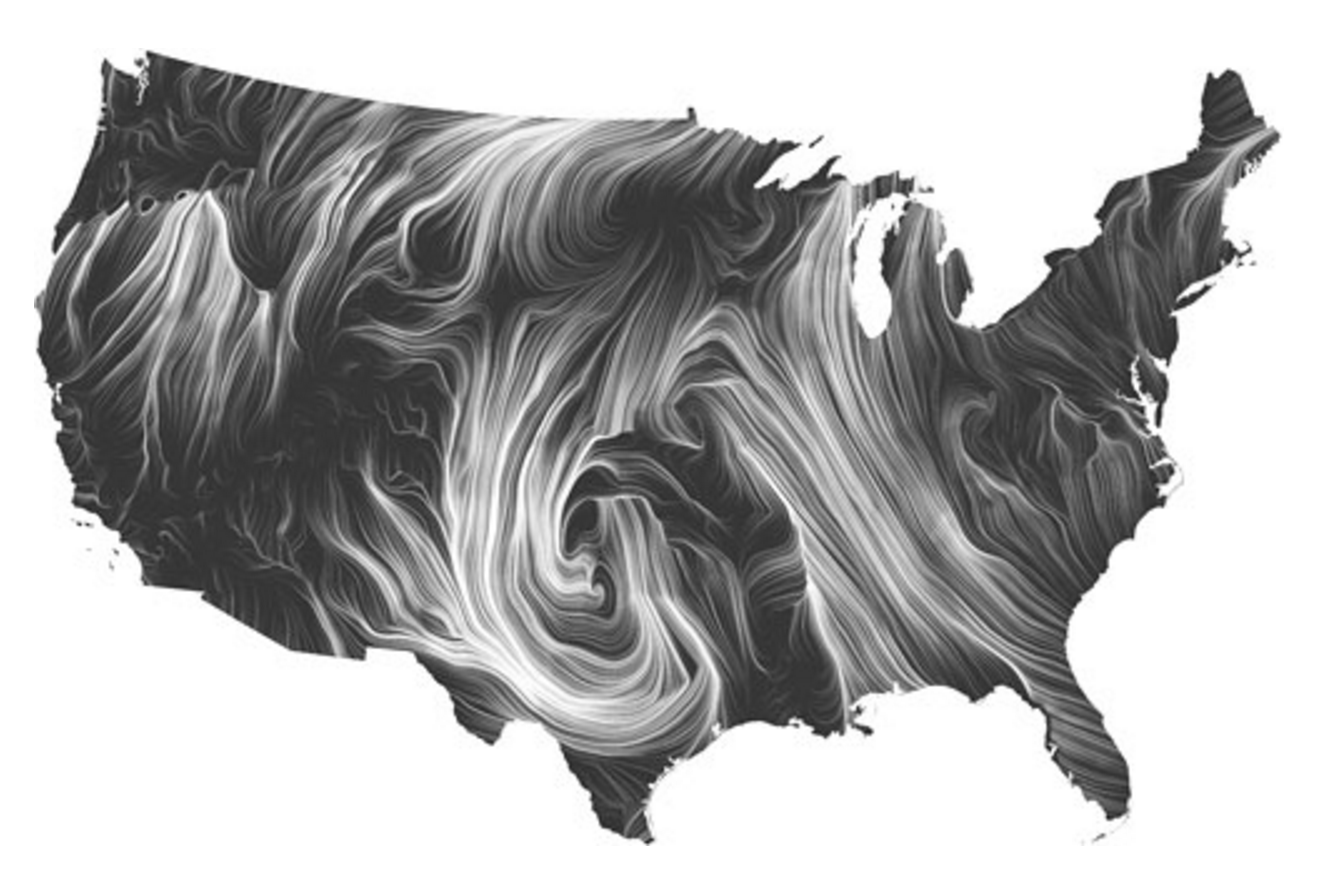
Fernanda Viégas and Martin Wattenberg, Wind Map
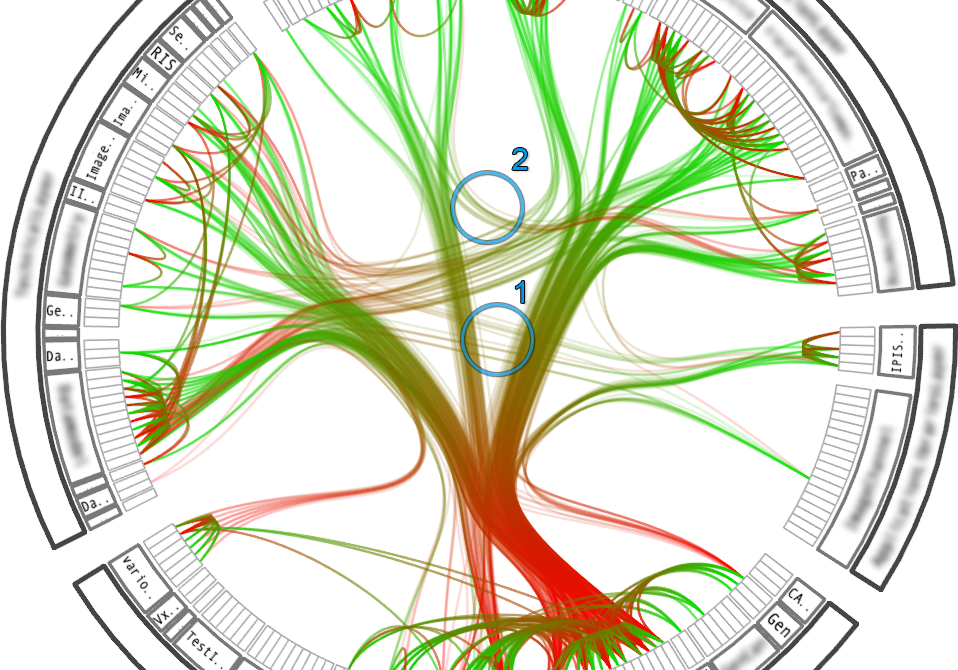
Danny Holten, Hierarchical Edge Bundling
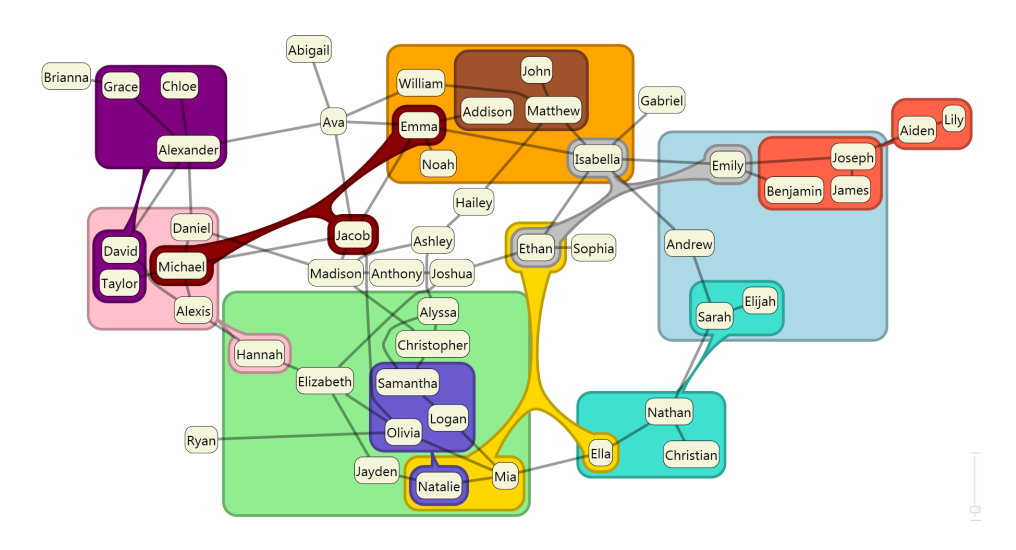
Nathalie Henry Riche and Tim Dwyer, Untangling Euler Diagrams