


Sonar Data Processing
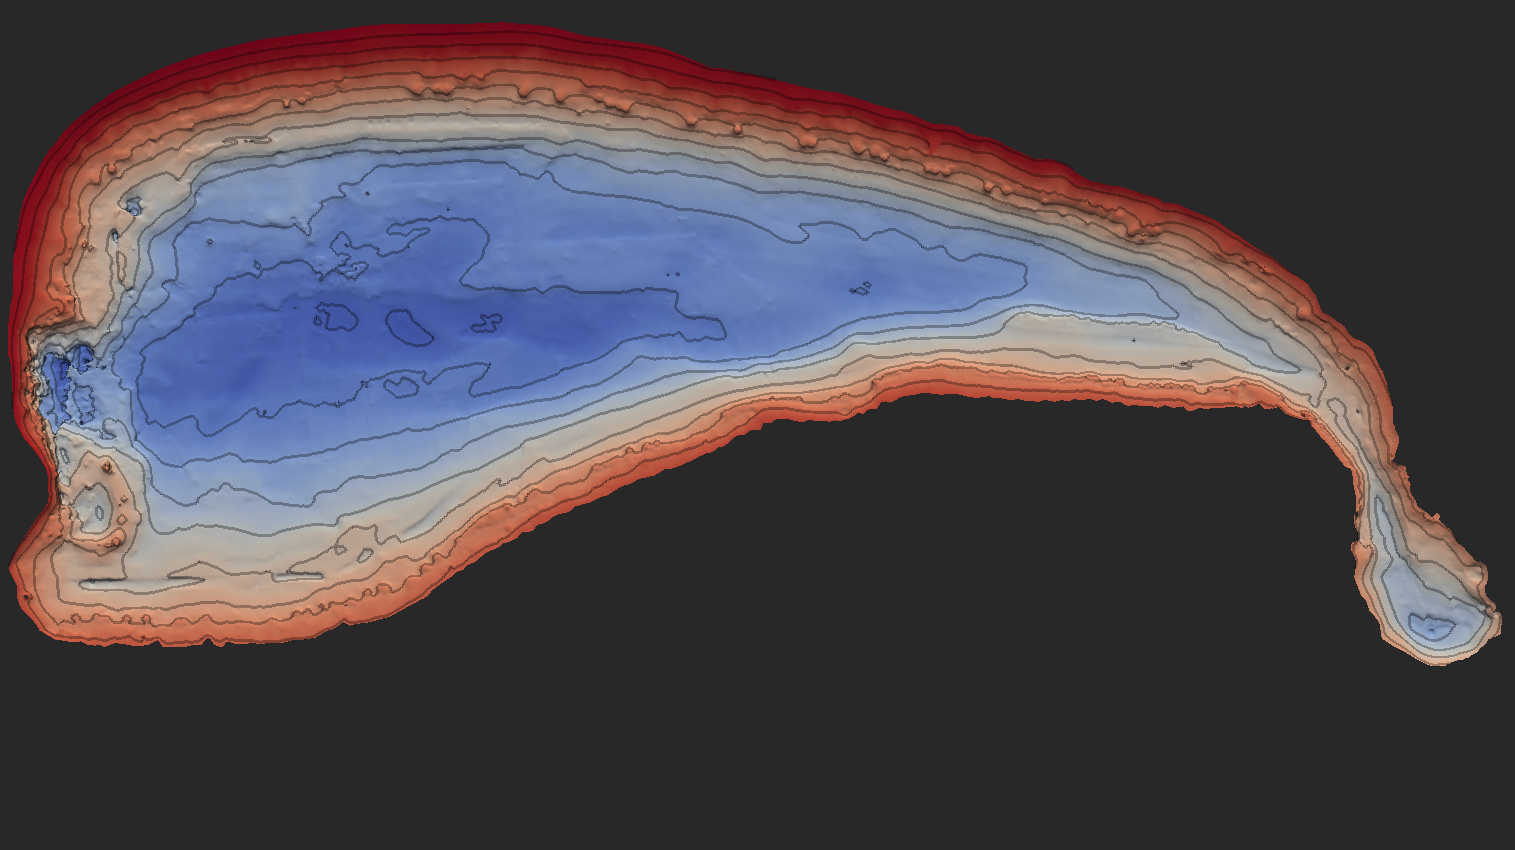
The new 3d model of West Lake Bonney and narrows region has been generated from a source sonar dataset of more than 200 million data points.
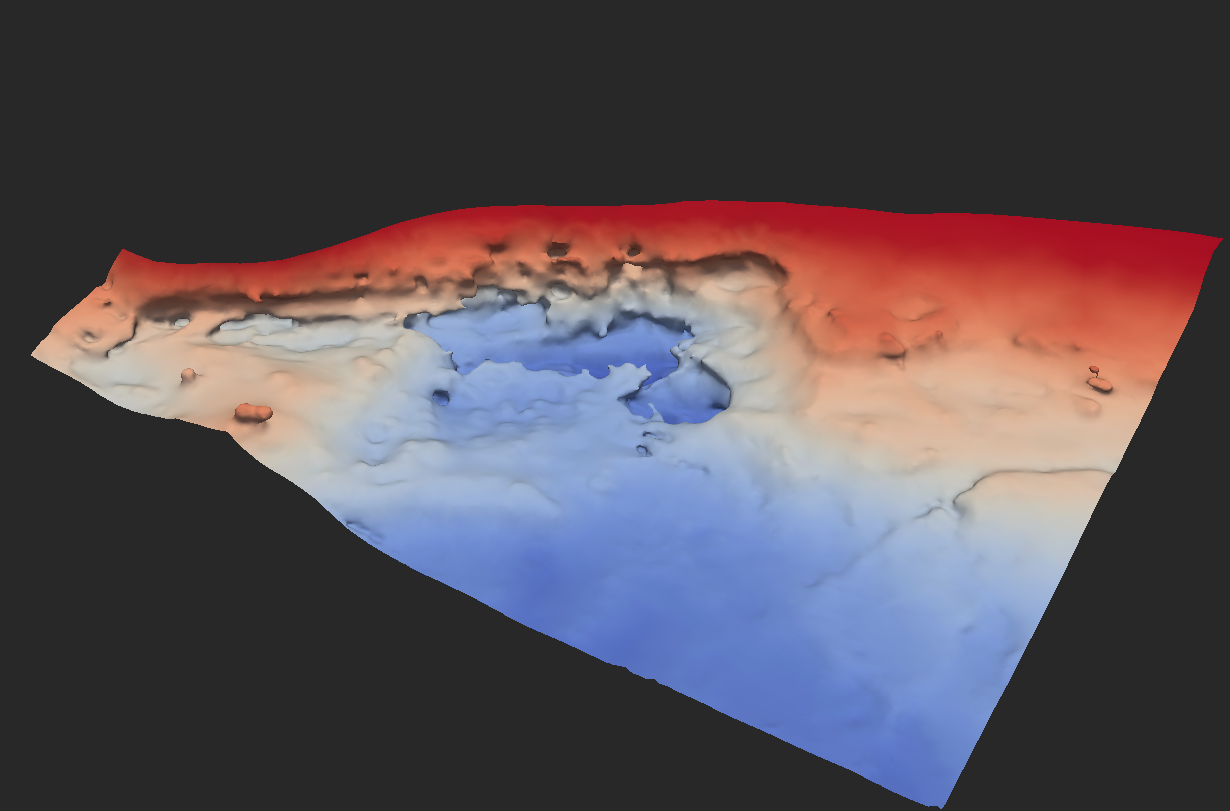
A detail of the glacier face: the fully 3d nature of the source data required the use of suitable algorithms for data processing and surface reconstruction.
The sonar mapping at Lake Bonney required full 3-D capabilities. A significant focus of scientic
investigation was the degree of influence of the Taylor Glacier at the west end of the lake. To this end, the
3-D structure of the glacier face and its interface with the lake bed were to be investigated and mapped
in detail. Additionally, the topography of shallow areas around the lake edge, not directly accessible
to the vehicle, was of interest. Thus, the high-resolution multi-beam sonar on the vehicle was operated
in two primary mapping modes: a down-looking mode, with the multi-beam mounted in a traditional
transverse fan configuration; and a forward-looking mode, with the multi-beam fan in a vertical plane
ahead of the vehicle.
Additional, lower-density sonar ranges were provided by 64 pencil-beam sonars arrayed around the vehicle providing a 3.5 steradian
view of the surroundings. Initial findings showed a ledge and overhang toward the bottom of the glacier face obscuring
the scientificly extremely interesting interface with the lake bottom. As a result, ENDURANCE performed two dives below the Lake Bonney
halocline at the glacier face, and successfully penetrated beneath the glacier, including high resolution
sonar mapping scans and chemical profiling of the sub-glacial cavity.
Creating the full high-resolution map of the lake and glacier face geometry with the data gathered
in the 2008 and 2009 campaigns proceeded in several steps. The online navigation was first corrected
to obtain the best possible basis for vehicle sonar readings. This proceeded with an initial detailed
calibration of vehicle pressure depth readings, taking into account the highly-variable water density, as
well as the varying lake surface height. Next, online navigation data were calibrated and corrected by
using the magnetic beacon surface fixes as absolute references. The resulting data provided navigation
solutions with estimated maximum absolute position errors of about 0.5 m throughout the lake.
Next, the raw sonar data were processed. This required correcting the raw returns to take into
account the significant refraction effects generated by the large chemocline. A sound speed model was
calculated using the water temperature and salinity readings from the vehicle sonde, and the model was
used to raytrace the sound beam paths into the water column to identify the true beam hit points. The
raytraced data were then cross-referenced with the navigation data to produce a raw 3-D point cloud
of the entire lake, consisting of approximately 256 million individual data points. The point cloud was
gridded and noise-filtered using an octree clustering algorithm, generating a final nearly-homogeneous
point cloud of about 1 million points. A modified poisson surface reconstruction algorithm was used
to generate a mesh of the entire lake, capturing the full 3-D details of the glacier region with a final
resolution down to 50 cm.
LINKS
deltaT processing tools (dttools) source on Google Code.
The dttools manual.
dttools binaries download page.